


Introduction
Chronic kidney disease (CKD), which affects more than 10% of the global population, is often irreversible and progresses to kidney failure. Although the prevalence of CKD in children is much lower than that in adults, the disease has a significant clinical influence during childhood. Children with CKD have different comorbidities than adults, seizure disorders, neurocognitive delays, and congenital heart disease, that confound their care and contribute to a heavy burden of care coordination [1]. In addition, children and adolescents with CKD face lifelong increases in morbidity and mortality and decreased quality of life [2]. However, because most information is adult-focused, there is a suboptimal understanding of pediatric CKD.
Current CKD guidelines suggest a stage-based approach to standardize the assessment of CKD severity and management of this disease [3]. Patients with CKD are classified based on their level of kidney function or estimated glomerular filtration rates (eGFRs), however, CKD staging does not consider the change in kidney function over time. Clinicians usually consider the trajectory of eGFR for a patient because it can impact treatment decisions [4]. In 1976, Mitch et al. [5] first reported that patients with CKD showed a linear decline in reciprocal serum creatinine concentration over time. To date, much of the literature on kidney function decline assumes a linear pattern of progression. More recently, it has become apparent that patients with similar CKD stages can follow different trajectories [6,7] and that the rate of decline in eGFR in CKD may vary even among those with similar diagnoses [6,8–11]. Thus, understanding kidney function trajectory may be difficult because some patients experience nonlinear disease progression, while others may exhibit stable kidney function over many years [12,13]. Clinicians usually consider the trajectory of eGFR for a patient because it may impact treatment decisions such as the frequency of follow-up and preparation for kidney replacement therapy [4]. A review of patterns of kidney function trajectory and factors that influence this trajectory in adult CKD has been published. In the adult CKD population, eGFR trajectory is important as a predictor of various clinical outcomes such as the risk of kidney failure, cardiovascular disease, and mortality in patients with non–dialysis-dependent CKD. Although CKD is a major health problem in both adults and children, the disease is far from the same in these two populations [14]. The etiology and progression rate of as well as treatment strategies for pediatric CKD are different from those in adults [15,16]. Few studies have prospectively evaluated the progression of CKD in children and adolescents with factors associated with progression such as proteinuria, hypoalbuminemia, hypertension (HTN), dyslipidemia, and anemia [17]. The decline in kidney function is not always linear in children, and the rate of decline in kidney function varies regardless of the baseline GFR, similar to that in adults [9,12,16]. Therefore, the aims of this study are as follows: i) to identify different patterns of subsequent decline in kidney function; and ii) to investigate factors associated with different patterns of eGFR trajectories in pediatric CKD.
Methods
Study population
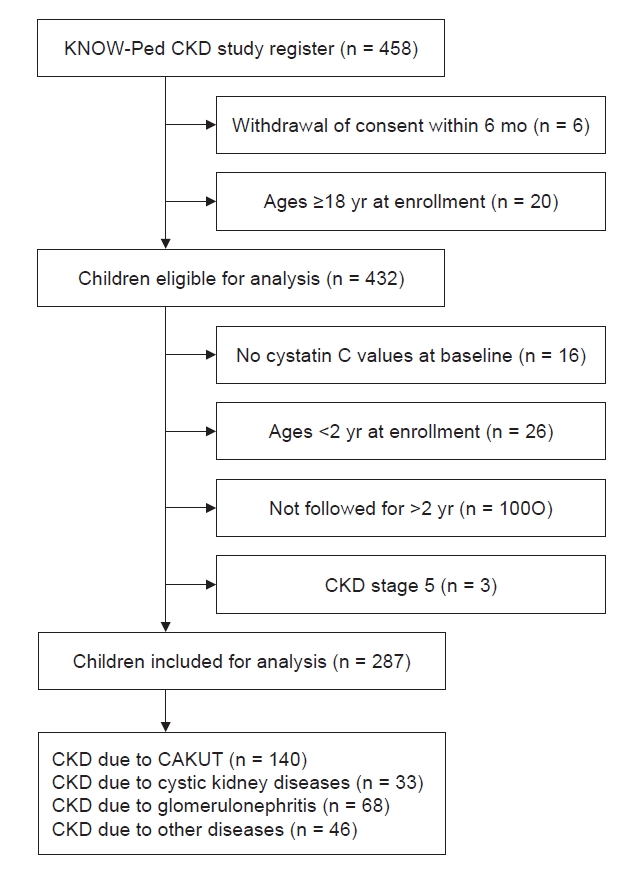
We used the eGFR data from the KoreaN cohort study for Outcomes in patients With Pediatric CKD (KNOW-Ped CKD) study, which is a nationwide, prospective, observational cohort study of pediatric CKD with a median follow-up of 6 years [18]. The KNOW-Ped CKD study protocol was approved by the ethics committees of each of the participating centers (Additional information) and registered at ClinicalTrials.gov (registration number: NCT02165878; date of registration: June 11, 2014). Seven major pediatric nephrology centers in Korea have participated in the study and enrolled 458 children with CKD. The inclusion criteria were patients with CKD aged <20 years at the time of consent, and the exclusion criteria have been previously described [18]. Informed consent was obtained from their caregivers or the participants according to their age. Data from a total of 432 subjects who were younger than 18 years at enrollment and had follow-up data were evaluated in this study. Subjects with no cystatin C values at baseline (n = 16), those with follow-up of less than 2 years (n = 100), those younger than 2 years of age (n = 26), and those with CKD stage 5 at enrollment (n = 3) were excluded (Fig. 1).
Measurement and data collection
After obtaining informed consent, baseline characteristics and annual visit data including medical history, information, laboratory test results, and imaging studies were collected in the KNOW-Ped CKD study. CKD was defined and staged according to the Kidney Disease Improving Global Outcomes (KDIGO) criteria [19]. The eGFR was calculated using the creatinine-cystatin C–based Chronic Kidney Disease in Children (CKiD) equation [20]. To analyze the CKD progression rate, the GFR was estimated annually using an estimating equation. Rapid progression was defined as a sustained decline in eGFR of more than 5 mL/min/1.73 m2 per year [3].
Acquisition of estimated glomerular filtration rate trajectory subgroups
Latent class linear mixed model (LCMM) is applied to investigate the heterogeneity of longitudinally measured profiles in the follow-up period to characterize subpopulation trajectories within a larger sample. LCMM allows the different number of measurements per patient or the different time points of measurement. In this study, we used LCMM with the goal of capturing the distinct trajectories of eGFR. It expressed the eGFR value of each patient at a specific time point as the sum of the expected value of eGFR in each class, and the individual patient’s departure from that expected value of eGFR. A quadratic trend for eGFR trajectories was considered to accommodate nonlinear mean trajectories over time [21,22]. Individual departures from the mean trajectory of each class were represented by random effects and random errors. Each patient was allocated to one of the classes where he or she had the highest probability of belonging. The number of trajectories was determined by goodness-of-fit statistics [23]. The Akaike information criterion, Bayesian information criterion (BIC), sample-size-adjusted BIC, entropy, log-likelihood, and integrated completed likelihood were used to determine the optimal number of latent classes according to their selection criteria. The results of the good-of-fit statistics for the LCMM are shown in Supplementary Table 1 (available online). We estimated two to five classes with the strategy of choosing the most appreciated model. The coefficients of the model in each class, variance-covariance of random effects, and mean posterior probabilities were presented in Supplementary Tables 2 to 4 (available online). Even though the five-class results showed the best model fit, its proportions in some classes were very low. Thus, we selected the four latent classes which allowed us to gain more clinically meaningful patterns for patients with CKD.
Subject characteristics in each trajectory subgroup
To assess the clinical relevance of the identified trajectory subgroups, we compared the following characteristics at baseline between each class: sex, age, primary diagnosis (glomerular or non-glomerular), CKD stage, birth history (prematurity, small for gestational age), presence of HTN (at enrollment and during follow-up), body mass index (BMI), use of renin-angiotensin-aldosterone system (RAAS) inhibitors, and laboratory findings including hemoglobin, uric acid, potassium, phosphorus, total cholesterol, albumin, acidosis, and spot urine protein/creatinine ratio (uPCR). Anemia was defined as hemoglobin lower than the 5th percentile for age and sex [24]. Hypoalbuminemia and metabolic acidosis were defined as serum albumin <3.8 g/dL and serum carbon dioxide level below 22 mEq/L [25]. Dyslipidemia was defined as the presence of one or more of the following: total cholesterol, ≥200 mg/dL; low-density lipoprotein cholesterol, ≥130 mg/dL; high-density lipoprotein cholesterol, <40 mg/dL; and triglyceride, ≥100 mg/dL for ages of 0 to 9 years and ≥130 mg/dL for ages of 10 to 18 years. These cutoff values were according to both United States and Korean studies on dyslipidemia in children and adolescents [26,27]. Hyperuricemia is defined when the serum uric acid concentration is ≥5.5 mg/dL [28]. Proteinuria was defined by the uPCR as the non-nephrotic range (uPCR, <2.0 mg/mg) or in the nephrotic range (uPCR, ≥2.0). Systolic blood pressure and diastolic blood pressure measurements were standardized for age-, sex-, and height-specific reference using data from Korean children and adolescents [29,30]. HTN was defined as a systolic and diastolic blood pressure equal to or exceeding the 95th percentile for age, sex, and height at the baseline visit. BMI measurements were analyzed as age-, sex-, and height-standardized scores, and underweight was defined as a BMI z-score below –1.65 [31]. The etiology of CKD was defined as a glomerular or non-glomerular disease and non-glomerular causes were categorized into congenital anomalies of the kidney and urinary tract (CAKUT) and others.
Statistical analysis
Continuous variables are expressed as medians with interquartile ranges (IQRs), and categorical variables are presented as frequencies with percentages. Group comparisons between the glomerular or non-glomerular groups were conducted using the independent samples t tests or Wilcoxon rank-sum test for continuous variables and the chi-square test or Fisher exact test for categorical variables. The Kruskal-Wallis test and chi-square test or Fisher exact test were performed to investigate group comparison derived by the LCMM. When there is a need to evaluate relationships for all possible pairs, we performed the Bonferroni correction method. Bonferroni correction is one of the most common approaches to reduce the chances of obtaining type 1 errors when pairwise comparisons are applied [32]. A multinomial logistic regression model of latent response was applied to explore the association with clinical risk factors such as age, baseline eGFR, glomerulopathy, hyperuricemia, and uPCR. All statistical analyses were performed using R version 4.3.2 (R Foundation for Statistical Computing; https://www.R-project.org/) and IBM SPSS version 27.0 for Windows (IBM Corp.). Statistical significance was considered at a p-value of <0.05 using two-tailed tests.
Results
Baseline characteristics
A total of 1,973 eGFR assessments of 287 cases over a median follow-up of 6.0 years (IQR, 5.0–8.0 years) were analyzed. The baseline characteristics of the study population are summarized in Table 1. The median age of children was 11.5 years, and the majority of them were male (n = 203, 70.7%). The baseline median eGFR was 63.3 mL/min/1.73 m2, and the annual rate of eGFR decline was 1.54 mL/min/1.73 m2. The etiology of CKD was presumed to be due to CAKUT in 140 patients (48.8%). Among the remaining 147 (51.2%), the glomerular disease was the most frequent cause of CKD (n = 68, 23.7%), followed by cystic kidney disease (n = 33, 11.5%) and other causes (n = 46, 16.0%). When grouped according to the cause of CKD, subjects with the glomerular disease were older at enrollment, had a higher baseline eGFR, had more severe hypoalbuminemia and proteinuria, and used RAAS inhibitors more often than those with the non-glomerular disease. In contrast, significantly more subjects with the non-glomerular disease were underweight and had preterm births and advanced CKD at baseline. The average annual rate of decline in eGFR was not different according to the cause of CKD (Table 1). Although the number is small, there was also no difference in the annual decline in eGFR according to the cause of CKD in patients with CKD stage 3 or above in our cohort (glomerular group vs. non-glomerular group: –2.4 vs. –2.1 mL/min/1.73 m2 per year, p = 0.75)
Analysis of estimated glomerular filtration rate trajectories
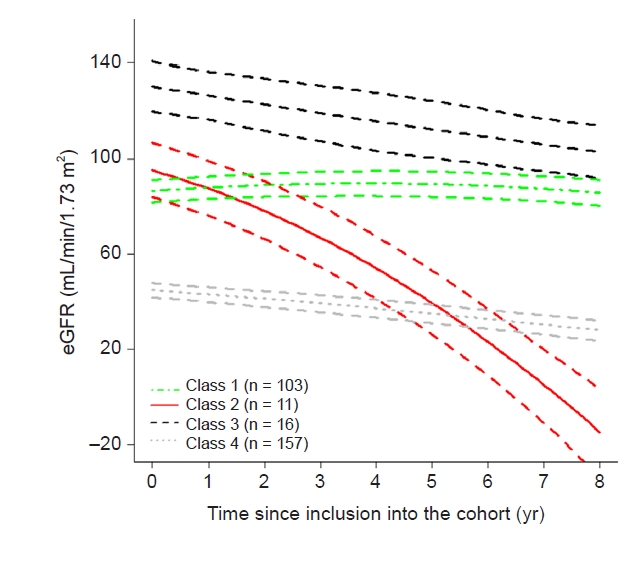
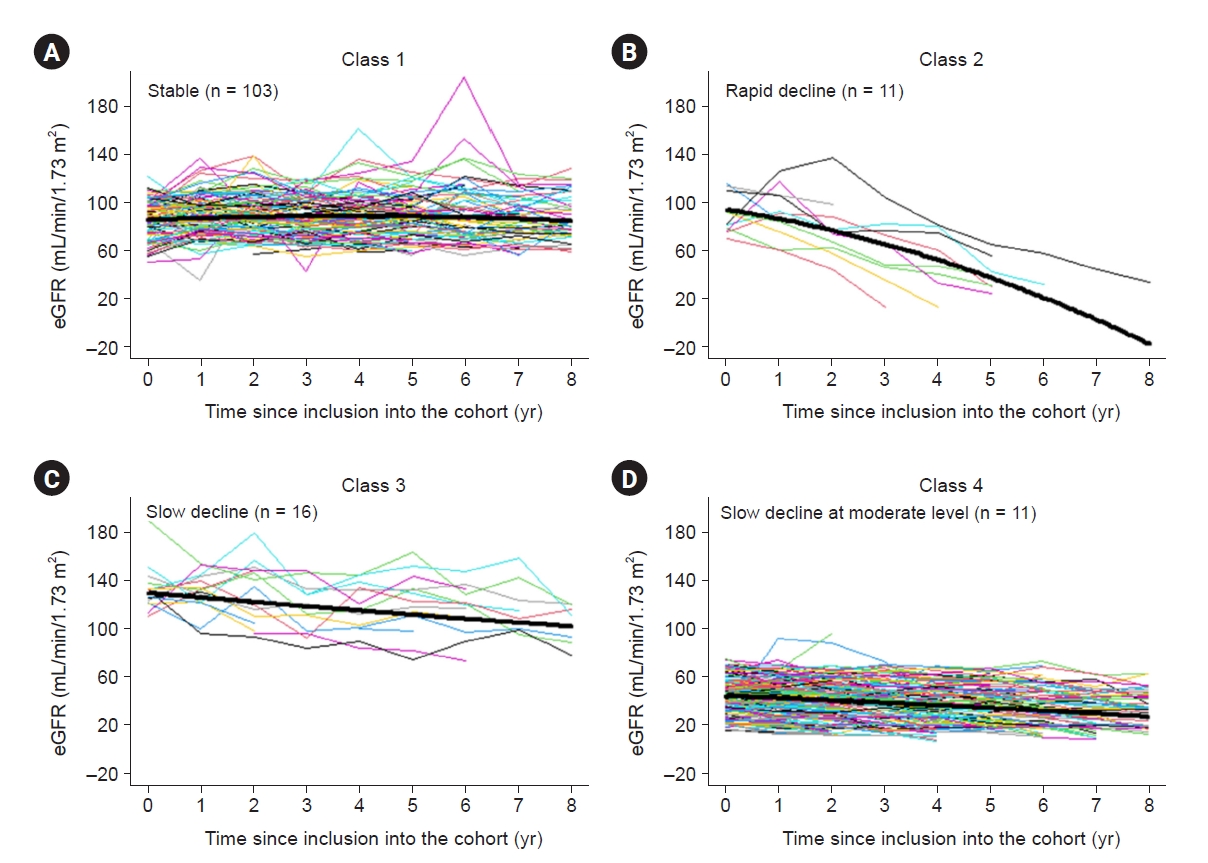
We identified four distinct kidney function trajectories over 8 years (Fig. 2; Supplementary Table 1–4, available online). However, two of the four classes represented less than 10% of the study population. In classes 1 to 3, subjects had a mild decrease to normal eGFR at enrollment. Class 1 had a normal to mildly decreased kidney function at enrollment and stable eGFR trend (n = 103 [35.9%]; initial median eGFR, 85.7 mL/min/1.73 m2; eGFR change, 0.2 mL/min/1.73 m2 per year [IQR, –0.8 to 1.7 mL/min/1.73 m2 per year]). The median age at enrollment was 12.2 years. About 26% of patients had glomerulopathy as a cause of CKD, and the median level of uPCR was 0.1 and 0.1 at baseline and last follow-up, respectively. Class 2 had a normal to mildly decreased kidney function and rapid decline in eGFR during follow-up (n = 11 [3.8%]; initial eGFR, 84.1 mL/min/1.73 m2; eGFR change, –10.5 mL/min/1.73 m2 per year [IQR, –18.7 to –9.0 mL/min/1.73 m2 per year]). The median age at enrollment was 9.9 years. The median level of uPCR was 0.4 and 1.2 at baseline and last follow-up, respectively. About 64% of patients had glomerulopathy as a cause of CKD, and the majority of patients used RAAS inhibitors at enrollment. All participants in class 2 showed a rapid decline in eGFR during the follow-up period and the last CKD stage was stage 2 in two patients, stage 3 in one patient, stage 4 in five patients, and stage 5 in three patients at the last follow-up. Class 3 had an upper normal range of kidney function at enrollment and a gradual decline in eGFR during follow-up (n = 16 [5.6%]; initial eGFR, 129.8 mL/min/1.73 m2; eGFR changes, –4.1 mL/min/1.73 m2 per year [IQR, –6.5 to –0.7 mL/min/1.73 m2 per year]). The median age at enrollment was 7.1 years. About 62.5% of patients had glomerulopathy as a cause of CKD, and the median level of uPCR was 0.6 and 0.4 at baseline and last follow-up, respectively. All participants in class 3 showed an upper normal range of eGFR at baseline. At the last follow-up visit, 82% of patients had still CKD stage 1, and the remaining three patients had a decrease in eGFR category from stage 1 to stage 2, with last eGFRs of 89.3, 74.9, and 73.0 mL/min/1.73 m2. In class 4 (n = 157, 54.7%), subjects had a low eGFR at enrollment (median, 44.6 mL/min/1.73 m2) with a slow rate of eGFR decline (eGFR change, –2.4 mL/min/1.73 m2 per year [IQR, –3.8 to –1.0 mL/min/1.73 m2 per year]). The median age at enrollment was 12.1 years. About 59.9% of patients had CAKUT as a cause of CKD, and 19.7% of patients were underweight according to Korean national growth charts. The median level of uPCR was 0.5 and 0.6 at baseline and last follow-up, respectively. Ninety-two participants in class 4 had a decrease in the eGFR category accompanied by a 25% or greater decrease in the baseline during follow-up, however, the absolute median eGFR change was –3.5 mL/min/1.73 m2 per year. The individual eGFR trajectories and the mean eGFR within each class are shown in Fig. 3, and the patient characteristics of each eGFR trajectory class are presented in Table 2.
Class 2, which showed a rapid eGFR decline, had more hypoalbuminemia, a higher uPCR, and a higher proportion of subjects using RAAS inhibitors and subjects with glomerulopathy as the cause of CKD than class 1 (Table 2). The prevalence of anemia, dyslipidemia, and HTN and the proportion of male subjects were not different between classes 1 and 2. All subjects in class 3, which showed a gradual decline, had stage 1 CKD with more hypoalbuminemia, glomerulopathy, higher uPCR, and hyperuricemia and were younger at enrollment than those in class 1. Classes 2 and 3 showed no significant difference except for the baseline eGFR and annual rate of eGFR decline. Subjects in class 4 showed a lower baseline eGFR, a higher uPCR, and more hypoalbuminemia and used RAAS inhibitors more often than those in class 1. Subjects in class 4 were more likely to have anemia, hyperuricemia, and metabolic acidosis than those in class 1; this class also showed a higher proportion of patients with a low body weight z-score at enrollment. The proportion of subjects with CAKUT was higher in classes 1 and 4 than in classes 2 and 3. The proportion of subjects with HTN was not different between classes; however, the use of RAAS inhibitors was significantly more frequent in class 2 than in the other classes. The proportions of subjects with nephrotic-range proteinuria and hypoalbuminemia were higher in class 2 than in the other classes.
Demographic and clinical factors associated with chronic kidney disease progression
A multinomial logistic regression model that involved more than two categorical dependent variables was performed to find which clinical features are related to latent classes (Table 3). We included three useful measures to assess goodness-of-fits in our model. The result showed values up to 1 meaning that the model predicted the outcome appropriately. In the result of class 1 (reference) vs. class 2, nephrotic-range proteinuria was associated with class 2 with statistical significance after adjusting for age, baseline eGFR, cause of CKD, and hyperuricemia. Compared with class 1, baseline eGFR is only affecting factors in classes 3 and 4.
Discussion
In this study, we investigated the progression of pediatric CKD and eGFR trajectory patterns by modeling using an LCMM. We found that those with a near normal eGFR at baseline (classes 1–3) did not show a uniform trajectory; some did not progress (class 1), while others progressed rapidly (class 2) or slowly (class 3). In addition to class 4, which had a lower baseline eGFR, approximately two-thirds of subjects showed a decline in eGFR irrespective of their baseline eGFRs (classes 2–4); however, in the rest, deterioration of kidney function was not apparent over the follow-up period (class 1). The eGFR trajectories were linear in the vast majority of the study population of children with CKD, whereas 5.6% of subjects showed a strong nonlinear eGFR decline, similar to the findings of previous studies in adults (class 2) [9,10].
The natural course of CKD progression is known to vary according to the underlying conditions in children [12,33]. To define GFR decline in pediatric CKD, we divided the two groups by the type of primary kidney disease. However, simply grouping patients according to the original disease of glomerulopathy vs. non-glomerulopathy (mainly CAKUT) did not discriminate the pattern of progression well, with the annual decline in eGFR of 2.3 mL/min/1.73 m2 in glomerular disease vs. 1.7 mL/min/1.73 m2 in non-glomerular disease (p > 0.05). This finding is different from that of the CKiD cohort in which children with glomerular disease were found to progress more quickly to kidney failure than children with non-glomerular disease [34]. These differences may stem from differences in the inclusion criteria between the CKiD and KNOW-Ped CKD studies, in which stage 1 CKD was included. While the subjects in the CKiD study had a median eGFR of 44 mL/min/1.73 m2 and an annual decline in eGFR of 1.8 mL/min/1.73 m2, the study population analyzed in this study had a median eGFR of 63.3 mL/min/1.73 m2 at enrollment, and the annual decline in eGFR was 1.5 mL/min/1.73 m2. Although the patients are small, the patients with CKD stage 3 or higher showed no difference in the annual decline in eGFR according to the original disease in our cohort. The majority of patients with stage 1 CKD had glomerular disease, and the median eGFR of patients with glomerular disease in our cohort was higher than those observed in the CKiD study [35], the North American Pediatric Renal Transplant Cooperative Study [36], and the India study [37]; this may explain why the decline in kidney function was not significantly more rapid in the glomerulopathy group than in the non-glomerulopathy group in this study.
The management of CKD focuses on delaying or preventing its progression, thus understanding CKD progression is important. Existing guidelines for CKD suggest a stage-based approach [3]. To date, the pattern of kidney function trajectory seems to be more important for understanding and managing CKD. It has become clear that, even in patients with stage 4 or 5 CKD, a significant portion of these patients may have stable renal function [4]. Patients with a slower trajectory may require less intensive follow-up. In this study, the differences between classes 1 (stable eGFR) and 2 (rapid decline in eGFR) included the proportion of patients with glomerulopathy as the cause of CKD and the uPCR (low in class 1). After adjusting for age, baseline eGFR, cause of CKD, hyperuricemia, and proteinuria, only nephrotic-range proteinuria was significantly associated with a rapid decline. This finding is similar to the findings of Jungers et al. [35], who found that the degree of proteinuria was one of the major determinants of CKD progression in adults. Therefore, children with CKD with non-nephrotic proteinuria may have a stable trajectory of eGFR and thus require less frequent follow-up. On the other hand, those with nephrotic-range proteinuria are expected to progress rapidly, as previously shown, and may need more frequent follow-up visits [35]. The prevalence of anemia, dyslipidemia, and HTN was also not different between the rapid progressors (class 2) and stable group (class 1), while in the CKiD study, nephrotic-range proteinuria, hypoalbuminemia, HTN, dyslipidemia, male sex, and anemia were associated with a significantly more rapid decline [10,18]. Since the majority of classes 1 and 2 were patients with early stages of CKD (stages 1 and 2) at enrollment and half of them had CKD stage 1, factors that are previously known to be related to a rapid GFR decline other than proteinuria might not be significant in patients with stage 1 CKD. In class 3, the median eGFR was above normal at enrollment and moderate decline over time, reaching a normal range. After adjusting for age, baseline eGFR, cause of CKD, hyperuricemia, and proteinuria, only baseline eGFR was associated between classes 1 (stable eGFR) and 3 (moderate decline in eGFR). An eGFR that is higher than normal may suggest glomerular hyperfiltration, a known risk factor for accelerated renal function decline in diabetic populations [38]; however, its relevance in nondiabetic populations remains yet to be identified. Previously reported equations such as the kidney failure risk equation and CKiD calculator to determine the risk of progression to kidney failure in children with CKD have been validated only for those with moderately impaired kidney function [39,40]. However, these equations do not include CKD with normal kidney function, thus, estimating the time to progression to kidney failure in children with CKD with a normal or high GFR is difficult. Since the small numbers of patients, further study is needed to determine exactly. As expected, those with a decreased eGFR at baseline experienced progression (class 4). However, it was more stable than class 2 or 3, which had lower proportions of patients with CAKUT than class 4, in which approximately 60% of patients had CAKUT. The annual eGFR decline of class 4 was faster, with an annual decline in eGFR of 2.4 mL/min/1.73 m2 than that of the general non-glomerulopathy group of 1.52 mL/min/1.73 m2 in our study, that of 1.3 mL/min/1.73 m2 per year in the CKiD study [28], and that of 1.0 mL/min/1.73 m2 per year in those with congenital kidney disease [40]. In class 4, anemia, hyperuricemia, metabolic acidosis, and hyperuricemia were evident; these are characteristics of patients with a lower eGFR than those in class 1. After adjusting for age, baseline eGFR, cause of CKD, hyperuricemia, and proteinuria, only baseline eGFR was associated between classes 1 and 4.
Kidney disease trajectories have been traditionally assessed by plotting the slope of 1/creatinine. Several studies have recently applied more sophisticated modeling techniques including LCMMs instead of simple linear models [9,41]. An LCMM is a method developed to identify classes of individual longitudinal trajectories of quantitative indicators [10]. An LCMM supposes that the patterns of a population in a specific state are diverse and consist of a number of latent classes of subjects identified by estimated mean profiles of trajectories. This method has been used to evaluate various medical conditions, such as depression [42], atherosclerosis [43], or disability [44], to identify clinical meaning and suggest relevant guidance. In kidney disease, an LCMM was used to identify the distinct kidney function trajectories in CKD patients [22]. In this study, the proportions of patients of the four classes were diverse. Two of them represented only 3.8% and 5.6% of the population, however, a similar pattern was observed when the groups were divided differently. The proportions of each kidney trajectory class are available in Supplementary Table 1 (available online). Most of the patients (10 of 11) who were classified as class 2 were assigned to the same class even when divided into three or five groups. In class 3, all patients were assigned to class 3 when divided into three groups, and approximately half of the patients were assigned to class 3 when divided into five groups. Even if the number of groups differed, classes 2 and 3 showed a unique pattern; thus, the data are not scattered and are included in the same group. Therefore we assumed that the application of an LCMM could identify smaller subgroups of the population with pediatric CKD. Our study is the first report to reveal heterogeneity in the kidney function trajectory using an LCMM in pediatric patients with stage 1 to 4 CKD and to demonstrate that kidney function trajectories were not completely determined by the CKD stage at enrollment or the cause of CKD. Such modeling is valid to draw meaningful conclusions since few subjects reached the endpoint of kidney failure because our study included a significant number of subjects with stage 1 CKD (n = 64).
Our study has some strengths and limitations. First, half of the subjects had early CKD (CKD stages 1 and 2); therefore, information regarding advanced CKD might be insufficient. On the other hand, this may be a strength of this study. We identified changes in eGFR in early CKD, and even though the participants had CKD stages 1 and 2, the average decline of –1.5 per year is still considerable. Second, the prevalence of HTN, a known risk factor for CKD progression was similar at enrollment in each group. It is worth noting that most rapid progressors were already receiving treatment with RAAS inhibitors, which may have influenced the study results. Furthermore, the investigation of new-onset HTN during the follow-up period was not within the scope of this study. Further research is warranted to better understand the clinical implications of HTN within this cohort. Third, despite the presence of numerous potential risk factors for disease progression among children with CKD, our study only identified nephrotic-range proteinuria as being associated with a rapid decline in eGFR. Given the relatively small sample size, it was not feasible to conduct a subgroup analysis for comorbidities associated with CKD and to investigate other factors such as low birth weight, prematurity, and medication use. Additionally, due to resource limitations, we were unable to assess the impact of acute kidney injury on the course of CKD. Fourth, although an LCMM is a powerful technique to elucidate the structure underlying population heterogeneity, some subgroups are too small, potentially limiting statistical power and the generalizability of the results. We also excluded patients younger than 2 years of age because of different normal eGFRs and patients with less than 2 years of follow-up to minimize the risk of confounding bias. These exclusions may have caused selection bias. Consequently, these inherent limitations present challenges in assessing and drawing definitive conclusions regarding the diverse patterns of CKD progression in children. However, the data were obtained from the KNOW-Ped CKD study, which is a relatively large Asian prospective pediatric CKD cohort with a long-term follow-up period, which is unique and provides considerable information.
In this study, we revealed kidney function trajectories and their determinants using a prospective cohort with a 9-year follow-up period. We characterized four distinct eGFR trajectories among pediatric subjects with CKD: those with a stable eGFR, those with a consistent fast decline, those with a consistent gradual decline, and those with a consistent slow decline. Subjects in the fast-declining trajectory had nephrotic-range proteinuria. Although the eGFR is not low in these patients, those with nephrotic-range proteinuria are expected to progress rapidly and may need more frequent follow-up.
 PDF Links
 PubReader
 ePub Link
 Full text via DOI
 Download Citation
 Supplement table 1
 Print
Print


")


