Genome-wide association study and fine-mapping on Korean biobank to discover renal trait-associated variants
Article information

Abstract
Background
Chronic kidney disease is a significant health burden worldwide, with increasing incidence. Although several genome-wide association studies (GWAS) have investigated single nucleotide polymorphisms (SNP) associated with kidney trait, most studies were focused on European ancestry.
Methods
We utilized clinical and genetic information collected from the Korean Genome and Epidemiology Study (KoGES).
Results
More than five million SNPs from 58,406 participants were analyzed. After meta-GWAS, 1,360 loci associated with estimated glomerular filtration rate (eGFR) at a genome-wide significant level (p = 5 × 10⁻⁸) were identified. Among them, 399 loci were validated with at least one other biomarker (blood urea nitrogen [BUN] or eGFRcysC) and 149 loci were validated using both markers. Among them, 18 SNPs (nine known ones and nine novel ones) with 20 putative genes were found. The aggregated effect of genes estimated by MAGMA gene analysis showed that these significant genes were enriched in kidney-associated pathways, with the kidney and liver being the most enriched tissues.
Conclusion
In this study, we conducted GWAS for more than 50,000 Korean individuals and identified several variants associated with kidney traits, including eGFR, BUN, and eGFRcysC. We also investigated functions of relevant genes using computational methods to define putative causal variants.
Introduction
Chronic kidney disease (CKD) is a significant health issue with a globally increasing incidence, affecting over 850 million individuals with kidney diseases worldwide [1]. To uncover the pathogenesis of CKD, global consensus initiatives have conducted large-scale genome-wide association studies (GWAS) and meta-analyses of GWAS (meta-GWAS). During the earlier stage of the GWAS era, several loci associated with renal function and kidney disease have been identified [2,3]. These studies have demonstrated the vast potential of GWAS in CKD research. Recently, several fine-mapping studies have been conducted in conjunction with GWAS to perform functional annotations of identified variants, shedding light on the pathogenesis of CKD [4–8]. However, most GWAS were focused on European ancestry.
The Korean Genome and Epidemiology Study (KoGES) is a nationwide cohort that has collected clinical and genetic information since 2001 [9]. Using this cohort, GWAS have been conducted on various traits, including alcoholic liver disease [10], serum uric acid [11], and muscle mass [12]. Estimated glomerular filtration rate (eGFR) is a widely accepted kidney trait for GWAS. A few studies have been conducted to identify single nuclear polymorphisms (SNP) associated with eGFR in the Korean population [13,14]. However, these studies have reported associated SNPs without functional fine-mapping or functional annotations. Given that SNPs discovered by GWAS are regulatory variants associated with complex traits and diseases, uncovering functional annotation and fine-mapping are important [15]. Therefore, we conducted a GWAS to identify loci associated with eGFR and a fine-mapping study to reveal putative causal SNPs in the Korean populations.
Methods
Participants and genotyping
This study protocol was reviewed and approved by the Institutional Review Board (IRB) of Soonchunhyang University Cheonan Hospital (Cheonan, Korea) and the need for informed consent was waived by IRB (No. SCHCA 2021-11-035). This study complied with the principles of the Declaration of Helsinki.
All genotype data were obtained from the Korea Biobank Array Project managed by the Korea National Institute of Health. All samples and clinical data were collected as part of the KoGES [9]. The cohort comprised three sub-cohorts, namely the Korean Association Resource (KARE), Health Examinee (HEXA), and Cardiovascular Disease Association Study (CAVAS). The methodology for genotyping across all cohorts has been detailed elsewhere [16]. Shortly, these cohorts comprised community-dwellers aged ≥40 years at baseline. The KARE cohort, also known as the Ansan and Anseong cohort, included participants from the Ansan and Anseong regions representing urban and rural areas, respectively. The HEXA study recruited participants who attended regular health check-ups in urban areas. The CAVAS cohort had participants from rural areas to investigate cardiovascular diseases.
The three sub-cohorts consisted of 10,030, 177,357, and 28,338 participants, respectively. Among them, 8,840, 58,694, and 8,105 subjects were genotyped using Affymetrix Genome-Wide Human SNP array version 5.0 (Affymetrix) [17] for KARE and Korea Biobank Array [16] for HEXA and CAVAS. Although the quality control process of genotyping was initially conducted before distributing cohort data to researchers, as previously reported [16–18], we additionally performed rigorous quality control processes [19]. These processes involved quality controls based on predetermined criteria, such as SNPs including low genotype calls (<0.01), individuals with high rates of genotype missingness (<0.05), sex discrepancy-based X-chromosome homozygosity, low minor allele frequency (MAF, <0.05), Hardy-Weinberg equilibrium (p < 1 × 10⁻⁶), individuals with heterozygosity rate deviated ±3 standard deviation from the mean, cryptic relatedness based on pi-hat threshold of 0.2, and population stratification. Population stratification was analyzed using a multidimensional scaling (MDS) approach for KARE and CAVAS cohorts. However, principal component analysis was used to calculate population stratification in the HEXA cohort due to the large sample size that made MDS analysis unfeasible.
Genotype imputation
After completing quality control, the imputation of all cohorts was carried out using the 1000 Genome Project Phase 3 reference panel which comprised an Asian population [20]. The imputation was performed using Beagle 5.4 and involved haplotype phasing [21] and imputation [22]. Following the imputation process, additional quality control was executed based on imputation information quality score of >0.8 and MAF of >0.05.
Phenotype and covariates
In the HEXA cohort, hemoglobin A1c (HbA1c) was available for a subset (only 54%) of participants at baseline. Due to the limited availability of laboratories in the HEXA cohort at baseline, we utilized data from the first follow-up where almost all individuals had HbA1c results. Hence, the first follow-up data from the HEXA cohort were utilized for this analysis. For the KARE and CAVAS cohorts, baseline data were used for analysis.
The primary phenotype in all cohorts was a quantitative trait, which was defined by eGFR using the Chronic Kidney Disease Epidemiology Collaboration equation [23]. Creatinine levels were measured using a Hitachi Analyzer 7600 (Hitachi) in KARE and an ADVIA 1650 (Siemens Healthcare) in the CAVAS cohort. Serum cystatin C was measured using a Cobas c702 (Roche). All KARE and CAVAS cohort samples were measured at Seoul Clinical Laboratories. It should be noted that the HEXA cohort was based on data from a nationwide health examination where each laboratory result was measured at the institution where the health examination was performed. Thus, specific methods used by each institution were unavailable.
To estimate an unbiased effect of genotype on renal function (i.e., eGFR), subjects with diabetes mellitus (DM) or albuminuria were excluded. As covariates, age, sex, body mass index, systolic blood pressure (SBP), and past medical history of hypertension were used. Past medical history of hypertension was defined as SBP of ≥140 mmHg, diastolic blood pressure of ≥90 mmHg, and self-report by participants. History of DM was defined by HbA1c of ≥6.5%, fasting glucose of ≥126 mg/dL, and self-report by participants. Albuminuria was defined by ≥1+ in the urine dipstick test. Individuals with missing values in covariates were excluded from further analysis. Population structure was visually inspected and found to be homogenous, with all participants having Korean ancestry (Supplementary Fig. 1, available online). Nonetheless, to adjust for population stratification, 10 principal components calculated based on genotypes were included as covariates.
In addition to eGFR, blood urea nitrogen (BUN) and eGFR calculated using serum cystatin C (eGFRcysC) [24] were used for validation, although serum cystatin C was available for the CAVAS cohort. All phenotypes were quantitative traits since the prevalence of CKD based on eGFR criteria was too low to perform a case-control analysis. When the histogram of each variable was normally distributed, original values were used as phenotype. Otherwise, naturally transformed values were used.
Genome-wide association study and meta-analysis
Most GWAS were performed using plink version 1.9 [25]. Quantitative trait was analyzed using linear regression with the plink command “--linear” and prespecified covariates with the assumption of an additive genetic model. An association study was performed for the three cohorts individually, then a meta-GWAS analysis was performed using METAL (Meta-Analysis Tool for Genome-wide Association Scans) with genomic control correction [26]. Genome-wide significant (GWS) level was defined as p of <5 × 10⁻⁸. Distribution of observed p-values and estimated p-values of given SNPs were depicted using quantile-quantile (QQ) plots. QQ plots and Manhattan plots were drawn using qqman R packages of R software (R Foundation for Statistical Computing).
Functional mapping and annotation
Following meta-GWAS, variants associated with eGFR with GWS level were selected for validation analysis. To confirm associations of these variants with other biomarkers, results from meta-GWAS of log-transformed BUN (log-BUN) and eGFRcysC were utilized. Variants that had both a directionally opposite, nominally significant association (p < 0.05) with log-BUN and a directionally concordant, nominally significant association with eGFRcysC were defined as validated loci.
We used FUMA (Functional Mapping and Annotation of Genome-Wide Association Studies) to perform functional mapping and annotation with specific purposes: (1) to specify genomic risk loci that were independently significant with other SNPs (i.e., clumping); (2) to annotate genes; and (3) to validate enrichment in tissue expression data [27]. At first, FUMA selected independent significant SNPs that exhibited a GWS association (p < 5 × 10⁻⁸) and were independent (r2 < 0.6). Thus, independent significant SNPs were equivalent to SNPs that remained after clumping GWAS-tagged SNPs with the same p-value and r2 threshold. Based on these SNPs, lead SNPs were identified when they were independent of other SNPs with a level of r2 < 0.1. If the linkage disequilibrium (LD) blocks of those independent significant SNPs were closely positioned (within ±250 kb from the first and last of the LD block), they were integrated into a genomic risk region. FUMA defined the lead SNP of the genomic risk region as the genomic risk loci. FUMA used ANNOVAR to annotate and map identified variants [28]. Additionally, we performed MAGMA (Multi-marker Analysis of Genomic Annotation) gene analysis [29] and conditional and interaction gene-set analysis (i.e., gene-property analysis) [30] using FUMA. The gene-property analysis was based on tissue expression data from Genotype-Tissue Expression (GTEx) v8 [31]. Of all 54 GTEx tissues, 49 tissues with a sample size of ≥70 were used.
Gene-set and tissue enrichment analysis
Additional gene-set enrichment analysis was performed using the DOSE R package [32]. To investigate tissue type-specific enrichment based on GWAS summary statistics, stratified LD score regression applying to specifically expressed genes (LDSC-SEG) was performed [33]. Two gene expression datasets from the GTEx project [31] and Franke lab [34], of which annotation data had previously been curated specifically for East Asians by LDSC-SEG builders, were used for LDSC-SEG [35].
When more than two independent significant SNPs were identified and remained after validation with other biomarkers (i.e., log-BUN and eGFRcysC) within a genomic risk region, conditional analysis was performed using a Genome-wide Complex Analysis (GCTA) tool [36]. Loci with p of <5 × 10⁻⁸ were retained after conditional analysis for the most significant SNPs (lowest p-value) within a genomic risk region. Genotype data from the HEXA cohort, which had the majority of data, were used as the LD reference for conditional analysis.
Results
Baseline characteristics and phenotypes
After genotype quality control, 8,384, 58,079, and 7,966 subjects remained in the KARE, HEXA, and CAVAS cohorts, respectively. Among the 58,079 subjects in the HEXA cohort, 51,902 visited at the first follow-up schedule. Individuals with missing values and those with DM or albuminuria were then removed. Finally, 6,848, 44,787, and 6,771 individuals remained in the KARE, HEXA, and CAVAS cohorts, respectively (Supplementary Fig. 2, available online).
Table 1 shows the baseline characteristics of the KoGES cohort. Median serum creatinine levels in KARE, HEXA, and CAVAS cohorts were 0.80 (interquartile range [IQR], 0.70–1.00), 0.75 (IQR, 0.66–0.89), and 0.91 (IQR, 0.83–1.03), respectively. The median age of the KARE cohort was lower than that of the HEXA cohort or the CAVAS cohort. As all cohorts targeted the general population, the proportion of CKD patients was low. The highest proportion of CKD, defined by an eGFR of <60 mL/min/1.73 m2, was observed in the CAVAS cohort.

Baseline characteristics of HEXA, KARE, and CAVAS cohorts
Histograms indicated that eGFR and eGFRcysC of each cohort were normally distributed, while BUN was more likely to be normally distributed when it was naturally log-transformed (Supplementary Fig. 3, available online). Hence, eGFR and natural log-BUN were used as quantitative traits.
Genotypes
After quality control and genotype imputation processes, 4,864,729, 5,741,581, and 5,746,961 variants remained in the KARE, HEXA, and CAVAS cohorts, respectively. Following meta-GWAS analysis, 1,360 loci were found to be associated with eGFR at the GWS level. Manhattan plots of meta-GWAS for eGFR revealed several regions with significant association (outer circle of Fig. 1). Results from the meta-GWAS on log-BUN demonstrated that 2,454 loci were associated at the GWS level (Supplementary Fig. 4, available online). In addition, 143 SNPs were associated with eGFRcysC at the GWS level. Of 1,360 variants associated with eGFR, 399 were validated by at least one biomarker (i.e., log-BUN or eGFRcysC) and 149 were validated by both biomarkers (Supplementary Table 1, available online).
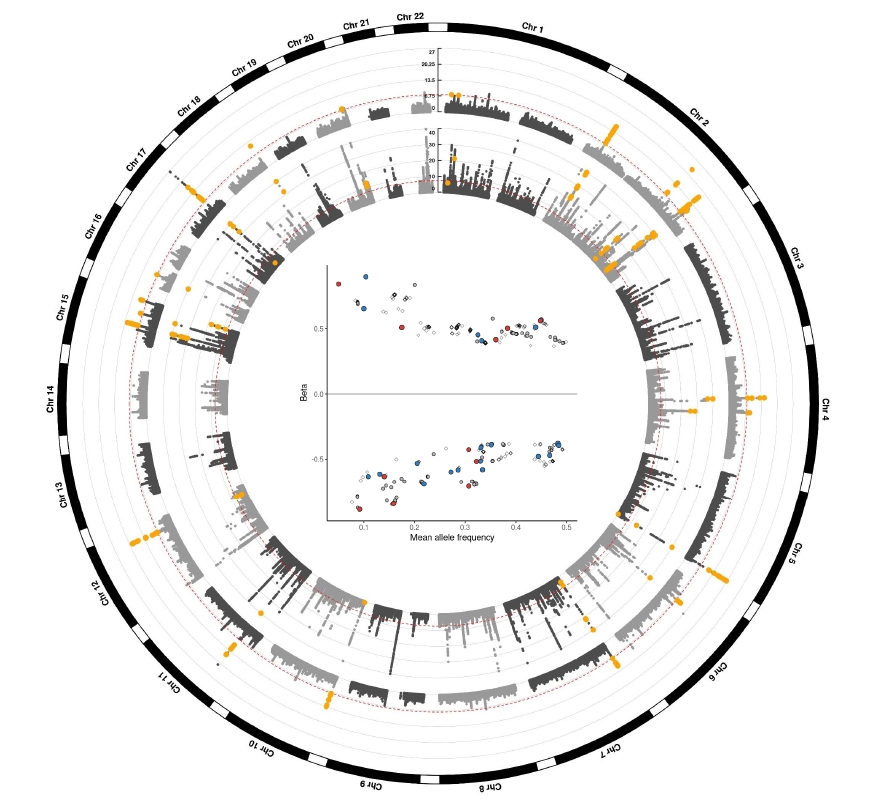
Circos plot for GWAS meta-analysis.
The outer circle depicts the loci associated with eGFR in KoGES, while the inner circle represents those in a previously published GWAS by Stanzick et al. [37]. Yellow points indicate validated loci by at least one biomarker (log-BUN or eGFRcysC). The Y-axis denotes –log10(p) for association with eGFR. In the inner circle, the Y-axis was truncated at 40. Red dotted lines indicate a genome-wide significant level (p = 5 × 10⁻⁸). The inner plot illustrates a correlation between beta and mean allele frequency of validated loci (red points, lead SNPs; blue points, independent significant SNPs; gray points, validated by both log-BUN and eGFRcysC).
BUN, blood urine nitrogen; eGFR, estimated glomerular filtration rate calculated using serum creatinine by CKD-EPI equation; eGFRcysC, eGFR calculated using serum cystatin C by CKD-EPI equation; GWAS, genome-wide association study; KoGES, the Korean Genome and Epidemiology Study; SNP, single nucleotide polymorphism.
Validated loci (yellow points in Fig. 1) showed a similar pattern to that of a previously reported large GWAS study (inner circle of Fig. 1) [37]. The inner plot in Fig. 1 illustrates 399 validated loci for at least one biomarker. It was worth noting that the effect (beta) of validated variants was more prominent in cases where the mean allele frequency was lower.
Functional mapping and annotation
FUMA identified 87 independent significant SNPs, consisting of lead SNPs and 33 genomic risk regions. Of these, 31 loci were validated by at least one biomarker (log-BUN or eGFRcysC) (Fig. 2A). Fourteen loci were validated by both eGFRcysC and log-BUN. Ten loci were validated by log-BUN and seven loci were validated by eGFRcysC. Scatterplots of effect (beta) between eGFR and other biomarkers are also depicted in Fig. 2 (red dots validated by both log-BUN and eGFRcysC, blue dots validated by log-BUN, and green dots validated by eGFRcysC).
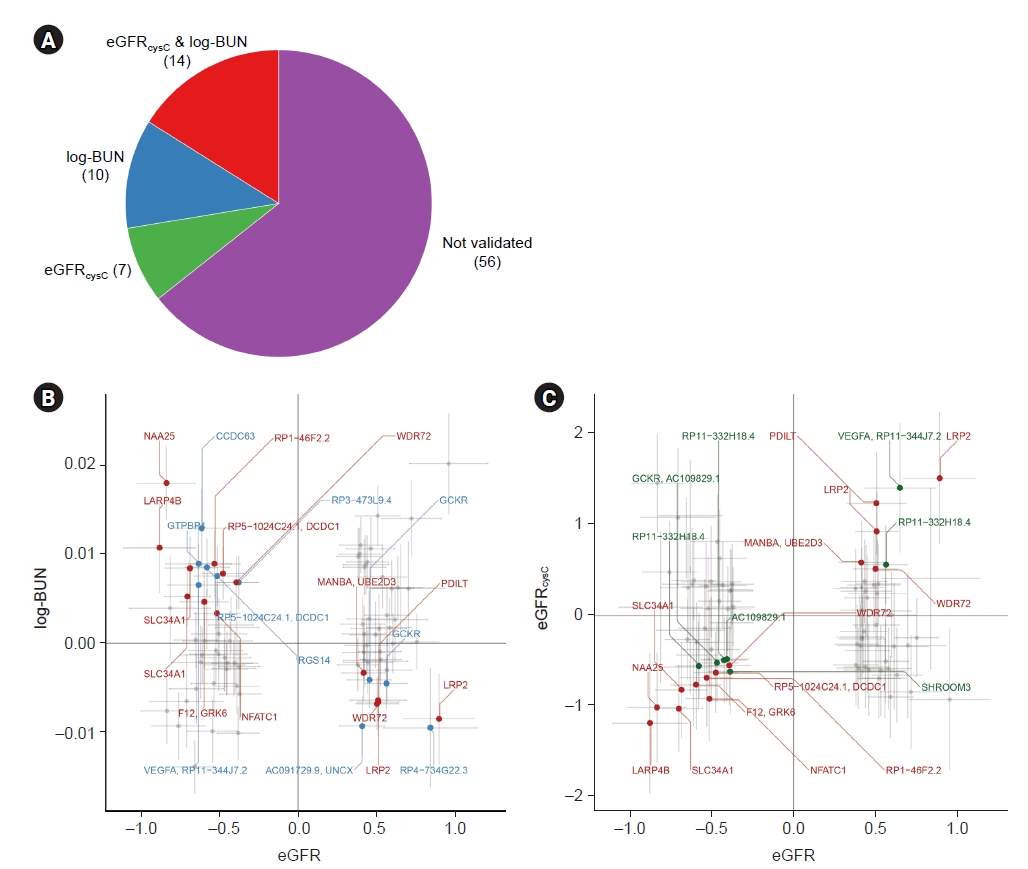
Independent significant SNPs validated by at least one biomarker, log-BUN or eGFRcysC.
FUMA identified 87 independent significant SNPs. (A) Among them, 14 SNPs were validated by both log-BUN and eGFRcysC, whereas 56 were validated by none of them. The concordance between eGFR and log-BUN (B) and that between eGFR and eGFRcysC (C) are represented. Red dots correspond to independent significant SNPs validated by both log-BUN and eGFRcysC, while blue dots represent loci validated by log-BUN (B) and green dots represent those validated by eGFRcysC (C).
BUN, blood urine nitrogen; eGFR, estimated glomerular filtration rate calculated using serum creatinine by CKD-EPI equation; eGFRcysC, eGFR calculated using serum cystatin C by CKD-EPI equation; SNP, single nucleotide polymorphism.
Among the 31 validated loci, 11 lead SNPs were identified within 15 genomic risk regions. When loci within a single genomic risk region had ≥2, a conditional analysis was performed (see Methods section). As a result, 18 loci remained, and three loci (rs4665985, rs62141288, and rs35578578) remained significant after conditional analysis (Table 2).
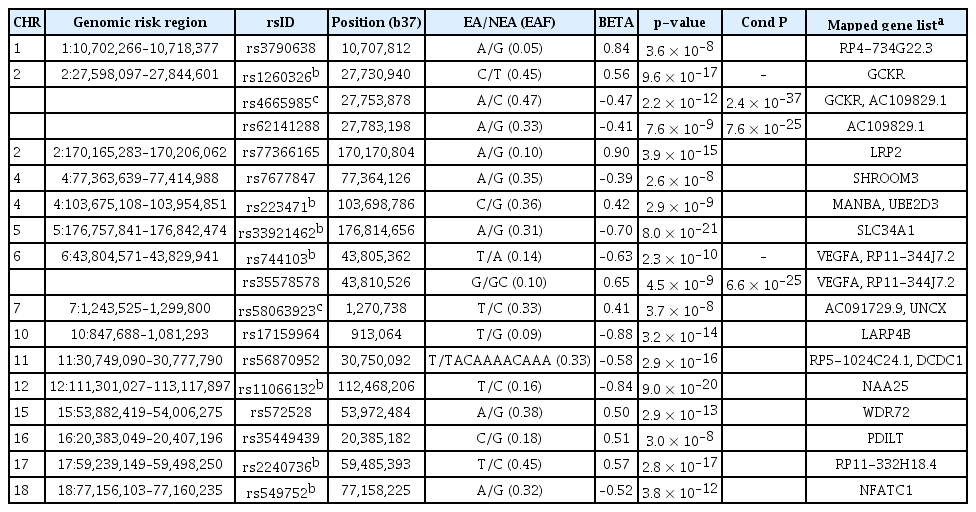
Validated SNPs within each genomic risk region and mapped gene list
The median eGFR showed significant differences according to the dosage of loci, i.e., the number of effect alleles (Supplementary Fig. 5, available online). In the HEXA cohorts, all variants in Table 2 showed significant differences between genotypes after Bonferroni correction. Only seven variants (rs1260326, rs33921462, rs744103, rs35578578, rs35449439, rs2240736, and rs549752) were validated as significant in the CAVAS cohort. None was validated in the KARE cohort, although this was likely due to the smaller sample size of the KARE cohort.
We also investigated whether the effect (beta) of variants discovered in our study was concordant with that of a previous large study [37]. Among the 399 loci validated by log-BUN or eGFRcysC, 333 variants were also observed. The degree and direction of the effect of loci seemed to be concordant with the previous report (Fig. 3). Of 18 variants shown in Table 2, 12 loci were noted.
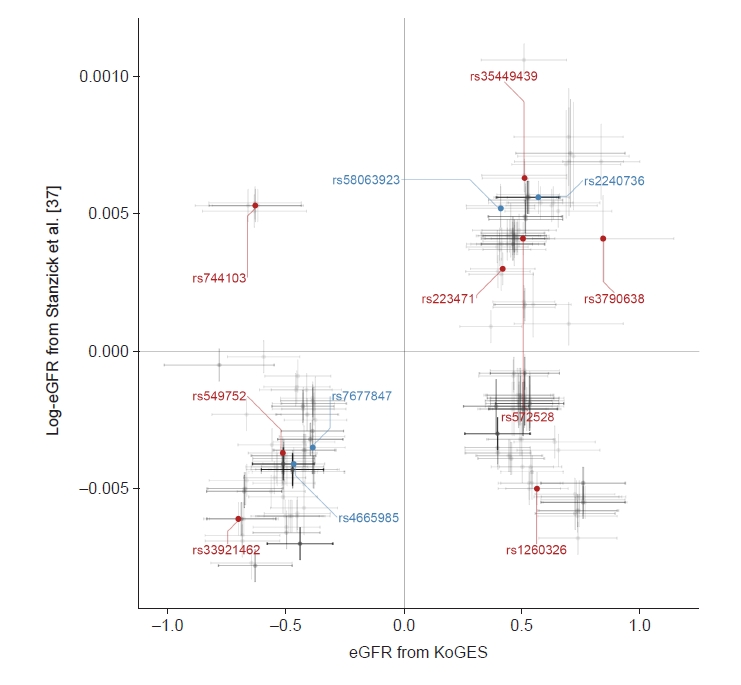
Scatter plot for concordance between studies.
Of 399 loci validated by log-BUN or eGFRcysC, 333 variants were also identified in results from a meta-GWAS by Stanzick et al. [37]. The x- and y-axis shows beta and 95% confidence interval from our study (KoGES) and a previous large meta-GWAS (by Stanzick et al.), respectively. Gray dots represent validated only loci. Blue dots indicate validated independent significant single nucleotide polymorphisms. Red dots represent validated genomic significant loci.
BUN, blood urine nitrogen; eGFR, estimated glomerular filtration rate calculated using serum creatinine by CKD-EPI equation; eGFRcysC, eGFR calculated using serum cystatin C by CKD-EPI equation; GWAS, genome-wide association study; KoGES, the Korean Genome and Epidemiology Study.
Gene-set and tissue enrichment study
MAGMA gene analysis was also performed using FUMA, resulting in 65 genes that remained statistically significant after Bonferroni correction (Pbon < 0.05). Among these genes, 33 were located within the genomic risk region (Fig. 4A). Gene-property analysis based on GTEx v8 revealed that the kidney cortex was the most enriched tissue (Fig. 4B), out of the 49 GTEx tissues (nominal p = 0.002).
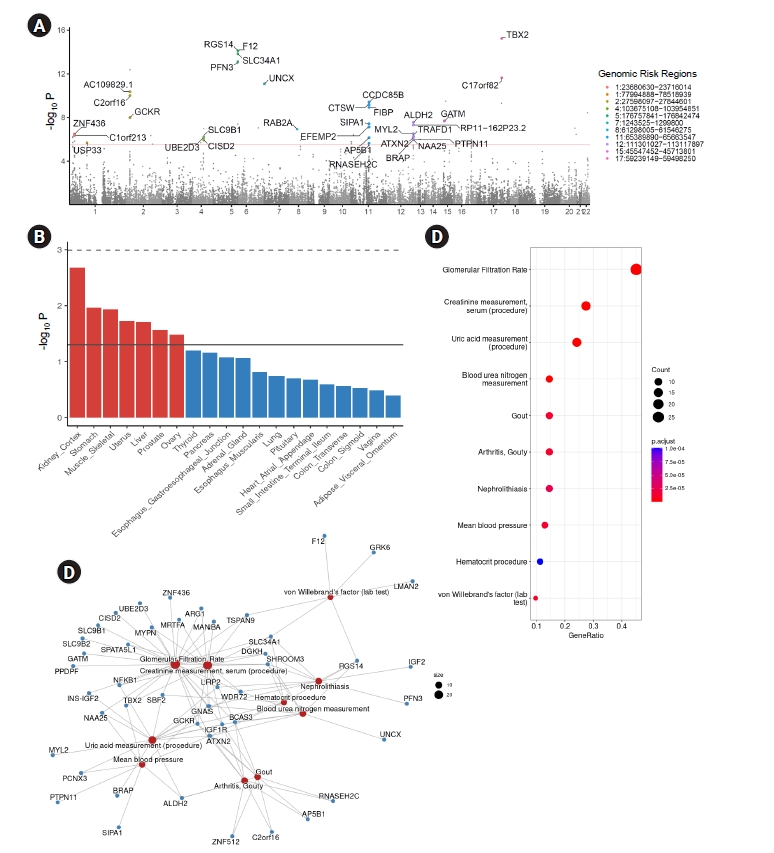
MAGMA gene analysis and pathway analysis based on significant genes.
MAGMA gene analysis identified significant genes based on GWAS summary statistics. (A) Manhattan plots showing 33 genes located within the genomic risk region that were significant after Bonferroni correction (pbon < 0.05). (B) To investigate enrichment in tissues, gene-property analysis was performed. The top 20 enrichment tissues (out of 54 GTEx tissues, with 49 tissues having sample sizes above 70) are depicted to be ordered according to their significance. The dashed line indicates pbon < 0.05 and the solid line indicates nominal p < 0.05. (C, D) Overrepresentation analysis based on disease gene network (DieGeNet).
GTEx, Genotype-Tissue Expression; GWAS, genome-wide association study.
To further investigate the significance of these genes, overrepresentation analysis was performed using the disease gene network (DieGeNet) [38] for genes that remained significant after Bonferroni correction from the MAGMA gene analysis (Fig. 4C, D). Overrepresented genes were enriched in kidney-associated terms, such as glomerular filtration rate, creatinine measurement, uric acid measurement, and BUN measurements (Fig. 4C). A network plot of enriched terms revealed several genes shown in Table 2 as well as known genes associated with renal traits, such as TBX2.
To investigate tissue enrichment, heritability enrichment using LDSC-SEG was performed (see Methods section). The liver was the most significantly expressed tissue in GTEx (false discovery rate [FDR], <0.05) (Fig. 5A), while the kidney cortex showed nominal significance (nominal p = 0.037, FDR, 0.098). Tissue enrichment in kidneys was significant when using the Franke lab dataset (Fig. 5B).
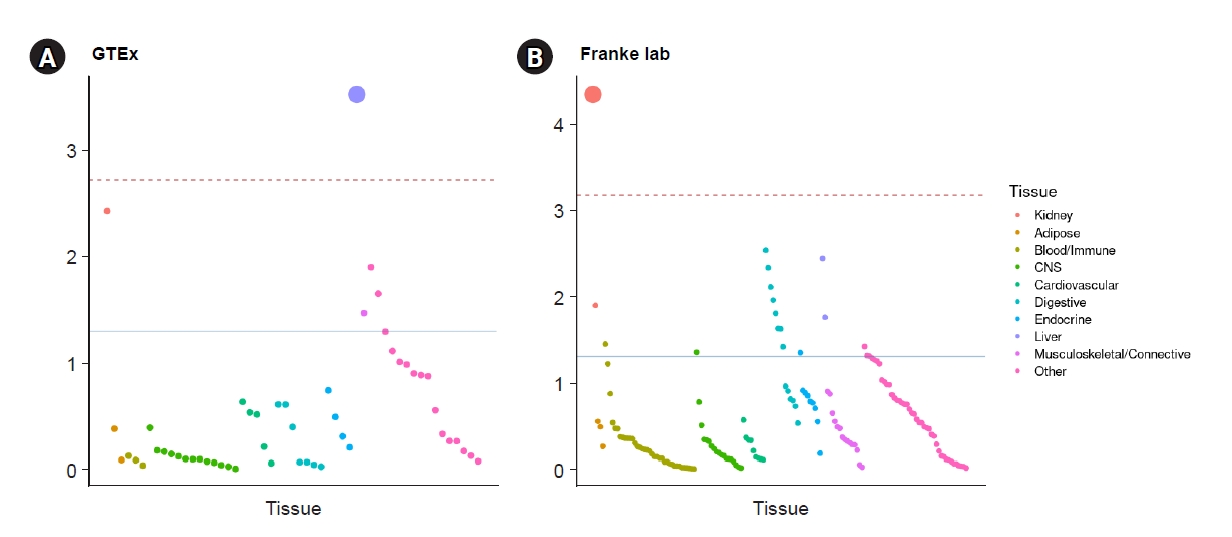
Heritability enrichment in tissues from GTEx and Franke using LDSC-SEG.
Tissue-specific enrichment was performed using gene expression dataset from GTEx (A) and from Franke lab (B). The red dashed line indicates significance after Bonferroni correction (pbon < 0.05). The blue line represents nominal significance (p < 0.05).
LDSC-SEG, linkage disequilibrium score regression applied to specifically expressed genes; GTEx, Genotype-Tissue Expression.
Discussion
In this study, we conducted a GWAS for the trait of eGFR using a Korea Biobank Array on the Korean population. There were some previous GWAS studies for Koreans. However, one study has only involved the KARE cohort of KoGES [13]. Another study has reported GWAS results only for selected patients [14]. In addition, previous Korean GWAS studies did not perform fine-mapping analysis. We attempted to define functional annotation and fine-mapping and validate discovered loci in this study by comparing them with those found in other previous studies. We identified 18 SNPs (nine novel ones and nine previously reported ones) across 15 genomic risk regions spanning 20 genes (Table 2). Furthermore, our GWAS results demonstrated statistically significant enrichment in kidney-related diseases, as confirmed in the DieGeNet database. We also observed enrichment in kidney and liver tissues, in agreement with a previous study [37].
Among genes found in this study, some were concordant with previous reports and their functional roles were also demonstrated. For example, LRP2, also known as megalin, has been reported to be a target molecule associated with anti-brush border antibodies and renal failure (ABBA disease) [39]. SHROOM3 is well known as a GFR-associated gene [2,37]. It is associated with the development of kidneys in an animal model [40]. A recent study has shown the role of lysosomal beta-mannosidase (MANBA) expression in kidney disease. Manba and Ubed2d were expressed in kidney tubule cells and fibroblasts, respectively [41]. The association of SLC34A1 with kidney disease has already been reported [3]. Given that mutations in SLC34A1 are associated with nephrolithiasis, the association between genotype and phenotype might be due to renal stone-related damage to the kidney [42]. PDILT is known to be located near UMOD and to regulate uromodulin expression [6]. NFATC1 is associated with tumor necrosis factor-associated podocyte injury by NFATC1/ABCA1-dependent mechanism [43]. The role of WDR72 remains unclear, although it has been reported in previous a meta-GWAS study [4]. Recent work showed WDR72 might have a role associated with uromodulin along with the UMOD-PDILT locus [44].
We searched whether 18 SNPs discovered in this study were available in the GWAS catalog [45]. Only nine SNPs (rs1260326, rs4665985, rs223471, rs33921462, rs744103, rs58063923, rs11066132, rs2240736, and rs549752) could be found in the GWAS catalog (searched in February 2023). This was quite different from what was expected, while previous GWAS discovered many loci associated with kidney traits. This might be attributed to the fact that previous studies were almost based on European ancestry. Indeed, the population structure in the KoGES cohort was quite different from those of other populations (Supplementary Fig. 1, available online). Hence, we examined the possibility of novel SNPs being in LD with previously reported SNPs, excluding rs62141288 and rs35578578, which were determined to be conditional on rs1260326 and rs744103, respectively (both rs1260326 and rs744103 were previously identified as kidney-associated SNPs). Of the remaining SNPs (n = 7), all were found to be in nearly complete LD with SNPs that were previously known to be associated with kidneys (Supplementary Fig. 6, available online). In addition, we conducted an investigation on the associations between nine SNPs that were not previously identified in the GWAS catalog and kidney-related traits using the BioBank Japan database [46]. Among them, six SNPs (rs3790638, rs62141288, rs77366165, rs7677847, rs572528, and rs35449439) exhibited a significant association (p < 5 × 10⁻⁸) with kidney-related traits (Supplementary Table 2, available online). Given the similarity in ethnicity between Koreans and Japanese, the novel SNPs discovered in this study may be extrapolated as specific to the northeastern Asian population.
Our study has a limitation. It only involved Koreans. Thus, significant loci were different from previous studies and the GWAS catalog. Ethnic differences in population structure and genetic architecture might have influenced our results as described above. Most loci discovered by GWAS were known to be non-coding variants that might exert regulatory functions [47]. Gene expression varies according to their ancestry [48]. Given that regulatory variants might be different between ancestries, lead SNPs associated with the trait (i.e., eGFR) were different from other studies based on most of the European population. However, enrichment analysis showed that tissue-specific expression was not significantly different from the previous report. Target genes were expressed in a kidney-specific manner (Fig. 4, 5), although the concrete pattern of expression might differ slightly from results from European ancestry. Therefore, Korean eQTL data for other diseases should be curated in the future. In addition, the sample size in our study was not sufficient to draw robust conclusions. Particularly, the SNPs we discovered did not demonstrate significance in the KARE or CAVAS cohorts, which increases the risk of false positives. The number of participants needs to be increased in future studies.
In conclusion, we discovered several SNPs associated with kidney traits in the Korean population based on KoGES, the largest cohort in Korea. We also discovered that variants were validated in other enrichment analyses. Although a detailed causality and associated mechanisms should be elucidated in the future, we found not only concordant results with previous GWAS but also novel loci that might be specific to the Korean population.
Supplementary Materials
Supplementary data are available at Kidney Research and Clinical Practice online (https://doi.org/10.23876/j.krcp.23.079).
Notes
Conflicts of interest
All authors have no conflicts of interest to declare.
Funding
This work was supported by the Basic Science Research Program (NRF-2022R1F1A1071128 to Samel Park and 2021R1C1C1007810 to Jong-Seok Moon) from the National Research Foundation of Korea.
Data sharing statement
The data presented in this study was obtained from the Korean Genome-wide Epidemiology Study (KoGES). It could be requested on the website (https://biobank.nih.go.kr/).
Authors’ contributions
Conceptualization, Formal analysis, Visualization: SP
Data curation: DSK, NJC
Funding acquisition, Project administration: JSM, SP
Investigation: DJL, SP
Methodology: DKS, YSL
Resources: DJL, NJC
Software: DJL, DSK
Supervision: JSM, YSL, HWG, EYL
Writing–original draft: DJL, SP
Writing–review & editing: DJL, SP
All authors read and approved the final manuscript.
Acknowledgements
This study was conducted with bioresources from the National Biobank of Korea, the Korea Disease Control and Prevention Agency, Republic of Korea (NBK-21120702-01-01).