Kidney Res Clin Pract > Volume 33(1); 2014 > Article
Lee, Rhee, Seong, Lee, Lee, and Kwak: Comparison of glomerular filtration rates calculated by different serum cystatin C-based equations in patients with chronic kidney disease

Abstract

Background

We aimed to evaluate the performance of serum cystatin C-based equations in calculating the glomerular filtration rate (GFR) in patients with varying stages of chronic kidney disease (CKD).

Methods

Serum cystatin C and creatinine levels were measured in 615 CKD patients. The CKD stage was determined by the creatinine-based estimated GFR (eGFR) equation using the four-variable abbreviated Modification of Diet in Renal Disease equation suggested by the Kidney Disease Outcome Quality Initiative with the addition of a coefficient applicable to Korean populations (K-aMDRD). In each CKD stage, the ratio of serum cystatin C to creatinine was calculated and six different cystatin C-based equations were used to estimate GFR. Cystatin C-based eGFR and aMDRD eGFR values were compared using the paired t test, Pearson correlation test, and the Bland–Altman plot.

Results

The mean age of patients was 53.21±14.45 years; of the 615 patients, 346 were male. The serum cystatin C-to-creatinine ratio was inversely correlated with the CKD stage. Compared with the K-aMDRD values, the results of the Hoek, Filler, and Le Bricon’s cystatin C-based eGFR equations were lower in CKD Stages 1–3 and higher in Stages 4 and 5. However, the results of the Orebro-cystatin (Gentian) equation [GFR=100/ScytC (mL/minute/1.73 m2) – 14] were similar to those of the K-aMDRD equation in CKD Stages 4 and 5 (15.44±9.45 vs. 15.17±9.05 mL/minute/1.73 m2, respectively; P=0.722; bias=0.27±8.87).

Conclusion

The eGFRs obtained from the six cystatin C-based equations differed widely. Therefore, further studies are required to determine the most accurate equation to estimate GFR in Koreans with CKD.

Keywords

Chronic kidney disease, Cystatin C, Estimated glomerular filtration rate, Serum creatinine

Introduction

Estimation of the glomerular filtration rate (GFR) is the most important step in the diagnosis of chronic kidney disease (CKD), and significant research has been directed toward developing the most accurate, convenient, and reproducible equation. Traditionally, the Modification of Diet in Renal Disease (MDRD) [1], Cockcroft–Gault [2], and Chronic Kidney Disease Epidemiology Collaboration (CKD-EPI) [3] equations have been considered the most acceptable creatinine-based equations for estimating GFR. The Kidney Disease Outcome Quality Initiative (K/DOQI) recommends using an abbreviated form of the MDRD equation (aMDRD) for clinical purposes [4]. A recent publication by Lee et al [5] adapted the aMDRD equation for a Korean population by adding a coefficient (K-aMDRD), which improved the estimated GFR (eGFR) performance and more closely approximated inulin clearance. However, there are a number of disadvantages in using serum creatinine itself as a filtration marker [6], [7]. Therefore, identifying a new endogenous filtration marker is necessary for the accurate and convenient estimation of GFR.
Serum cystatin C is a cationic nonglycosylated low-molecular-weight cysteine proteinase inhibitor produced at a constant rate by all nucleated cells and freely filtered at the glomerulus [8]. Approximately 99% of filtered cystatin C is reabsorbed in the proximal tubule, where it undergoes near-complete catabolization [9], [10]. Because of these features, serum cystatin C was proposed as a superior marker of GFR, and its superiority over serum creatinine in the early detection of acute kidney injury is already well established [11], [12]. However, its role as a filtration marker is still conflicting [13], [14], [15], and there is no validated cystatin C-based eGFR equation in predicting the glomerular rate in CKD patients [16], [17], [18], [19], [20].
Thus, in this study, we aimed to determine the performance of cystatin C in estimating GFR and the accuracy of six different cystatin C-based eGFR equations and compared the results with that of the K-aMDRD equation according to the CKD stage.

Methods

Patients

Serum creatinine and cystatin C levels were measured in 615 CKD patients who visited the Pusan National University Hospital between January 2011 and December 2011. The recruited patients were aged ≥18 years. Patients with thyroid dysfunction, inflammation, severe liver disease, or a history of steroid therapy were excluded [21], [22], [23]. Patients with extremely high eGFR calculated using the MDRD equation (eGFR>130 mL/minute/1.73 m2) [5] and patients with end-stage renal disease on maintenance dialysis were also excluded. The local Ethics Committee approved this study to analyze anonymous, routinely collected clinical data and waived the requirement of informed consent.

Laboratory methods

Serum creatinine and serum cystatin C levels were measured in the same serum sample. Serum creatinine values were measured by the alkaline picrate Jaffe kinetic method, and cystatin C values were determined by turbidimetry-based immunoassays using reagents from Healthcare Innovation (HBI Co, Anyang, Korea). The ratio of serum cystatin C to creatinine (mg/L to mg/dL) was calculated without adjustment of the unit for ease of application.

GFR measurement and estimation

Measured GFR

The measured GFR (mGFR) was obtained by Tc-99m-diethylenetriamine pentaacetate (Tc-99m-DTPA) renal scintigraphy. After a bolus injection of 10-mCi Tc-99m-DTPA, GFR was obtained using the Gates method [24] during a renal scan with VERTEX (EPIC) gamma camera equipped with ADAC's DUAL DETECTOR (ADAC, Milpitas, CA, USA).

eGFR by serum creatinine

Serum creatinine-based eGFR was calculated by the CKD-EPI [3] and K-aMDRD equations [GFR=107.904 × Scr−1.009 × age−0.02 (×0.667 if woman)] [5]. The CKD stage was classified according to the recommendation of the Kidney Disease Improving Global Outcomes and National Kidney Foundation-K/DOQI guideline using the K-aMDRD equation [25].

eGFR by serum cystatin C

Serum cystatin C-based eGFR was calculated using six different equations published previously.
  • Larsson A et al [16]: GFR=99.43 × ScytC−1.5837 (mL/minute/1.73 m2)

  • Hoek FJ et al [17]: GFR=80.35/ScytC−4.32 (mL/minute/1.73 m2)

  • Le Bricon T et al [18]: GFR=78/ScytC+4 (mL/minute/1.73 m2)

  • Filler G and Lepage N [19]: GFR=91.62 × ScytC−1.123 (mL/minute/1.73 m2)

  • Orebro-cystatin (DAKO) [19]: GFR=119/ScytC – 33 (mL/minute/1.73 m2)

  • Orebro-cystatin (Gentian) [19]: GFR=100/ScytC – 14 (mL/minute/1.73 m2)

Statistical analysis

Data were analyzed using SPSS for Windows, version 17.0 (SPSS Inc., Chicago, IL, USA). The Student t test was used for analysis of continuous variables and results are presented as mean±standard deviation (SD). The Chi-square test was used for analysis of categorical variables. Differences in eGFR in each of the CKD stage were compared using a paired t test. The mean difference (bias) between the paired observation is given with SD (precision) and P values. The Bland–Altman plot was used to test the agreement between eGFRs from the K-aMDRD formula and the cystatin C-based equations, as well as between the K-aMDRD and mGFR [26]. Values of P<0.05 were considered statistically significant.

Results

Baseline characteristics

A total of 615 patients were enrolled in this study. The mean age of the recruited patients was 53.21±14.45 years with 56.3% of patients being male. Patients with diabetes mellitus comprised 23.9% of the study population and hypertensive patients comprised 35.1%. The mean serum creatinine level was 2.52±3.14 mg/dL and the mean serum cystatin C level was 1.79±1.18 mg/L. The mean and upper 99th percentile serum cystatin C, respectively, according to the stages of CKD were as follows: CKD 1, 0.87±0.20 mg/L and 1.45 mg/L; CKD 2, 1.20±0.43 mg/L and 2.20 mg/L; CKD 3, 1.94±0.49 mg/L and 3.08 mg/L; CKD 4, 3.13±0.61 mg/L and 4.29 mg/L; CKD 5 4.25±0.74 mg/L and 6.08 mg/L. Other baseline characteristics according to the CKD stage are summarized in Table 1.

Validation of the aMDRD equation with Korean coefficient

Of the 615 patients, 21 patients (CKD 4=16, CKD 5=5) underwent a nuclear medicine renal scan using DTPA. The mean mGFR was 19.18±8.72 mL/minute/1.73 m2 in CKD 4 and 13.19±6.74 mL/minute/1.73 m2 in CKD 5. The correlation coefficient between mGFR and eGFR was 0.5 (P=0.03). The Bland–Altman plot analysis of the degree of correspondence between the eGFR calculated by the K-aMDRD formula and the mGFR using DTPA scan revealed that the majority of results fell within the 95% confidence interval (Table 2, Fig. 1).

Cystatin C-to-creatinine ratio according to the CKD stage

Fig. 2A shows the cystatin C-to-creatinine ratios; the mean ratio was 0.95±0.33 (mg/L to mg/dL). In CKD Stages 1–3, the serum cystatin C level nearly coincided with the serum creatinine level. However, in CKD Stages 4 and 5, the serum cystatin C level did not increase as expected, and the cystatin C-to-creatinine ratio decreased to 0.75±0.16 (mg/L to mg/dL) in CKD Stage 4, and to 0.49±0.16 (mg/L to mg/dL) in CKD Stage 5 (Fig. 2B).

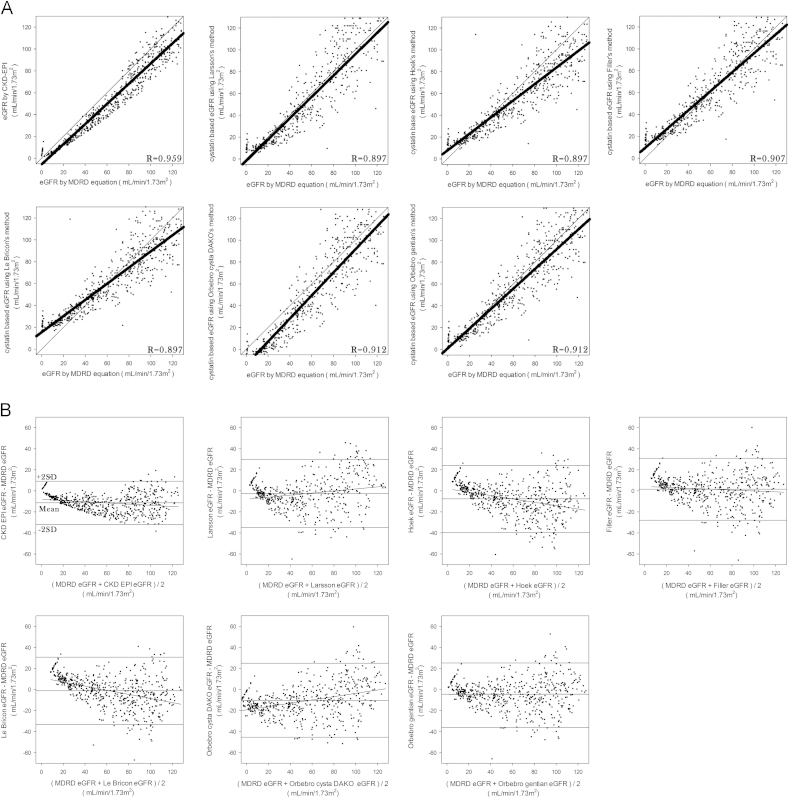
Comparison of cystatin C-based eGFRs

Compared with the results of the K-aMDRD equation, the cystatin C-based equations estimated a lower GFR in CKD Stages 1–3, but presented differing results in Stages 4 and 5. Compared with the results of CKD-EPI, cystatin C-based eGFRs were higher in all the CKD stages (Table 3).
The eGFRs using serum cystatin C with the six different equations were slightly different when the GFR got lower. In particular, when compared with the K-aMDRD equation, the Hoek, Filler, and Le Bricon’s equations yielded higher eGFRs, whereas the Orebro-cystatin (DAKO) equation yielded lower eGFRs (Fig. 3).
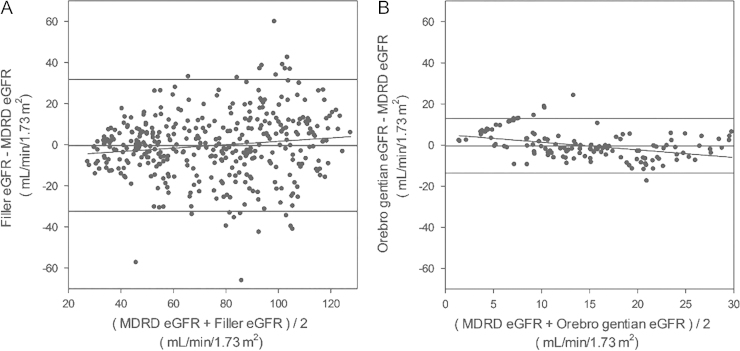
We measured the concordance between the GFRs estimated by each cystatin C-based equation and the K-aMDRD equation. Filler’s equation yielded the most similar eGFRs in CKD Stages 1–3 (74.77±28.26 mL/minute/1.73 m2 vs. 75.17±28.26 mL/minute/1.73 m2; P=0.622, bias=0.39±16.09), whereas the Orebro-cystatin (Gentian) equation yielded the most similar eGFRs in Stages 4 and 5 (15.44±9.45 mL/minute/1.73 m2 vs. 15.17±9.05 mL/minute/1.73 m2; P=0.722, bias=0.27±8.87; Table 3). Accordingly, the Bland–Altman plot showed the highest concordance with Filler’s equation in Stages 1–3, and the Orebro-cystatin (Gentian) equation in Stages 4 and 5 (Fig. 4).

Discussion

We evaluated the performance of serum cystatin C and the cystatin C-based eGFR equations and compared the results with that of the K-aMDRD equation according to the CKD stage. Inulin clearance and other methods using injected radioactive substances such as 52Cr-ethylenediaminetetraacetic acid, Tc-99m-DTPA are considered the true reference standards for determining GFR. Unfortunately, these tests are expensive and laborious, and therefore are not suited to clinical practice. In our cross-sectional retrospective study, we did not measure inulin clearance and performed DTPA renal scans in only 21 patients. Therefore, we were unable to compare the cystatin C-based estimates of GFRs with the true reference GFR. However, the recently proposed K-aMDRD equation is based on inulin clearance [5], and the MDRD equation has been previously validated in patients with CKD [27], [28]. In addition, although the number of patients was limited in our study, the Bland–Altman plot showed agreement between the K-aMDRD eGFR and the GFR measured by DTPA renal scans in 21 patients with CKD Stages 4 and 5. These findings suggest the validity of having used the K-aMDRD equation as a reference rather than as the true reference GFR.
We found that the cystatin C-based eGFR equations yielded values that differed greatly depending on the CKD stage. Overall, in Stages 1–3, the eGFRs were lower than those calculated by the K-aMDRD equation, whereas the results differed by equation in Stages 4 and 5.
As previously reported, serum cystatin C concentration may underestimate renal dysfunction in advanced CKD because cystatin C did not increase along with the CKD stage, and the cystatin C-to-creatinine ratio decreased with advancing CKD stage [29]. It has been hypothesized that the discrepancy between serum creatinine and cystatin C may be due to extrarenal clearance of cystatin C [20]. In our study, the cystatin C-to-creatinine ratio was comparable with previously published values (Fig. 2), and the estimated rates from Hoek, Filler, and Le Bricon’s equations were greater than those from the K-aMDRD equation in CKD Stages 4 and 5 (Table 4), as the previously cited group suggested [20]. By contrast, we found that the Orebro-cystatin (Gentian) equation generated eGFR values comparable with those of the K-aMDRD equation in all CKD stages.
In the Orebro-cystatin (Gentian) equation, unlike the other cystatin C-based eGFR equations, both the production rate and extrarenal clearance of cystatin C are taken into account [30]. This could prevent an overestimation of eGFR in patients with CKD Stage 4 or 5.
The Orebro-cystatin (DAKO) equation also considered the extrarenal elimination of cystatin C, and this equation used the same template as the Orebro-cystatin (Gentian) equation [19]. However, the results from this equation were not comparable with the eGFR calculated using the K-aMDRD equation, because the reagents used in the determination of serum cystatin C levels were different. Tidman et al [30] reported that serum cystatin C determined by the Gentian method was approximately 40% higher than the DAKO method in the low GFR range. This may explain the differing results of the DAKO and Gentian equations. In our study, cystatin C was measured by turbidimetric methods using HBI reagents produced in Korea, which differ from the Gentian methods. Nonetheless, the Gentian equation generated eGFRs comparable with those generated by the K-aMDRD equation in patients with CKD Stages 4 and 5. Based on previously published literature, creatinine-based MDRD equations are known to underestimate the GFR in patients with a GFR>60 mL/minute/1.73 m2 [31]. By contrast, we found the eGFR from the K-aMDRD equation to be higher than those from the cystatin C-based equations. This may be due to improved accuracy of the modified equation [5], or possibly due to the superior performance of cystatin C as an early marker of GFR decline [32], [33].
The eGFRs produced by the six cystatin C-based equations differed widely. We found that Filler’s equation yielded results most similar to those of the K-aMDRD equation in CKD Stages 1–3, whereas the Orebro-cystatin (Gentian) equation performed similarly in CKD Stages 4 and 5. However, given the lack of a true reference GFR in our study, we are unable to conclude that these equations are the most accurate.
In summary, the eGFRs calculated by the six cystatin C-based equations differed from each other and from those calculated by the K-aMDRD equation. Therefore, further study is needed to determine the most suitable equation to estimate GFR in Koreans with CKD.

Conflicts of interest

No conflict of interest has been declared.

Acknowledgments

This work was supported by a 2-Year Research Grant of Pusan National University.

References

1. Levey A.S., Coresh J., Greene T., Stevens L.A., Zhang Y.L., Hendriksen S., Kusek J.W., Van Lente F.. Chronic Kidney Disease Epidemiology Collaboration: Using standardized serum creatinine values in the modification of diet in renal disease study equation for estimating glomerular filtration rate. Ann Intern Med 145:2006;247–254.
crossref pmid
2. Cockcroft D.W., Gault M.H.. Prediction of creatinine clearance from serum creatinine. Nephron 16:1976;31–41.
crossref pmid
3. Levey A.S., Stevens L.A., Schmid C.H., Zhang Y.L., Castro A.F. 3rd, Feldman H.I., Kusek J.W., Eggers P., Van Lente F., Greene T., Coresh J.. CKD-EPI (Chronic Kidney Disease Epidemiology Collaboration): A new equation to estimate glomerular filtration rate. Ann Intern Med 150:2009;604–612.
crossref pmid pmc
4. Imai E., Horio M., Nitta K., Yamagata K., Iseki K., Hara S., Ura N., Kiyohara Y., Hirakata H., Watanabe T., Moriyama T., Ando Y., Inaguma D., Narita I., Iso H., Wakai K., Yasuda Y., Tsukamoto Y., Ito S., Makino H., Hishida A., Matsuo S.. Estimation of glomerular filtration rate by the MDRD study equation modified for Japanese patients with chronic kidney disease. Clin Exp Nephrol 11:2007;41–50.
crossref pmid
5. Lee C.S., Cha R.H., Lim Y.H., Kim H., Song K.H., Gu N., Yu K.S., Lim C.S., Han J.S., Kim S., Kim Y.S.. Ethnic coefficients for glomerular filtration rate estimation by the Modification of Diet in Renal Disease study equations in the Korean population. J Korean Med Sci 25:2010;1616–1625.
crossref pmid pmc
6. Sjöström P.A., Odlind B.G., Wolgast M.. Extensive tubular secretion and reabsorption of creatinine in humans. Scand J Urol Nephrol 22:1988;129–131.
crossref pmid
7. Shemesh O., Golbetz H., Kriss J.P., Myers B.D.. Limitations of creatinine as a filtration marker in glomerulopathic patients. Kidney Int 28:1985;830–838.
crossref pmid
8. Abrahamson M., Olafsson I., Palsdottir A., Ulvsbäck M., Lundwall A., Jensson O., Grubb A.. Structure and expression of the human cystatin C gene. Biochem J 268:1990;287–294.
crossref pmid pmc
9. Grubb A., Simonsen O., Sturfelt G., Truedsson L., Thysell H.. Serum concentration of cystatin C, factor D and beta 2-microglobulin as a measure of glomerular filtration rate. Acta Med Scand 218:1985;499–503.
crossref pmid
10. Simonsen O., Grubb A., Thysell H.. The blood serum concentration of cystatin C (gamma-trace) as a measure of the glomerular filtration rate. Scand J Clin Lab Invest 45:1985;97–101.
crossref pmid
11. Zhang Z., Lu B., Sheng X., Jin N.. Cystatin C in prediction of acute kidney injury: a systemic review and meta-analysis. Am J Kidney Dis 58:2011;356–365.
crossref
12. Zappitelli M., Krawczeski C.D., Devarajan P., Wang Z., Sint K., Thiessen-Philbrook H., Li S., Bennett M.R., Ma Q., Shlipak M.G., Garg A.X., Parikh C.R.. TRIBE-AKI consortium: Early postoperative serum cystatin C predicts severe acute kidney injury following pediatric cardiac surgery. Kidney Int 80:2011;655–662.
crossref
13. Zahran A., El-Husseini A., Shoker A.. Can cystatin C replace creatinine to estimate glomerular filtration rate? A literature review. Am J Nephrol 27:2007;197–205.
crossref pmid
14. Dharnidharka V.R., Kwon C., Stevens G.. Serum cystatin C is superior to serum creatinine as a marker of kidney function: a meta-analysis. Am J Kidney Dis 40:2002;221–226.
crossref pmid
15. Han K.H., Han S.Y., Kang Y.S., Cha D.R.. Serum cystatin C concentration compared with serum creatinine concentration as a marker of glomerular filtration rate. Korean J Nephrol 25:2006;737–744.
16. Larsson A., Malm J., Grubb A., Hansson L.O.. Calculation of glomerular filtration rate expressed in mL/min from plasma cystatin C values in mg/L. Scand J Clin Lab Invest 64:2004;25–30.
crossref pmid
17. Hoek F.J., Kemperman F.A., Krediet R.T.. A comparison between cystatin C, plasma creatinine and the Cockcroft and Gault formula for the estimation of glomerular filtration rate. Nephrol Dial Transplant 18:2003;2024–2031.
crossref pmid
18. Le Bricon T., Thervet E., Froissart M., Benlakehal M., Bousquet B., Legendre C., Erlich D.. Plasma cystatin C is superior to 24-h creatinine clearance and plasma creatinine for estimation of glomerular filtration rate 3 months after kidney transplantation. Clin Chem 46:2000;1206–1207.
crossref pmid
19. Filler G., Lepage N.. Should the Schwartz formula for estimation of GFR be replaced by cystatin C formula? Pediatr Nephrol 18:2003;981–985.
crossref pmid
20. Sjöström P., Tidman M., Jones I.. Determination of the production rate and non-renal clearance of cystatin C and estimation of the glomerular filtration rate from the serum concentration of cystatin C in humans. Scand J Clin Lab Invest 65:2005;111–124.
crossref pmid
21. Fricker M., Wiesli P., Brändle M., Schwegler B., Schmid C.. Impact of thyroid dysfunction on serum cystatin C. Kidney Int 63:2003;1944–1947.
crossref pmid
22. Knight E.L., Verhave J.C., Spiegelman D., Hillege H.L., de Zeeuw D., Curhan G.C., de Jong P.E.. Factors influencing serum cystatin C levels other than renal function and the impact on renal function measurement. Kidney Int 65:2004;1416–1421.
crossref pmid
23. Stevens L.A., Schmid C.H., Greene T., Li L., Beck G.J., Joffe M.M., Froissart M., Kusek J.W., Zhang Y.L., Coresh J., Levey A.S.. Factors other than glomerular filtration rate affect serum cystatin C levels. Kidney Int 75:2009;652–660.
crossref pmid
24. Gates G.F.. Computation of glomerular filtration rate with Tc-99m DTPA: an in-house computer program. J Nucl Med 25:1984;613–618.
pmid
25. http://www.kidney.org/professionals/KDOQI/guidelines_ckd.
26. Bland J.M., Altman D.G.. Statistical methods for assessing agreement between two methods of clinical measurement. Lancet 8:1986;307–310.
crossref
27. Rule A.D., Larson T.S., Bergstralh E.J., Slezak J.M., Jacobsen S.J., Cosio F.G.. Using serum creatinine to estimate glomerular filtration rate: accuracy in good health and in chronic kidney disease. Ann Intern Med 141:2004;929–937.
crossref pmid
28. Hallan S., Asberg A., Lindberg M., Johnsen H.. Validation of the Modification of Diet in Renal Disease formula for estimating GFR with special emphasis on calibration of the serum creatinine assay. Am J Kidney Dis 44:2004;84–93.
crossref pmid
29. Uemura O., Ushijima K., Nagai T., Yamada T., Yamakawa S., Hibi Y., Hayakawa H., Nabeta Y., Shinkai Y., Koike K., Kuwabara M.. Measurements of serum cystatin C concentrations underestimate renal dysfunction in pediatric patients with chronic kidney disease. Clin Exp Nephrol 15:2011;535–538.
crossref pmid
30. Tidman M., Sjöström P., Jones I.. A comparison of GFR estimating formulae based upon s-cystatin C and s-creatinine and a combination of the two. Nephrol Dial Transplant 23:2008;154–160.
crossref pmid
31. Comprehensive Clinical Nephrology.
32. Randers E., Erlandsen E.J., Pedersen O.L., Hasling C., Danielsen H.. Serum cystatin C as an endogenous parameter of the renal function in patients with normal to moderately impaired kidney function. Clin Nephrol 54:2000;203–209.
pmid
33. Coll E., Botey A., Alvarez L., Poch E., Quintó L., Saurina A., Vera M., Piera C., Darnell A.. Serum cystatin C as a new marker for noninvasive estimation of glomerular filtration rate and as a marker for early renal impairment. Am J Kidney Dis 36:2000;29–34.
crossref pmid
Figure 1
The Bland–Altman plot for differences between GFR measured by DTPA renal scan and the abbreviated MDRD equation with the Korean coefficient. The mean difference is indicated by the center line. Limits of agreement are indicated by the upper (mean+2SD) and lower (mean – 2SD) lines. DTPA, diethylenetriamine pentaacetate; GFR, glomerular filtration rate; MDRD, Modification of Diet in Renal Disease; SD, standard deviation.
KRCP-033-01-45-g1.jpg
Figure 2
Cystatin C-to-creatinine ratio according to the CKD stage. (A) Relationship between serum creatinine and serum cystatin C. (B) The cystatin C-to-creatinine ratio according to the CKD stage. The ratio decreases with advancing stages. CKD, chronic kidney disease.
KRCP-033-01-45-g2.jpg
Figure 3
Comparison of cystatin C-based equations and the abbreviated MDRD equation with the Korean coefficient. (A) Correlations of eGFR between cystatin C-based equations and the abbreviated MDRD equation with the Korean coefficient. The thin line indicates an identical line; the bold line shows the fit of the data. (B) The Bland - Altman plots between each cystatin C-based eGFR and the abbreviated MDRD equation. Difference is plotted as the percentage of differences with the average; the regression line of the difference is also presented. The mean difference is indicated by the center line; limits of agreement are indicated by the upper (mean+2SD) and lower (mean – 2SD) lines. The Filler equation showed the least mean difference from baseline, while the Orebro Gentian equation regression analysis revealed no trend toward overestimation as GFR decreased. CKD-EPI, chronic kidney disease epidemiology collaboration; eGFR, estimated glomerular filtration rate; MDRD, Modification of Diet in Renal Disease; SD, standard deviation.
KRCP-033-01-45-g3.jpg
Figure 4
Magnification of the Bland–Altman plot that shows best concordance with the abbreviated MDRD equation: the Filler equation in early-stage CKD and the Orebro Gentian equation in advanced CKD. CKD, chronic kidney disease; MDRD, Modification of Diet in Renal Disease.
KRCP-033-01-45-g4.jpg
Table 1
Baseline patient characteristics
Characteristic Total (N=615) CKD 1 (N=204) CKD 2 (N=140) CKD 3 (N=137) CKD 4 (N=71) CKD 5 (N=63)
Age (y) 53.21±14.45 48.24±14.78 56.32±12.71 56.24±13.33 58.24±13.14 49.76±15.58
Male 346 (56.3) 119 (58.3) 74 (52.9) 74 (54.0) 45 (63.4) 29 (46.0)
DM 147 (23.9) 26 (12.7) 29 (20.7) 50 (36.5) 23 (32.4) 19 (30.1)
HT 215 (35.1) 31 (15.2) 43 (30.7) 63 (46.0) 38 (56.5) 40 (63.5)
SBP (mmHg) 124.98±15.81 122.31±12.19 122.40±13.76 128.51±18.63 129.72±19.11 134.92±23.81
DBP (mmHg) 78.93±11.40 77.68±9.86 78.06±10.48 80.66±13.21 80.07±12.15 84.69±16.15
MAP (mmHg) 92.72±16.80 91.19±14.77 90.85±17.10 95.19±18.03 94.87±18.53 101.43±18.21
Hb (g/dL) 12.43±2.39 13.94±1.65 13.36±1.85 12.04±1.96 10.47±1.44 9.10±1.52
Alb (g/dL) 4.19±0.59 4.40±0.54 4.40±0.42 4.09±0.55 3.96±0.56 3.54±0.61
sCr (mg/dL) 2.52±3.14 0.82±0.19 1.19±0.29 2.06±0.57 4.37±1.30 9.82±4.77
sCystC (mg/L) 1.79±1.18 0.87±0.20 1.20±0.43 1.94±0.49 3.13±0.61 4.25±0.74
CystC/Cr 0.95±0.33 1.09±0.29 1.02±0.39 0.97±0.21 0.75±0.16 0.49±0.16

Data are presented as N (%) or mean±standard deviation.

Alb, albumin; CKD, chronic kidney disease; CystC/Cr, cystatin C-to-creatinine ratio; DBP, diastolic blood pressure; DM, diabetes mellitus; Hb, hemoglobin; HT, hypertension; MAP, mean arterial pressure; SBP, systolic blood pressure; sCr, serum creatinine; sCystC, serum cystatin C.

Table 2
Validation of the abbreviated MDRD equation with the Korean coefficient in CKD 4 and 5 (N=21)
Mean (SD) (mL/minute/1.73 m2) Bias Precision P R
mGFR 18.04 (8.57)
MDRD [5] 20.29 (6.28) −2.25 7.86 0.204 0.475

CKD, chronic kidney disease; MDRD, Modification of Diet in Renal Disease; mGFR, measured glomerular filatration rate; SD, standard deviation.

Table 3
Estimated glomerular filtration rate
Variable Total CKD 1 CKD 2 CKD 3 CKD 4 CKD 5
Creatinine-based eGFR (mL/minute/1.73 m2)
 MDRD [5] 63.81±36.05 106.90±10.75 76.97±8.69 45.18±8.10 22.29±4.67 7.11±5.28
 CKD-EPI [3] 54.54±35.79 92.46±23.56 62.94±14.31 33.05±8.39 13.68±4.14 5.83±2.23
Cystatin-based eGFR (mL/minute/1.73 m2)
 Larsson A et al [16] 54.16±36.96 100.51±20.44 76.19±24.66 38.80±14.30 17.04±4.83 10.69±3.12
 Hoek FJ et al [17] 57.86±31.45 89.89±17.59 69.63±19.06 39.34±10.24 23.13±11.84 15.16±3.49
 Le Bricon T et al [18] 64.24±30.42 95.26±16.89 73.85±18.51 46.39±9.94 30.64±11.49 22.91±3.39
 Filler G and Lepage N [19] 64.01±34.27 101.76±17.88 78.69±21.15 46.37±12.18 27.42±9.78 18.70±3.78
 Orebro-cystatin (DAKO) [19] 52.13±41.47 97.47±20.58 70.55±24.96 31.67±15.16 5.73±6.84 −4.14±5.18
 Orebro-cystatin (Gentian) [19] 59.69±36.35 98.47±18.55 78.85±21.86 40.35±12.74 18.55±5.75 10.25±4.35

Data are presented as mean±standard deviation.

CKD, chronic kidney disease; CKD-EPI, Chronic Kidney Disease Epidemiology Collaboration; eGFR, estimated glomerular filtration rate; MDRD, Modification of Diet in Renal Disease.

Table 4
Cystatin C-based eGFRs, bias, and precision compared with related to the abbreviated MDRD equation with the Korean coefficient according to CKD stage
Variable Mean (SD) (mL/minute/1.73 m2) Bias Precision P R
CKD Stages 1–3
 MDRD [5] 75.17 (28.26)
 Larsson A et al [16] 67.85 (32.14) 3.27 18.51 0.001 0.818
 Hoek FJ et al [17] 66.72 (26.11) 11.28 15.65 <0.001 0.827
 Le Bricon T et al [18] 72.82 (25.21) 5.11 15.44 <0.001 0.827
 Filler G and Lepage N [19] 74.77 (28.26) 0.39 16.09 0.622 0.828
 Orebro-cystatin (DAKO) [19] 65.58 (33.53) 9.58 18.78 <0.001 0.830
 Orebro-cystatin (Gentian) [19] 70.80 (29.61) 5.58 16.41 <0.001 0.835
CKD Stages 4 and 5
 MDRD [5] 15.12 (9.03)
 Larsson A et al [16] 14.04 (5.18) 0.99 6.87 0.097 0.652
 Hoek FJ et al [17] 19.38 (9.77) −4.27 9.91 <0.001 0.447
 Le Bricon T et al [18] 27.01 (9.48) −11.89 9.74 <0.001 0.447
 Filler G and Lepage N [19] 22.56 (5.85) −7.52 6.76 <0.001 0.662
 Orebro-cystatin (DAKO) [19] 1.05 (7.85) 13.97 7.00 <0.001 0.664
 Orebro-cystatin (Gentian) [19] 14.62 (6.59) 0.42 6.77 0.480 0.664

CKD, chronic kidney disease; eGFR, estimated glomerular filtration rate; MDRD, Modification of Diet in Renal Disease; SD, standard deviation.


ABOUT
BROWSE ARTICLES
EDITORIAL POLICY
FOR CONTRIBUTORS
Editorial Office
#301, (Miseung Bldg.) 23, Apgujenog-ro 30-gil, Gangnam-gu, Seoul 06022, Korea
Tel: +82-2-3486-8736    Fax: +82-2-3486-8737    E-mail: registry@ksn.or.kr                

Copyright © 2024 by The Korean Society of Nephrology.

Developed in M2PI

Close layer