


Introduction
Obesity, a major global health issue, is associated with an increased risk of the development of acute kidney injury as well as metabolic disorders such as diabetes and cardiovascular and kidney disease [1]. The comorbidity of acute kidney injury is increasing along with the rise in obesity. One-third of patients in intensive care units throughout the world have been reported to meet the criteria for obesity, and acute kidney injury may occur in over 50% of these patients [2,3]. Ischemia-reperfusion (IR) injury to the kidney is one of the most common causes of acute kidney injury [4]. Whether obesity accelerates the severity of IR injuries remains unclear.
Adipose tissue is a store of excess calories and is now recognized as an important endocrine organ [5]. This tissue synthesizes adipokines and secretes the adipokines via paracrine and endocrine pathways, thereby maintaining metabolic homeostasis. Moreover, visceral white adipose tissue, in particular, may play a role in the development of a variety of diseases [6,7]. Perirenal adipose tissue surrounds the kidneys, providing mechanical support. Recently, a close relationship has been demonstrated between perirenal adipose tissue and renal diseases, which is referred to as the adipo-renal axis [8,9].
Cellular senescence is an irreversible arrest of cell cycle progression evoked in response to stress and damage [10]. Obesity triggers renal senescence, suggesting a potential role in the progression of renal injury [11]. In obese mouse models, senescent cells accumulate in visceral adipose tissue [12]. However, the relationship between the kidney and senescence in perirenal adipose tissue remains unknown. In addition, whether renal IR injury affects adipose tissue around obese kidneys is uncertain.
Therefore, the aim of the study was to investigate whether obesity accelerates the severity of IR injury and cellular senescence in injured kidneys and perirenal adipose tissues in high-fat-diet–induced obese (DIO) mice.
Methods
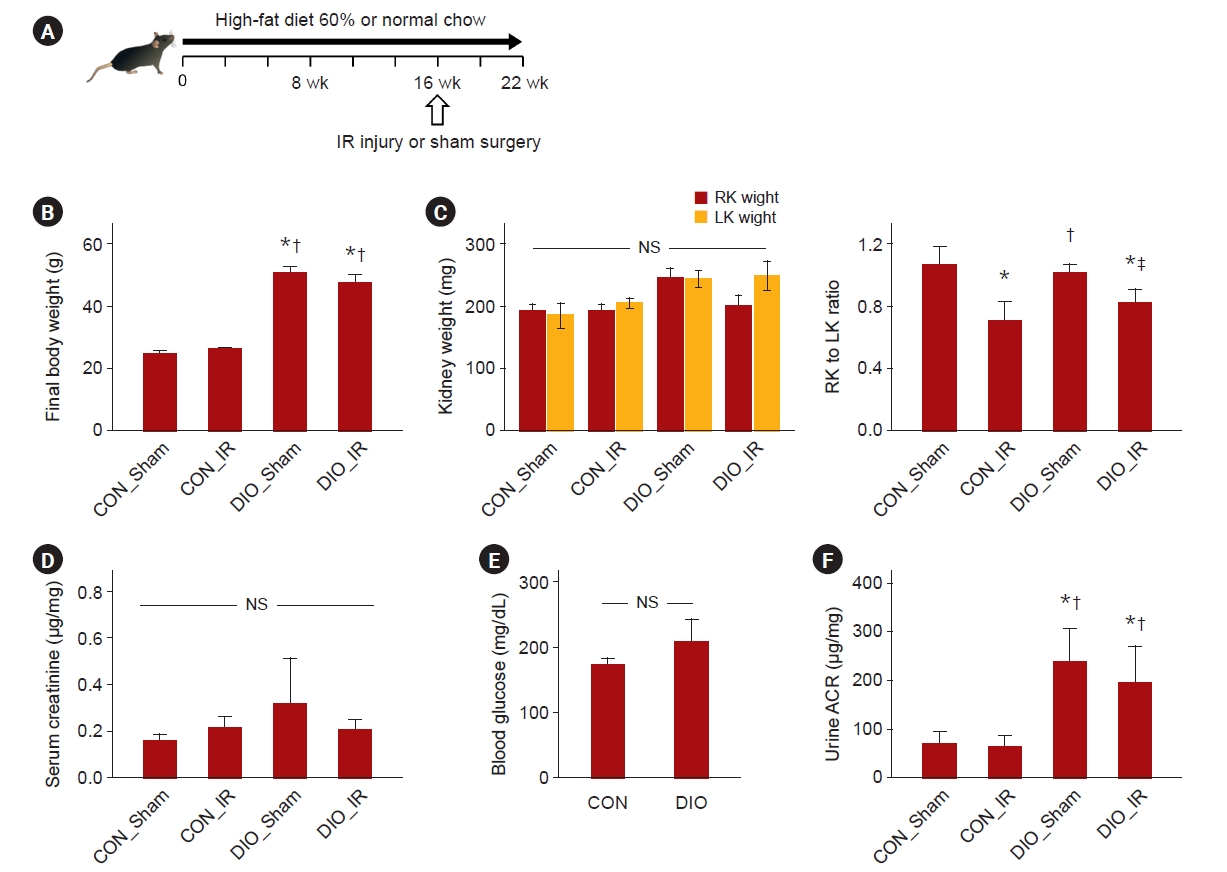
All animal procedures followed the Guide for the Care and Use of Laboratory Animals and were approved by the Institutional Animal Care and Use Committee of the Pusan National University (No. 2021-004-A1C0(0)). C57BL male mice were fed for 16 weeks with either standard chow (control, CON) or a high-fat diet (Adjusted Calories Diet [60% Fat; TD.06414, 5.1 kcal/g; DooYeol Biotech] with approximately 15–25 kcal of daily calorie intake in each mouse) and randomized to either renal IR or sham groups. The CON_Sham, CON_IR, DIO_Sham, and DIO_IR groups comprised 6 to 10 mice each. Renal IR surgery was performed by unilateral clamping of the right renal pedicle for 30 minutes. Six weeks after surgery, urine samples were collected via cystocentesis, and mice were euthanized by terminal blood sampling (Fig. 1A). The kidneys were harvested, weighed, and halved for freezing and preservation in formalin. Perirenal fat (K) was collected from the lateral side of the kidneys, and epididymal fat (E) was obtained. Since mice fed with normal chow did not have enough perirenal fat to analyze, five fat groups other than perirenal fat were analyzed (Sham_E, DIO_Sham_E, DIO_Sham_K, DIO_IR_E, and DIO_IR_K).
Serum and urine measurements
The levels of serum and urine creatinine were assayed using enzyme-linked immunosorbent assays (ELISA) (#80350; Crystal Chem) according to the manufacturer’s instructions. Urinary microalbumin was measured by the Mouse Microalbumin ELISA Kit (#80630; Crystal Chem). Urine albumin excretion was then normalized to urine creatinine and expressed as urinary albumin-to-creatinine ratios (ACRs). The glucometer Accu-Chek Instant (Roche) was used for measuring glucose levels in whole blood after feeding [13].
Kidney and adipose tissue measurements
SYBR green-based quantitative reverse transcription (RT)-polymerase chain reaction (PCR) results were analyzed in frozen kidney and fat tissues, as described previously [14]. Briefly, total RNA was extracted and complementary DNA (cDNA) was generated. The PCR was performed with 100 ng of cDNA. The PCR was performed at 95 °C for 15 minutes, followed by 45 cycles at 95 °C for 20 seconds and 55 °C for 40 seconds. The PCR primer pairs, including those of Gapdh as an internal control, are shown in Supplementary Table 1 (available online). Fold changes of each target gene in the experimental groups relative to the control group were calculated using the 2-ΔΔCT method.
To estimate the degree of fibrosis, Masson-Trichrome staining was performed on renal paraffin sections. Interstitial fibrosis was semiautomatically quantified in 10 randomly chosen fields per section using ImageJ (FIJI software; National Institutes of Health) as previously described [15] and expressed as the percentage of blue-stained area to the total field area. Tubular injury in the outer medulla was scored in periodic acid‐Schiff (PAS) stained sections, as described [16]. To evaluate macrophage infiltration, renal paraffin sections were stained with F4/80 antibody (#ab111101; Abcam) [17]. For analysis of interstitial fibrosis and macrophage infiltration, the cortex area, including a few glomeruli, was randomly chosen, avoiding the perivascular regions as much as possible. To study the degree of senescence in renal and adipose tissue, renal and fat sections were stained for p21 antibody (#ab188224; Abcam). To assess proliferation and tumor necrosis factor alpha (TNF-α) expression in adipose tissue, paraffin-embedded sections were stained with Ki67 (#14-5698-82; Invitrogen) and TNF-α (#ab1793; Abcam) antibodies. F4/80+ macrophages, p21+ senescent cells, Ki67+ proliferative cells, and TNF-α+ cells were manually counted in 10 randomly chosen fields per section and expressed as positive cell numbers per field or a positive cell percentage out of the total cell number per field [18]. All slides were analyzed in a blinded manner.
Protein expression of p21 (1:1,000, #ab188224), TNF-α (1:1,000, #ab1793), and interleukin (IL)-6 (1:1,000, #ab208113; Abcam) was measured in 100 μg of protein from each homogenized adipose tissue sample by western blot. Beta-actin (1:5,000, #A3854; Sigma) was used as a loading control, and band intensity was quantified using ImageJ software.
In vitro study
HK-2 human renal tubular cells (Korean Cell Line Bank) were cultured in Dulbecco’s modified Eagle’s medium (DMEM; Gibco) containing 10% fetal bovine serum (Gibco), 60-U/mL penicillin G (Sigma), and 60-μg/mL streptomycin (Sigma). 3T3-L1 preadipocytes (Korean Cell Line Bank) were cultured in DMEM until a confluency of 70% was reached. To induce their differentiation into mature adipocytes, DMEM was changed to methylisobutylxanthine, dexamethasone, and insulin induction medium (0.5-mM IBMX and 1-μM dexamethasone; Abcam) that was replaced with insulin medium (10 μg/mL). All cultures were performed in a humidified 5% CO2 atmosphere at 37 °C. By days 7 to 10, fully differentiated adipocyte-like cells were obtained and tracked by Oil Red O staining using Oil Red O stock solution (MAK194; Sigma) to confirm lipid accumulation.
To induce senescence, two types of cells at a sub-confluent density were incubated with H2O2 (Fisher Scientific) at 0.2 mM for 48 hours; the untreated cells (in parallel) served as the control. H2O2 was removed 48 hours after treatment. Conditioned media were not replaced, but rather added for 7 days [19]. Cells were collected after 7 days, and conditioned media were harvested. The degree of senescence and senescence-associated secretory phenotype (SASP) in H2O2-treated cells was determined using RT-PCR, p21 staining (#ab188224), and ELISA. Briefly, SYBR green-based quantitative RT-PCR was analyzed in collected cells using the same methods as tissue PCR. The PCR primer pairs are shown in Supplementary Table 1 (available online). The levels of IL-1β (human ELISA kit, #88-7261-22; Invitrogen) and IL-6 (mouse ELISA kit, #M6000B; R&D system) in conditioned media were measured using ELISA according to the manufacturer’s instructions.
To determine a causal relationship, coculture experiments of H2O2-induced senescent adipocytes with normal renal tubular cells and H2O2-induced senescent renal tubular cells with normal adipocytes were performed on 6.5-mm Transwell plates with 3.0-µm Pore Polyester Membrane Inserts (#3472; Corning) [20]. At the start of the experiment, differentiated adipocytes and renal tubular cells were sown in the lower wells and treated with 0.2-mM H2O2 for 48 hours. The H2O2 was removed before the coculture. Untreated, opposite cells were sown in the upper wells. The upper wells were attached to the lower wells, and cells were cultured in two layers with medium communication between the wells for 7 days. In cocultured cells, RT-PCR for senescence and SASP genes was performed. The PCR primer pairs are shown in Supplementary Table 1 (available online).
Statistical analysis
Statistical analysis was performed using SPSS version 13.0 (SPSS Inc.). Parametric (independent t test) and nonparametric (Mann-Whitney U test) tests were used for comparisons between groups. Data from more than two groups were assessed by the analysis of variance and Kruskal-Wallis test. A p-value of ≤0.05 was considered statistically significant.
Results
The final body weights of DIO mice were approximately twice those of the control groups (all p ≤ 0.02) (Fig. 1B). The ratios of right to left kidney were decreased in IR compared to sham groups (CON_Sham vs. CON_IR, p = 0.001; CON_Sham vs. DIO_IR, p = 0.006; and DIO_Sham vs. DIO_IR, p = 0.04); but the ratio was similar between CON-IR and DIO-IR (p = 0.35) (Fig. 1C). Serum creatinine and blood glucose levels did not differ statistically among the groups (p = 0.23 and p = 0.12) (Fig. 1D, F). The urine ACR was increased in mice receiving a high-fat diet compared to control mice (all p ≤ 0.02) (Fig. 1E).
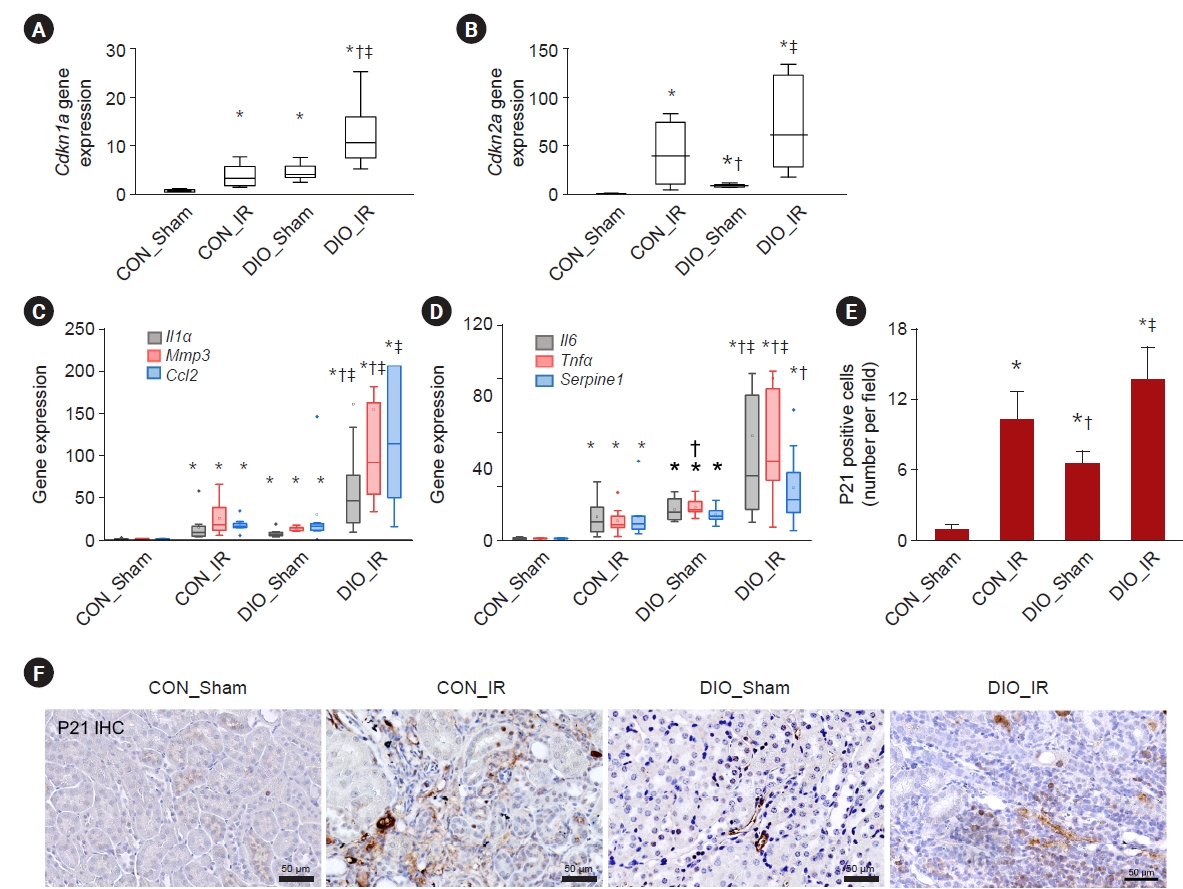
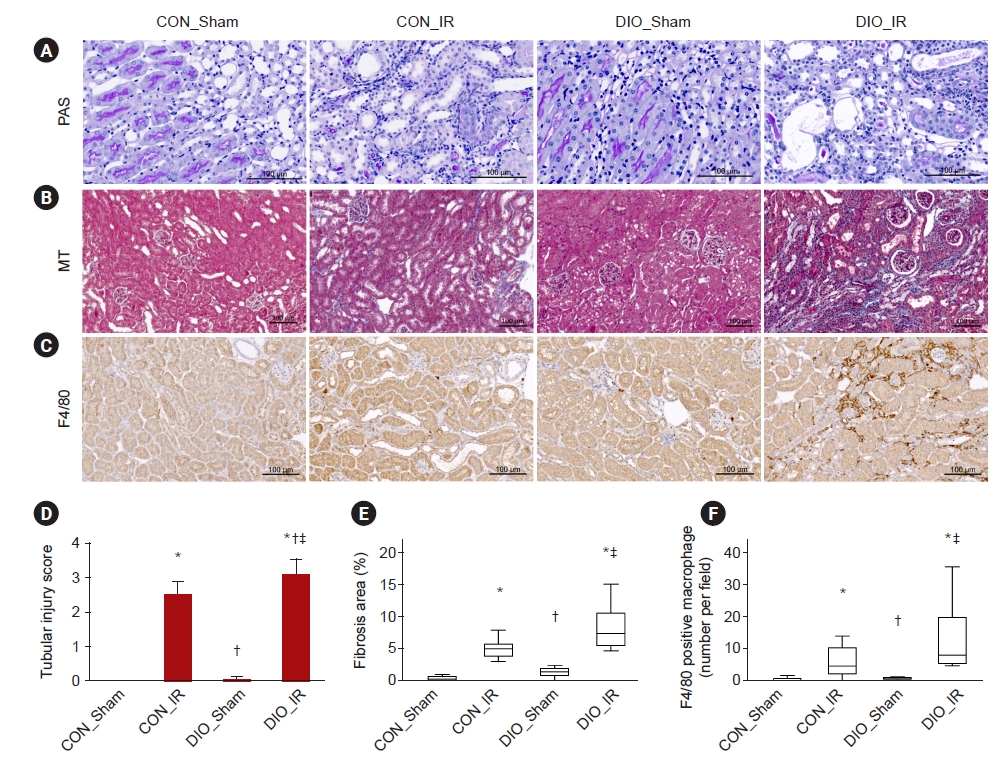
Renal gene expression of Cdkn1a, which translates p21, was upregulated in the IR or DIO groups (all p ≤ 0.002) and was further increased in DIO_IR kidneys (vs. CON_IR, p = 0.01) (Fig. 2A). Expression of Cdkn2a, p16, was upregulated only in IR injury groups compared to shams (all p ≤ 0.003) (Fig. 2A, (B). Secretory phenotype renal gene expression was upregulated in CON_IR or DIO groups (all p ≤ 0.02). Moreover, expression of Il1α, Mmp3, Il6, Tnfα, and Serpine1 was further increased in the IR kidneys of mice on a high-fat diet (vs. CON_IR, all p ≤ 0.03) (Fig. 2C–E). The number of p21+ senescent cells was increased in either the IR or DIO groups (all p ≤ 0.006), and this number tended to be greater in DIO-IR than in control-IR (p = 0.07) (Fig. 2E, F). The degree of renal tubular injury was increased in IR groups compared to sham groups (all p ≤ 0.003) and was higher in DIO_IR than in CON_IR (p = 0.05) (Fig. 3A, D). PAS staining showed glomerulomegaly and vacuoles localized primarily to proximal tubular cells in DIO groups. Renal fibrosis was increased in either the IR or DIO groups (all p ≤ 0.004), and fibrosis tended to be greater in DIO-IR than in control-IR (p = 0.08) (Fig. 3B, E; Supplementary Fig. 1, available online). The difference in F4/80-positive macrophage infiltration was remarkable in IR compared to Sham groups (all p ≤ 0.05) but was not statistically different between the two IR groups, possibly due to high variability (p = 0.15) (Fig. 3C, F; Supplementary Fig. 2, available online).
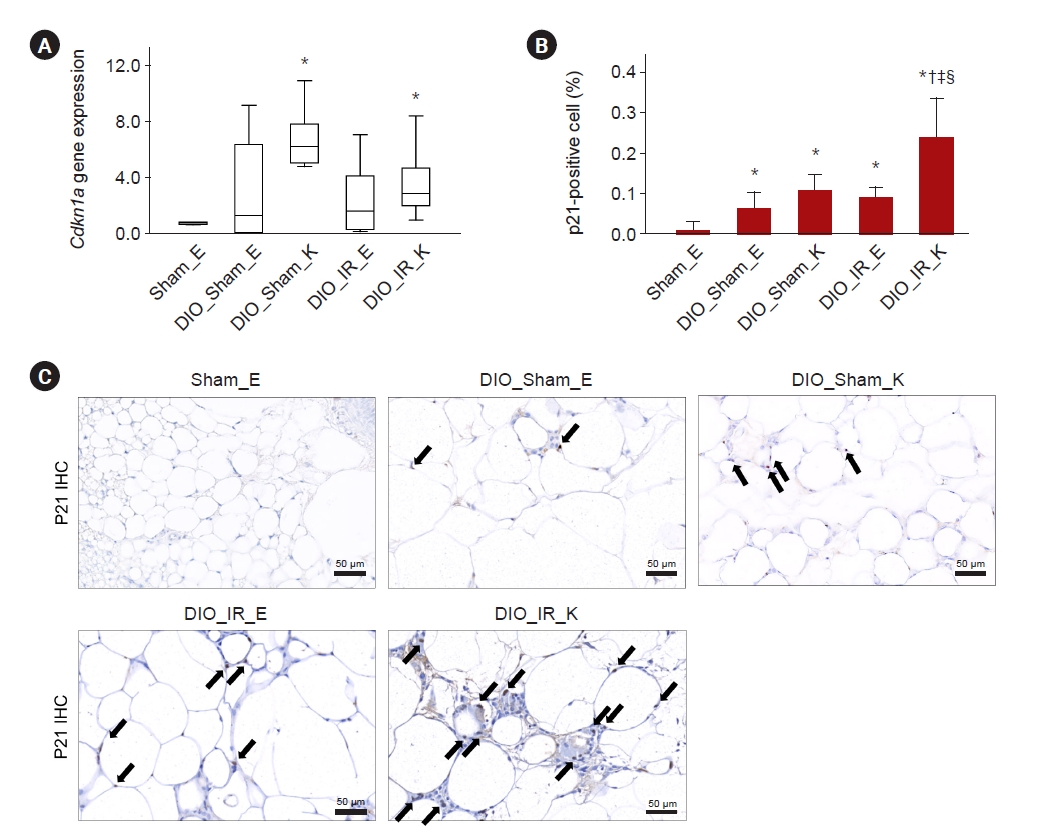
Expression of the p21 gene was higher in the perirenal depots of mice on a high-fat diet with or without IR injury than in the control mice (p = 0.01 and p = 0.04, respectively) (Fig. 4A). p21 expression in fat sections was increased in mice on a high-fat diet compared to control mice (all p ≤ 0.04) and further upregulated in perirenal fat in DIO_IR mice than in the fat from other sources (all p ≤ 0.002) (Fig. 4B, C). The number of Ki67+ proliferative cells was increased in the epididymal and perirenal fat of mice on a high-fat diet regardless of IR injury compared to mice on a normal chow (all p ≤ 0.03). However, perirenal adipose tissue in obese mice with IR injury showed decreased Ki67+ cells compared to other adipose tissue depots in obese mice, implying upregulated senescence in this depot (all p ≤ 0.003) (Supplementary Fig. 1, available online). Adiponectin expression was downregulated in both epididymal and perirenal depots of mice on a high-fat diet compared to the controls (all p = 0.003), but was slightly higher in the perirenal depots of DIO_Sham and DIO_IR than in the epididymal depot of DIO_Sham (p = 0.05 and p = 0.04, respectively) (Fig. 5A). Tnfα and Il6 gene expression was upregulated only in the perirenal depots of mice on a high-fat diet compared to the epididymal depots of mice either on or not on a high-fat diet (all p ≤ 0.02). Tnfα gene expression in the epididymal fat tended to be higher in DIO_Sham than in Sham (p = 0.08), and TNF-α protein expression was higher in DIO_IR_K than in Sham_E and DIO_Sham_K (p = 0.02 and p = 0.04, respectively). IL-6 protein expression had a strong tendency to increase in DIO_IR_K compared to Sham_E (p = 0.06) (Fig. 5B–E; Supplementary Fig. 2, available online). TNF-α positive cell percentage in fat sections was increased in mice on a high-fat diet compared to control mice (all p ≤ 0.01) and was further upregulated in perirenal fat in DIO_IR mice than in the fat from other sources (all p ≤ 0.04) (Fig. 5F, G).
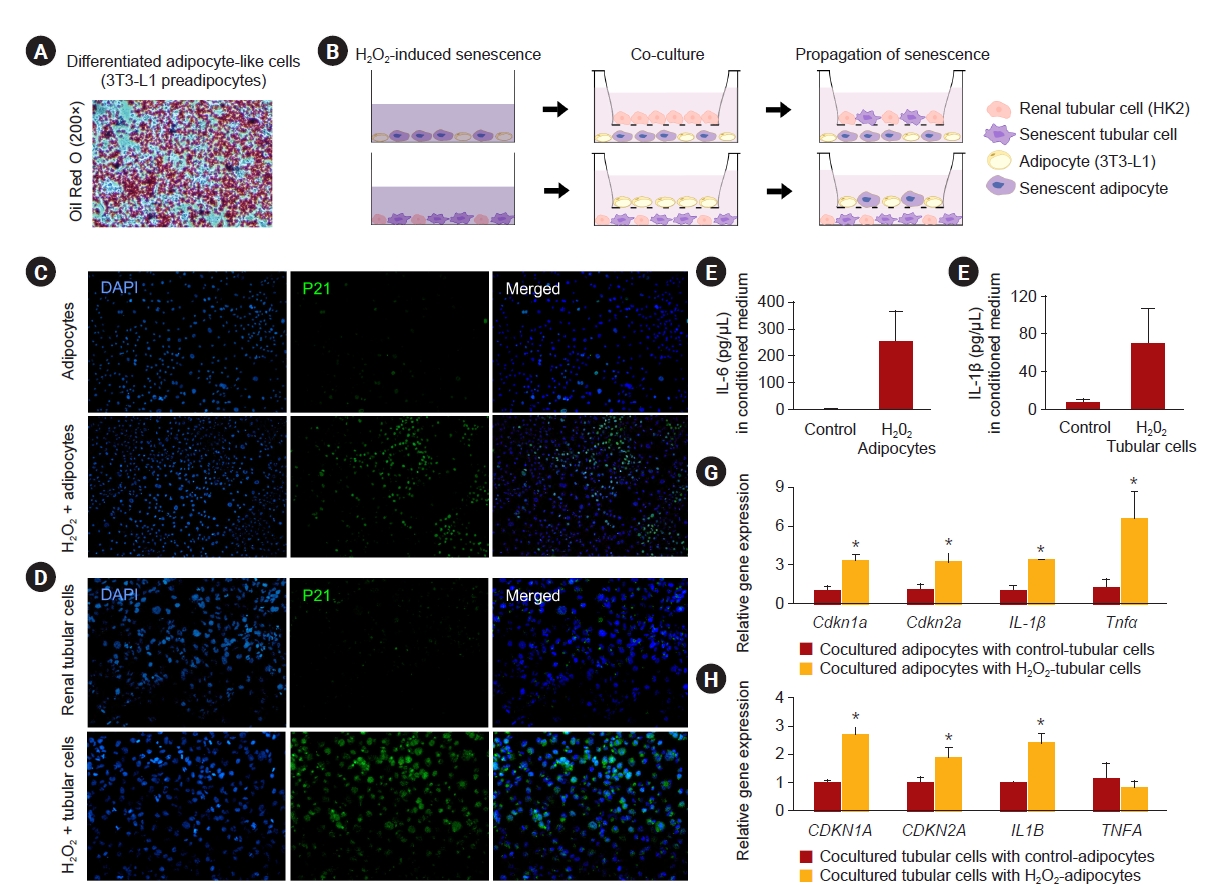
In an in vitro study, HK2 cells and fully differentiated 3T3-L1 cells (Fig. 6A) represented renal tubular cells and mature adipocytes, respectively. Initially, senescence was induced by H2O2 in both cell lines. Then, cells were cultured in two layers with medium communication between wells for 7 days using Transwell plates (Fig. 6B). Most of the adipocytes and renal tubular cells incubated with H2O2 at 0.2 mM for 48 hours expressed p21 and were senescent (Fig. 6C, D). Conditioned medium harvested at day 7 after removal of H2O2 contained increased levels of IL-6 in the H2O2-treated adipocytes and IL-1β in the H2O2-treated tubular cells compared to control cells (p = 0.003 and p = 0.05, respectively) (Fig. 6E, F). Relative gene expression of Cdkn1a, Cdkn2a, Il1β, and Tnfα was higher in cocultured adipocytes with senescent renal tubular cells than with control ones (all p ≤ 0.05) (Fig. 6G). Cocultured renal tubular cells with senescent adipocytes also showed increased CDKN1A, CDKN2A, and IL1Β expression (all p ≤ 0.04) (Fig. 6H).
Discussion
In this study, obese mice showed more renal tubular damage and fibrosis with IR injury than control mice, even though the degree of ischemic insult was comparable. Renal expression of senescence and its secretory phenotype were upregulated in either IR injury or with a high-fat diet and further increased in the IR kidneys of obese mice. Fat senescence and TNF-α expression were also increased, especially in the perirenal depot of the IR kidneys of mice on a high-fat diet. Therefore, a high-fat diet exacerbates IR injury in murine kidneys, which may be associated with perirenal fat senescence and inflammation. These results support interactions between the injured kidney and perirenal adipose tissue and the potential role of senescence in this adipo-renal axis.
Previous studies have shown albuminuria without nephritis and the development of glomerulomegaly and glomerulosclerosis in obese patients, now recognized as obesity-related glomerulopathy [1]. Our mice on a high-fat diet encountered glomerulomegaly and glomerular damage demonstrated by albuminuria and upregulated senescence in the kidneys. Obesity triggers the accumulation of senescent cells in various organs and contributes to the development of obesity-related dysfunction [21,22]. In obesity, organ lipid deposition is associated with impaired fatty acid oxidation and mitochondrial dysfunction, leading to cellular senescence [19]. Mitochondrial dysfunction during cellular senescence is a key factor in the consolidation of senescence and the initiation of the secretory phenotype [22,23]. A recent study showed that renal cellular senescence is induced by obesity and dyslipidemia and correlates with renal dysfunction and hypoxia [11]. Furthermore, the clearance of senescent cells in obesity recapitulated functional and metabolic improvements [11,22].
Senescent cells exhibit a secretion phenotype in 30% to 70% of cases, which fosters their senescence and the senescence of adjacent cells and exerts deleterious effects locally and systemically [24]. Recent studies have demonstrated that transplantation of a small number of senescent cells can even provoke significant injury and dysfunction in various organs, including the kidney and the knee joint [25,26]. Our study showed that both obesity and IR injury elicited senescence in the kidney and perirenal adipose tissue. Moreover, the perirenal fat around the injured kidney was more senescent and proinflammatory, suggesting the potential role of the SASP in adipo-renal interactions. Although confirming a causal connection in our mouse study is difficult, we identified the propagation of senescence by SASP in vitro coculture experiments between renal tubular cells and adipocytes. Further studies are needed to confirm the direct cause-and-effect relationship in this exacerbation.
Perirenal adipose tissue consists of white adipocytes, inactive and active brown adipocytes, preadipocytes, sympathetic nerve endings, vascular structures, and various types of inflammatory cells [9]. This study demonstrated boosted senescence and TNF-α expression in the perirenal depot of the IR kidneys of mice on a high-fat diet. Recent studies showed that perirenal adipose tissue contributes to chronic renal pathology. Perirenal fat thickness is an independent risk factor for deterioration of the glomerular filtration rate in hypertensive patients and type 2 diabetes patients [27,28]. Increased perirenal fat mechanically compresses the kidney; raises intrarenal pressure; reduces renal blood flow; and, in turn, promotes renin secretion and tubular sodium reabsorption, which results in the acceleration of kidney disease progression [29]. Accumulation of perirenal adipose tissue releases adipokines including leptin and resistin, leading to the expression of proinflammatory cytokines such as TNF-α, IL-1β, and IL-6 [9]. However, this accumulation reduces anti-inflammatory adiponectin release. These adipokines and cytokines may affect adjacent kidneys in a paracrine manner. Finally, perirenal adipose tissue is regarded as a reservoir of mesenchymal stem cells (MSCs), which retain regenerative and immunomodulatory capacity [30]. A recent study showed that obesity induces cellular senescence in adipose-tissue–derived MSCs and leads to impaired reparative properties [31]. Indeed, the IR kidneys were injured worse in our mice on a high-fat diet, implying damage to the endogenous MSC repair system after IR insult in obese mice.
We acknowledge some limitations in our study. The murine study is limited by small group sizes and the variability of the IR surgery. In obesity-related animal models, the effect of obesity may overlap with the impact of overt diabetes. However, our DIO mice did not show significantly increased blood glucose levels, so we could exclude the effect of diabetes on the kidney. We could not compare the perirenal fat of obese mice directly to mice with normal chow because of insufficient amounts of perirenal fat in normal-weighted mice. We included only perirenal fat collected from the lateral side of the kidneys, which is regarded as white adipose tissue. Thus, the effect of brown adipose tissue, which may be around the adrenal gland and renal sinus, on the kidney cannot be excluded. In our study, epididymal fat depots did not exhibit upregulation of proinflammatory cytokines including TNF-α and IL-6 in RT-PCR or western blotting, but TNF-α expression in immunohistochemistry staining was increased in the epididymal fat depot. This discrepancy between gene and protein expression might be secondary to differences in protein translation and degradation rates [32]. Also, due to the limited amount of murine perirenal adipose tissue, there may still be problems with handling in protein analysis. Epididymal fat also showed adipocyte hypertrophy, increased senescence, and downregulated adiponectin. Since different regional adipose tissues may express various inflammatory properties [33], further studies are needed to confirm the differences between the various regional adipose tissues. Finally, clamping the renal vessels in the IR surgery may damage perirenal adipocytes. Nevertheless, the perirenal adipose tissue is well-vascularized and supplied by an anastomosing capillary network, which is produced by the branches of the left colic, lower adrenal, renal, lumbar, and ovarian or testicular arteries [9].
In conclusion, IR injury in murine kidneys is exacerbated by a high-fat diet and is related, at least in part, to senescence and inflammation in perirenal fat. These results suggest the importance of interactions between the injured kidney and perirenal adipose tissue and the potential role of senescence in this adipo-renal axis. Further research is needed on therapeutic targets of the adipo-renal axis in injured obese kidneys.

 PDF Links
 PubReader
 ePub Link
 Full text via DOI
 Download Citation
 Supplement table 1
 Print
Print


")


