


Introduction
Pulmonary hypertension (PH) is a common complication of chronic kidney disease (CKD). The prevalence of PH has been reported to increase with the severity of CKD, ranging from 21% in CKD G3 (G, glomerular filtration rate category) [1] to 35% to 38% in CKD G5D (D, dialysis) [2,3]. Among hemodialysis (HD) patients, the prevalence of PH ranges from 12.6% to 47% in different countries [2–5]. In Chinese individuals, the prevalence ranges from 34.6% to 39.1% [6,7]. PH is an important predictor of morbidity and mortality in patients with HD. Compared with patients not on HD, patients on HD have a 2.27-fold risk of cardiovascular (CV) events, 1.85-fold risk of all-cause death, and 2.17-fold risk of CV death [3].
PH is defined as mean pulmonary artery (PA) pressure of >20 mmHg. PH may involve multiple clinical conditions and may be associated with various left heart disease, respiratory, and other diseases [8]. PH is attributed to CKD based on similar pathophysiological mechanisms, clinical presentation, hemodynamic characteristics, and therapeutic management. We believe that fluid status and blood flow rate in the arteriovenous fistula (AVF) are the two most important factors affecting hemodynamic for HD patients.
Several factors could be involved in the pathogenesis of PH in HD patients, including fluid status [9,10], blood flow rate in the AVF [11], cardiac function, inflammation, calcification, etc. To the best of our knowledge, few studies have used objective methods to evaluate fluid overload, and the results have been inconsistent [9,10,12]. Yılmaz et al. [9] demonstrated a strong relationship between fluid overload and PH in HD patients, whereas two other studies showed no significant difference in fluid overload between patients with and without PH [10,12]. No relevant studies have been conducted on the Chinese population to date. Valerianova et al. [11] reported that 42 patients with high Qa underwent surgery to reduce blood flow through the AVF, which reduced the incidence of PH from 81% to 36%, indirectly confirming the role of blood flow rate in AVF in HD patients. However, direct evidence in this regard from studies with larger sample sizes is lacking. Therefore, we aimed to evaluate the effects of fluid volume and Qa on PH in HD patients. To the best of our knowledge, this is the first study to evaluate the role of these two factors in the development of PH among HD patients.
Methods
The study was reviewed by the ethics committee of the First Affiliated Hospital of Dalian Medical University (No. PJ-KS-KY-2021-36) and registered in the Chinese Clinical Trial Registry (registration No. ChiCTR 2100054808). This study was performed in accordance with the Declaration of Helsinki and written informed consent was obtained from all the patients.
Study design and patients
This single-center cross-sectional study enrolled 219 patients who attended the blood purification center and underwent HD at the First Affiliated Hospital of Dalian Medical University from December 2021 to August 2022. Patients aged 18 to 80 years, those who were undergoing maintenance HD treatment (thrice a week, 4 hours per session) for more than 3 months, and those who showed stable clinical condition (no hospitalization, dry weight adjustment, or vascular access changes) 2 weeks were included. Patients with idiopathic or hereditary PH, rheumatic heart disease, congenital heart disease, autoimmune disease, chronic obstructive pulmonary disease, and pulmonary embolism were excluded.
Clinical parameters
Clinical and demographic data of the patients, including the causes of kidney failure, duration of dialysis, presence of diabetes mellitus, hypertension, history of CV events, vascular access, current smoking status, mean weight add per session of HD and blood pressure for 2 weeks, and body mass index (BMI) were recorded.
Assessment of pulmonary artery pressure
All patients underwent Doppler echocardiography using the Vivid E9 ultrasound system (GE Vingmed Ultrasound) equipped with an M5S phased array transducer (3.5 MHz), within 2 hours after HD for research. Echocardiography measurements were performed by two experienced echocardiologists who were blind to the study. The inter-observer variability analysis was performed using the Bland-Altman method within the 95% consistency limit. The systolic PA pressure (SPAP) was measured using the following modified Bernoulli equation:
SPAP=RVSP = 4V2 + RAP
where RVSP is the right ventricular systolic pressure, V is the maximum tricuspid regurgitation velocity (TRV; m/sec), and RAP is the right atrial pressure. As per the 2015 the European Society of Cardiology and the European Respiratory Society (ESC/ERS) guidelines [13], a diagnosis of PH was established when the peak TRV was ≥2.8 m/sec and the RVSP was ≥35 mmHg. The left ventricular ejection fraction (LVEF), left ventricular internal dimension (LVID)-end diastole, left atria (LA)-end systole, right ventricular internal dimension (RVID)-end diastole, interventricular septum-end diastole, PA diameter, and E/Eʹ were also recorded at the same time.
Volume assessment
Fluid overload was measured objectively using bioimpedance spectroscopy (body composition monitor [BCM]; Fresenius Medical Care) before the midweek HD session for research. BCM analyzes total body electrical impedance to an alternating current at 50 different frequencies (5–1,000 kHz). With the patient in a supine position, four disposable electrodes were attached: two to one hand and the other two to one foot on the same side of the body. The software of the BCM device automatically calculated the overhydration (OH), total body water (TBW), extracellular water (ECW), and intracellular water.
Measurement of blood flow rate in the arteriovenous fistula
Qa was determined by Doppler ultrasound performed by a certified ultrasound technician using Acclarix AX8 Super (EDAN Instruments) equipped with a 17-MHz linear array probe. Measurements were performed from the brachial artery regardless of whether the AVF was radial or brachial artery based [14], using the following formula:
Qa = time-averaged mean velocity × cross-sectional area
Three consecutive measurements were performed before HD, and the average of the three values was taken as the Qa value.
Laboratory tests
All measurements were performed according to standard methods. Venous blood was collected before the midweek HD session in the morning, after the patients had fasted for at least 8 hours. Hemoglobin concentration was determined by colorimetric assay by the cyanomethemoglobin method using the Sysmex XN-1000 Hematology Analyzer (Sysmex). Total cholesterol, triglyceride, low-density lipoprotein cholesterol, high-density lipoprotein cholesterol, serum creatinine, uric acid, calcium, and phosphorus levels were determined by enzyme method and ion electrode method using the Hitachi 7600 automatic biochemistry analyzer (Hitachi). Albumin level was determined by colorimetric assay with bromocresol green using the Roche/Hitachi Cobas C701 analyzer (Roche). The levels of N-terminal prohormone of brain natriuretic peptide (NT-proBNP) and intact parathyroid hormone (iPTH) were determined by electrochemiluminescence immunoassay ECLIA using the Roche/Hitachi Cobas E601 analyzer (Roche). High-sensitivity CRP was measured by an immunoturbidimetric assay using the Roche/Hitachi Cobas C701 analyzer. β2 microglobulin (β2M) level was determined by an immunoturbidimetric assay using AU 5800 (Beckman Colter).
Statistical analysis
All data were analyzed using SPSS software ver. 25.0 (IBM Corp.). The Shapiro-Wilk test was used to assess whether the data showed a normal distribution. Categorical data were summarized as numbers and percentages. Variables with normal distribution are expressed as mean and standard deviation and nonparametric variables, as median and interquartile range. The Student t test, Mann-Whitney U test, and chi-square were used to determine the differences between the groups, as appropriate.
Multivariate regression analyses were conducted to examine the predictors of PH. We built a multivariable model that included variables that showed a significant difference and that we considered to be related to PH. NT-proBNP was processed as a grade variable to prevent the constant odds ratio (OR) value and 95% confidence interval (CI). The boundary values of NT-proBNP were decided by referring to the study by Harrison et al. [15]. Stepwise forward selection logistic regression was performed. A p-value of <0.05 was considered to indicate statistical significance.
Results
Study population
The study flow is shown in Fig. 1. A total of 219 patients were included in our study, of whom 139 (63.5%) were male. The mean patient age was 58 years (range, 50–67 years). The median duration of HD was 78.5 months (range, 36–129.7 months), and the prevalence of PH was 13.7% (30 of 219). No differences were observed between patients with and without PH except in terms of age; BMI; CV events; dialysis blood flow rate; and albumin, creatinine, iPTH, β2M, and triglycerides levels. Patients who developed PH were older; had lower BMI; lower dialysis blood flow rate; and lower levels of albumin, creatinine, iPTH, and triglycerides. In addition, patients with PH were more likely to experience CV events and had higher β2M. The clinical characteristics of the patients are summarized in Table 1.
Echocardiographic, volume-, and Qa-related parameters
Echocardiographic evaluation showed that the mean LVEF was 58% (range, 56%–60%) and the mean LA-end systole was 38 mm (range, 36–41 mm). The BCM showed that the average OH before HD was 1.5 L (range, 0.6–2.8 L) and that after HD (post OH) was −0.6 L (range, −1.6 to 0.7 L). The mean NT-proBNP level was 4,220 ng/L (range, 2,086–11,025 ng/L). The mean Qa of patients with AVF was 780 mL/min (range, 570.0–1,015.5 mL/min). Vascular access for HD was achieved by intravenous catheterization in three patients. No differences were observed between patients with and without PH, except in terms of LVEF, LVID, LA, RVID, PA diameter, OH, post-OH, OH/ECW, ECW/TBW, and NT-proBNP levels. Patients with PH had lower LVEF and greater LVID, LA, RVID, PA diameter, OH, post-OH, OH/ECW, ECW/TBW, and NT-proBNP levels. Details are summarized in Table 2.
Univariate and multivariate logistic analysis for prevalence of pulmonary hypertension
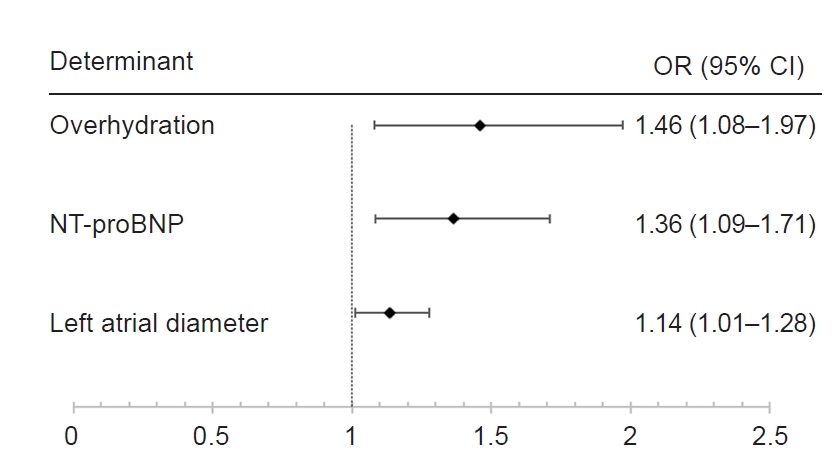
The univariate and multivariate determinants of the prevalence of PH are shown in Table 3 and Fig. 2, 3. Three variables, namely OH (OR, 1.46; 95% CI, 1.08–1.97; p = 0.01), NT-proBNP (OR, 1.36; 95% CI, 1.09–1.71; p = 0.007), and LA (OR, 1.14; 95% CI, 1.01–1.28; p = 0.03) were significant determinants of PH.
Discussion
In our study, the prevalence of PH in HD patients was 13.5%, which was consistent with some previous studies that reported a prevalence ranging from 12.6% to 17% [5,16], whereas other studies have reported a prevalence ranging from 34% to 44% [3,4,7]. These differences may be attributable to the different diagnostic criteria used in different studies. In our study, PH was defined as peak TRV of ≥2.8 m/sec and SPAP of >35 mmHg, according to the 2015 ESC/ERS guidelines [13], whereas some other studies defined PH as TRV of >2.5 m/sec and SPAP of >35 mmHg, which is a more inclusive threshold [17]. Furthermore, our patients underwent echocardiography within 2 hours after HD to avoid the impact of capacity overload; this can help reduce the possibility of development of PH. In addition, patients who developed conditions such as acute heart failure (HF) or required dry weight adjustment in the 2 weeks were excluded. Hence, the number of patients who developed PH was lower in our study than in other studies. Our findings could help determine the factors associated with the development of PH in stable patients who have achieved their dry weight.
Fluid volume is one of the biggest differences between HD patients and healthy individuals. Bioimpedance spectroscopy is a noninvasive and convenient method to quantitatively assess the fluid volume status of the patient. However, very few studies on PH have used these indicators to assess fluid volume in patients with CKD [9,10]. In these studies, either OH/ECW [9] or ECW/TBW [10] was used as the main indicator of fluid volume; one of these studies confirmed that fluid volume was an independent risk factor for PH [9], whereas the other one showed contradictory results [10]. To the best of our knowledge, this is the first study to evaluate the association between fluid volume and development of PH in Chinese HD patients. The mean OH in our study was 1.5 L (range, 0.6–2.8 L). A previous study conducted on Chinese patients reported that OH values in HD patients before treatment had ranged from 2.11 to 2.13 L [18]. The slight volume overload in this study population may account for the lower incidence of PH in this study than in some other studies. An OH:EBW ratio of 15% or absolute values of an OH compartment of more than +2.5 L have been used as indicators of fluid overload, which is associated with increased mortality [19,20]. The OH/ECW ratio of 20% (range, 13%–23%) and the mean OH of 3.6 L (range, 2.3–4.6 L) observed in our patients with PH meet the above criteria.
In a study by Robbins et al. [21], injection of 500 mL of saline rapidly increased pulmonary capillary wedge pressure (PCWP) by more than 15 mmHg, confirming that liquid level would change PCWP and indicating the importance of PCWP as an important diagnostic basis for PH. Moreover, the diseased kidney is unable to excrete salt and water and secretes abnormal amounts of renin, which increases cardiac preload and afterload, leading to HF [22]. Therefore, approximately 44% of HD patients suffer from HF [23]. A decline in left heart function can predict the occurrence of PH [6], which leads to category 2 PH [13]. Taken together, fluid volume can affect PCWP and left heart function, subsequently conducting the TRV of the right heart.
In addition to volume, AVF is another unique feature of HD patients. AVF leads to a decrease in peripheral vascular resistance, which leads to left and right ventricular remodeling and dysfunction [24]. High cardiac output HF can increase left atrial pressure, which is freely transmitted to the pulmonary veins and capillaries, subsequently leading to the development of PH [25]. One study showed that surgical treatment of high-flow AVF (Qa, >1,500 mL/min) eventually decreased cardiac output and cardiac index, lowering the incidence of PH from 81% to 36% [11]. HHowever, no studies have directly confirmed that Qa is an influential factor for PH patients on hemodialysis. The relationship between AVF and PH prompted us to add Qa into the variables. In our study, we found no difference between the Qa of patients with and without PH, and Qa was not a risk factor for PH. Only 6.3% (13 of 205) of our patients had high-flow AVF (≥1,500 mL/min); however, this proportion ranged from 14% to 24% in other studies [11,26,27]. There are currently no universally accepted criteria to define HF-AVF; however, thresholds of 1,500 mL/min [28] and 2,000 mL/min [29] were often cited and were found to correlate with adverse cardiac remodeling. Tang et al. [30] reported that a Qa tertile of >1,027.13 mL/min was associated with a higher risk of CVD in Chinese individuals. Therefore, defining high-flow AVF as Qa of >1,500 mL/min is probably more reasonable in the Chinese population. Another study reported that high-flow AVF was not related to right heart function [26]. Overall, in our study, Qa did not differ significantly between patients with and without PH, which may be attributable to the fact that fewer patients in the study had high-flow AVF.
In our study, only LA diameter was a risk factor for PH in the cardiac ultrasound index. LA diameter is related to the duration of left ventricular diastolic dysfunction. The right heart usually works under low pressure; as the diastolic function of the left heart decreases, the left atrial pressure rises, and the right heart cannot tolerate high vascular resistance, leading to tricuspid regurgitation. Reque et al. [4] reported that systolic and diastolic dysfunction were independent risk factors for PH. This finding was consistent with the study by Zhang et al. [7], which reported that PH is independently associated with LA and LVEF. However, in our study, although LVEF showed a statistically significant difference between patients with and without PH, it did not behave as an independent risk factor. Out of the two previous studies that dealt with fluid volume index, one study did not mention LVEF [9] and the other study showed that LVEF was not an independent risk factor for PH in HD [31]. This may be related to the fact that LVEF was no longer an independent risk factor after the fluid volume was included in the analysis, which was a stronger marker of PH.
In addition to the LA, NT-proBNP can also reflect cardiac diastolic function. Previous research has shown that NT-proBNP ranges from 3,703 to 6,360 pg/mL in HD patients [32,33]. The mean NT-proBNP level in our study was 4,220 ng/L (range, 2,086–11,025 ng/L), which is consistent with previous research reports. Harrison et al. [15] suggested that NT-proBNP levels of >10,000 pg/mL were associated with more than 4-fold higher unadjusted risk for CV mortality in patients with ESKD. The mean NT-proBNP level of the patients who developed PH in our study was 23,114.5 ng/L (range, 7,452.5–70,000 ng/L), suggesting that NT-proBNP is a risk factor for PH.
This study has some limitations that should be considered. For instance, PH has been commonly diagnosed using echocardiography, and, thus far, no large-scale generalizable cohort studies have evaluated PH using right heart catheterization (RHC) [34]. Although some studies recruited patients with CKD from those who had undergone RHC [35], they failed to reflect the full picture of PH in the CKD population. The invasiveness of RHC limits its application in studying the hemodynamics of patients with PH. Without RHC it would be difficult to identify different groups or causes of PH, we need a multidisciplinary combination for specific diagnosis and treatment of PH. We use BCM to evaluate the volume status with OH once before the HD session; however, multiple measurements and an end-of-HD measurement will be better to represent the volume status of the patient [36]. Further randomized controlled trials in this area could help to better explain the role of fluid volume in the development of PH in HD patients and devise a more reasonable treatment plan.
In summary, to the best of our knowledge, this is the first study to evaluate the role of fluid volume and Qa, which are two important hemodynamic indicators, in HD patients who develop PH, and to demonstrate that fluid volume is a risk factor for PH in HD patients. In addition, we observed that LA diameter and high NT-proBNP levels, which were related to cardiac diastolic dysfunction, were also risk factors for PH.


 PDF Links
 PubReader
 ePub Link
 Full text via DOI
 Download Citation
 Print
Print


")


