


Introduction
Cognitive impairment is commonly observed in patients with end-stage renal disease (ESRD), and ESRD is one of the etiologies of dementia [1]. Although there are differences depending on the subjects or neurocognitive test used, the prevalence of cognitive impairment in patients with ESRD ranges from 16% to 38% [2]. Our previous study reported that approximately 70% of patients with ESRD had cognitive impairment [3]. An interesting result from previous publications is that vascular dementia is more common than Alzheimer dementia in patients with ESRD, and among various cognitive deficits, deterioration of frontal lobe function is particularly evident [4,5].
Two representative methods for screening cognitive function are the Mini-Mental State Examination (MMSE) and the Montreal Cognitive Assessment (MoCA) [6,7]. The MMSE has the advantage of requiring less time for evaluating cognitive function than the MoCA. However, due to its low sensitivity in identifying mild cognitive impairment in patients with a high level of education, the MMSEŌĆÖs reliability has been questioned [8]. Additionally, it does not indicate declines in attention, executive function, or visuospatial function. The MoCA can assess all cognitive domains and is sensitive to cognitive abnormalities in patients with mild cognitive impairment or dementia, according to multiple studies [9]. Furthermore, the MoCA is more suitable for evaluating the function of the frontal lobe specifically. It assesses a broad range of cognitive domains but predominantly covers executive function items, which is a prominent feature of dementia from vascular causes [4,5]. Therefore, the MoCA is a more appropriate test than the MMSE for cognition evaluation in patients with ESRD. The MoCA is a suitable cognitive screening instrument for patients with ESRD, exhibiting high levels of sensitivity and specificity and covering executive functions, which appear to play a significant role in the cognitive performance of patients with ESRD [10]. A MoCA threshold of 24 points was used to identify patients with cognitive impairment with a sensitivity of 77% and a specificity of 79%, whereas the MMSE discriminated between ESRD patients with and without cognitive impairment only weakly [10]. One study also validated the MoCA, identifying a cutoff of 23.5 points to be more suitable to detect functional cognitive impairment compared to the established value of 26 points, especially in patients with ESRD [11].
Graph theory provides a mathematical framework for modeling and analyzing complex systems [12ŌĆō14]. In neuroscience, graph theory has been utilized to examine the network-level structural and functional organization of the brain. In particular, graph theory can be used to display the brain as a network of nodes and edges, where nodes represent brain regions and edges represent their interconnections. This enables researchers to investigate how information is processed and integrated across different brain regions by analyzing the connectivity patterns of the brain. Graph theory metrics can be utilized to characterize various aspects of brain networks, including their topology, efficiency, and damage resistance. Overall, the application of graph theory to neuroscience has yielded valuable insights into the brainŌĆÖs complex organization and contributed to our understanding of its function in health and disease [12,13].
Recently, many studies have demonstrated a relationship between cognitive function and functional brain connectivity using the graph theory [15,16]. Several modalities have been used to investigate the functional connectivity of the brain. Resting-state functional magnetic resonance imaging (MRI) is most common, but other modalities such as electroencephalography (EEG), magnetic encephalography, and positron emission tomography also can be utilized [17ŌĆō19]. In addition, functional connectivity can be analyzed using functional near-infrared spectroscopy (fNIRS) [20]. This measures brain tissue concentrations of oxyhemoglobin (HbO2) and deoxyhemoglobin (HbR) and uses blood-oxygen-level-dependent signals to study brain function. The fNIRS does not emit radiation, is noninvasive, and does not harm the human body [21ŌĆō23]. Furthermore, it is fully portable and has the advantage of better temporal resolution than brain MRI and better spatial resolution than EEG [21ŌĆō23]. Moreover, since it is superior in measuring prefrontal functional connectivity, it is an appropriate tool for studying the brain network in patients with ESRD. However, no previous studies have investigated prefrontal functional connectivity in patients with ESRD using fNIRS [21ŌĆō23].
This study aimed to investigate differences in intrinsic prefrontal functional connectivity according to cognitive impairment in patients with ESRD using fNIRS. We hypothesized that there would be significant differences in intrinsic prefrontal functional connectivity between patients with ESRD with and without cognitive impairment.
Methods
This prospective study was approved by the Institutional Review Board of Inje University Haeundae Paik Hospital (No. 2022-06-004-003). The research process was explained to each patient and informed consent was obtained.
Participants: patients with end-stage renal disease
From June 2022 to September 2022, we enrolled 37 patients with ESRD who met the following criteria: 1) were clinically diagnosed with ESRD with a glomerular filtration rate less than 15 mL/min/1.73 m2 requiring renal replacement therapy [24], 2) currently on hemodialysis for more than 6 months, and 3) had no history of diagnosed neurological disorders, including dementia, mild cognitive impairment, stroke, or epilepsy. Laboratory tests also were performed on all patients.
Assessment of cognitive function in patients with end-stage renal disease with a Korean version of the MoCA test
All patients with ESRD underwent a Korean version of the MoCA test (MoCA-K) to assess their cognitive function (Supplementary Fig. 1, available online) [6]. The MoCA test consists of 30 questions and takes approximately 10 minutes to complete. Patients with ESRD were divided into two groups based on the total MoCA test score, with a cutoff value of 23.5 points [11]. Patients with ESRD who scored Ōēź23.5 points were defined as having normal cognitive function, whereas those with a score of <23.5 points were considered to have cognitive impairment [11].
Evaluation of intrinsic prefrontal functional connectivity in patients with end-stage renal disease with functional near-infrared spectroscopy
Fig. 1 shows the process of obtaining intrinsic prefrontal functional connectivity in ESRD patients. The NIRSIT Lite device (OBELAB Inc.) was used to acquire fNIRS data [25]. The NIRSIT Lite is a wearable, portable, and wireless fNIRS device that measures HbO2 and HbR based on the difference in the near-infrared light absorption rate in real time. Five sources, 13 detectors, and 15 channels were used to detect fNIRS signals in the prefrontal cortex [26]. The system employs two near-infrared wavelengths, 780 nm and 850 nm. The signals were sampled at a rate of 8,138 Hz. All fNIRS acquisitions were performed once before hemodialysis in the dialysis room for 300 seconds, while the patients looked at the tablet PC screen with a white cross on a black background to create the same environment.
The NIRSIT Lite Analysis Tool (version 3.2.4) program was used to process fNIRS data and generate a functional connectivity matrix. In the program, we loaded and selected patient information and examined the signal quality and signal-to-noise ratio. Only patients whose signal quality was suitable for analysis were included in this study. We utilized a band-pass filter with a low-pass cutoff frequency of 0.1 Hz and a high-pass cutoff frequency of 0.005 Hz. Each patientŌĆÖs fNIRS data were processed and exported, and a weighted connectivity matrix was generated for each patient using the Pearson correlation analysis. We then calculated the functional connectivity measures by applying graph theory using the BRAPH (brain analysis using graph theory) program [27] from the connectivity matrix, including the degree, strength, global efficiency, characteristic path length, mean clustering coefficient, and small-worldness index [12, 13].
Statistical analysis
We compared the differences in demographic and clinical characteristics, as well as intrinsic prefrontal functional connectivity measures between ESRD patients with and without cognitive impairment using Fisher exact test or the Mann-Whitney test. We used the area under the receiver operating characteristic (ROC) curve (AUC) to investigate the diagnostic predictive value for cognitive impairment with functional connectivity measures. Multivariate logistic regression was also used for analyzing functional connectivity measures in which there were independent variables that determine cognitive impairment in patients with ESRD. The functional connectivity measures were converted into categorical variables by dichotomizing them in accordance with the clear cutoff values with the highest sensitivity and specificity using AUC in the logistic regression analysis. Correlation analysis was conducted using Spearman test. All statistical analyses were conducted using MedCalc Statistical Software version 20.014 (MedCalc Software Ltd.; https://www.medcalc.org; 2021). Statistical p-values lower than 0.05 were considered statistically significant.
Results
Demographic and clinical characteristics in patients with end-stage renal disease
Of the 37 patients with ESRD, 23 (62.2%) had cognitive impairment, whereas 14 (37.8%) showed no cognitive impairment. The median MoCA-K score was 22 (Supplementary Fig. 2, available online). Table 1 shows the differences in the demographic and clinical characteristics of ESRD patients with and without cognitive impairment. There were no significant differences in the demographic data between the groups. However, serum albumin level and intra-dialysis diastolic blood pressure were lower, whereas the low-density lipoprotein level was higher in ESRD patients with cognitive impairment than in those without cognitive impairment.
Intrinsic prefrontal functional connectivity in patients with end-stage renal disease
Table 2 reveals the differences in intrinsic prefrontal functional connectivity between patients with ESRD with and without cognitive impairment. There were significant differences in intrinsic prefrontal functional connectivity between the two groups. The network measures of the strength, global efficiency, and mean clustering coefficient were lower in ESRD patients with cognitive impairment than in those without cognitive impairment (4.458 vs. 5.129, p = 0.02; 0.397 vs. 0.437, p = 0.03; 0.316 vs. 0.421, p = 0.003; respectively). However, the other network measures, including the degree, characteristic path length, and small-worldness index did not vary between ESRD patients with and without cognitive impairment (10.266 vs. 11.066, p = 0.36; 3.182 vs. 2.943, p = 0.16; 0.917 vs. 0.950, p = 0.05; respectively).
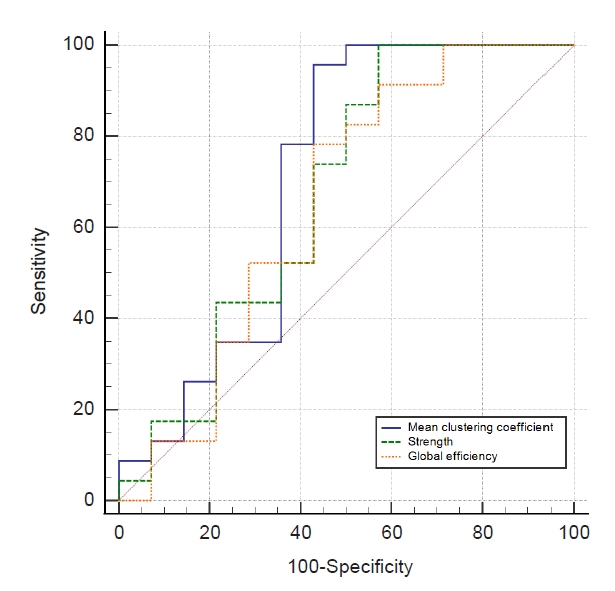
Fig. 2 shows the comparison of ROC curves with functional connectivity measures, including the strength (AUC of 0.671), global efficiency (AUC of 0.649), and mean clustering coefficient (AUC of 0.708). The multivariate logistic regression showed that the serum albumin level and mean clustering coefficient were the independent variables that determined the cognitive impairment in patients with ESRD (p = 0.03 and p = 0.048, respectively) (Table 3).
Correlation between cognitive function and clinical characteristics in patients with end-stage renal disease
There were no significant correlations between MoCA-K scores and clinical characteristics in patients with ESRD, including dialysis duration, body mass index, dialyzer clearance time/urea distribution volume, ultrafiltration volume, hemoglobin, iron, ferritin, total iron binding capacity, transferrin saturation, albumin, ╬▓2-microglobulin, total cholesterol, triglyceride, high-density lipoprotein, low-density lipoprotein, calcium, phosphate, parathyroid hormone, and C-reactive protein (Table 4).
Discussion
We confirmed the feasibility of using fNIRS to investigate intrinsic prefrontal functional connectivity in patients with ESRD. We also demonstrated significant differences in measures of intrinsic prefrontal functional connectivity between ESRD patients with and without cognitive impairment. Network measures of strength, global efficiency, and mean clustering coefficient were lower in ESRD patients with cognitive impairment than in those without cognitive impairment. Of these network measures, the mean clustering coefficient was the only functional connectivity measure that could determine cognitive impairment in patients with ESRD.
In this study, we found that approximately 62% of patients with ESRD had cognitive impairment despite not having a previous diagnosis of cognitive impairment, including dementia, and being able to participate in normal daily activities. The prevalence of cognitive impairment in patients with ESRD is approximately three times higher than in the age-matched general population [28]; among patients with ESRD, the elderly, women, non-white patients, and those receiving hemodialysis are more susceptible to cognitive impairment [29]. Although the exact pathomechanism for cognitive impairment in patients with ESRD remains unclear, many factors can contribute to impairment of cognitive function, such as anemia, albuminuria, uremic solutes, inflammation, oxidative stress, and intradialytic hypotension, which is related to ESRD treatment [30]. In addition, cerebrovascular disease can play a pivotal role in cognitive impairment in patients with ESRD. A previous study reported that brain MRI in patients with ESRD showed a considerable burden of large vessel stroke, small vessel lacunes, and white matter changes, even without a history of stroke [31]. Furthermore, we recently found that patients with ESRD, as well as those with early chronic kidney disease, had glymphatic system dysfunction, which was demonstrated by diffusion tensor imaging [32,33]. The glymphatic system is a functional glial-dependent system that acts as a scavenger to discharge accumulated waste from the brain, especially during sleep, contributing to improved cognitive functioning. The function of the glymphatic system is reduced in patients with Alzheimer disease [34]. All of these factors can cause cognitive impairment in patients with ESRD, as confirmed in the present study. When we took the cutoff value of MoCA for cognitive impairment as 26 points, approximately 85% of patients with ESRD had cognitive impairment in this study, which was higher than initially expected. This was probably because cognitive function was evaluated using the MoCA. A previous report demonstrated that particularly in elderly patients, the evaluation with the MoCA test was too sensitive in assessing cognitive impairment, and another study also reported that a cutoff value of 26 points was too high to define subjects with normal cognition, especially in the ESRD patient group [10,11]. Thus, in this study, patients with ESRD were divided into patients with and without cognitive impairment using a MoCA score cutoff value of 23.5 points based on previous literature [11].
By applying graph theory to fNIRS data [35], we found that strength, global efficiency, and mean clustering coefficient were lower in ESRD patients with cognitive impairment than in those without cognitive impairment. The degree is the number of edges attached to the nodes, and the weights of these edges indicate the strength [12,13]. Therefore, these results show that ESRD patients with cognitive impairment have fewer edges at the nodes, which means that the connectivity of the brain network is decreased overall. Global efficiency is a graph theory metric that measures the speed with which data can be transferred across a network. Specifically, it quantifies the average length of the shortest inverse path between every pair of network nodes. A greater global efficiency indicates that information can be transmitted quickly and efficiently across the network, enabling more efficient communication between various brain regions, which is related to network integration [12,13]. Integration is the act of bringing together smaller components into a single system that functions as one, which is related to the transfer efficiency of the brain as a whole. Previous studies demonstrated a significant relationship between the cognitive ability and global efficiency of the resting functional network and suggested that high integration underlies performance on tasks with a heavy cognitive load [36]. The authors argued that greater global integration facilitates general cognitive ability, while greater segregation is associated with improved crystallized intelligence, processing speed, and memory benefits from the tendency toward equilibrium [36]. A previous study applying graph theory to EEG data also demonstrated increased characteristic path length in patients with Alzheimer disease [37]. Furthermore, in our previous study, 40 patients with ESRD underwent resting-state functional MRI, and functional connectivity measures were calculated by applying graph theory; the patients exhibited decreased integration of brain network compared to healthy controls, which was consistent with our findings in the current study [3]. Based on the present study, we suggest that cognitive impairment in patients with ESRD is considered a symptom that affects synaptic transmission with an overall functional disconnection, which could be analyzed using a network approach. The clustering coefficient of a node is the proportion of neighboring pairs that are also neighbors. In other words, it measures the degree of connectivity between a nodeŌĆÖs neighbors. A high clustering coefficient indicates that the graphŌĆÖs nodes tend to form dense clusters, whereas a low clustering coefficient indicates that the nodes are more loosely connected, which is related to network segregation [12ŌĆō14]. Thus, decreased global efficiency and mean clustering coefficient in ESRD patients with cognitive impairment indicated that they had a brain network with decreased segregation and integration. In our study, when age and other functional connectivity measures were corrected by logistic regression, only the mean clustering coefficient was found to be a factor predicting cognitive impairment in patients with ESRD. Although there was no difference between the two groups, the characteristic path length is defined as the average number of edges in the shortest paths between all nodes, which is related to the integration of the global brain network [12ŌĆō14]. Small-worldness is a concept in graph theory that describes the equilibrium between local clustering and global connectivity in a network. A small-world network is characterized by a high degree of local clustering and a short average path length. The small-worldness index quantifies the small-world properties of a network and is typically defined as the ratio of normalized clustering coefficient to normalized average path length [12ŌĆō14].
We used fNIRS to investigate functional connectivity in patients with ESRD because it is inexpensive, portable, simple to set up, and radiation-free, making it a safe method [23]. In addition, it has relatively high spatial and temporal resolutions compared to other modalities. It is used to track changes in the activation energy of the superficial layers of the cortex by assessing HbO2 and HbR [38]. In this study, among the various fNIRS devices, we selected the NIRSIT Lite device. Although it can only observe the frontal cortex, patients with ESRD usually have frontal lobe dysfunction, and it is easy to scan without being affected by hair [1,39]. During this study, we were able to confirm that analyzing intrinsic prefrontal functional connectivity using fNIRS was particularly useful for patients with ESRD. Previous studies using fNIRS also showed the significant association between intrinsic prefrontal functional connectivity and cognitive function in various disorders, including traumatic brain injury [40], multiple sclerosis [41], and affective disorders [42], consistent with the findings of our study.
This study had some limitations. First, the sample size was small, especially in the group of patients without cognitive impairment. However, we only enrolled patients with ESRD who had not previously been diagnosed with any psychiatric or neurological disease, and when using the MoCA test, it was more difficult to find patients without cognitive impairment than we initially expected. Second, we only observed intrinsic prefrontal functional connectivity and did not investigate the whole-brain network. However, focusing on intrinsic prefrontal functional connectivity was one of the strengths of this study and is what separates it from previous studies. Third, to maintain the same environment, we obtained fNIRS data for all patients with ESRD before starting hemodialysis. However, it was difficult to rule out the possibility that the dialysis room environment affected the fNIRS results. Lastly, since this was a single-center study, multicenter studies with larger sample sizes should be conducted to confirm our results.
Using fNIRS, we demonstrated a significant association between cognitive function and intrinsic prefrontal functional connectivity in patients with ESRD. ESRD patients with cognitive impairment have reduced connectivity and segregation in the prefrontal brain network compared to those without cognitive impairment.

 PDF Links
 PubReader
 ePub Link
 Full text via DOI
 Download Citation
 Supplement figure 1
 Print
Print


")


