Kidney Res Clin Pract > Volume 38(2); 2019 > Article
Min, Sung, Lee, and Lee: Sub-morbid dehydration-associated glomerular hyperfiltration: An emerging reality?

Abstract

Background

Severe dehydration decreases renal perfusion. However, it is unclear whether sub-morbid dehydration affects kidney function similarly. Although there have been numerous animal and human studies that have suggested mild dehydration is associated with glomerular hyperfiltration, it has not been confirmed on a large-scale in the general population. Therefore, we aimed to identify the relationship between hydration status and kidney function.

Methods

We reviewed the data of 28,342 adults who participated in the Korea National Health and Nutrition Examination Surveys. Urine specific gravity unit (SGU) was the primary variable that indicated hydration status, and the estimated glomerular filtration rate (eGFR) was used as the primary outcome.

Results

Multivariate linear regression analysis showed urine SGU was positively associated with eGFR, which was J-shaped in the multivariate generalized additive model plot. In the penalized spline curve analysis, the odds ratio for high eGFR was steadily increased. Although increased urine SGU was associated with decreased blood pressure and pulse rate, it had no effect on increased fasting glucose and total cholesterol, suggesting conflicting cardio-metabolic dehydration effects.

Conclusion

Dehydration, presumably sub-morbid in an ambulatory community-dwelling general population, is associated with higher kidney function. The clinical significance of sub-morbid dehydration-associated glomerular hyperfiltration needs further investigation.

Introduction

Chronic kidney disease (CKD) is a common chronic condition that is considered a risk factor for development of cardiovascular disease [1,2]. To prevent development of CKD, various risk factors, including hypertension and diabetes, must be controlled. When controlling these risk factors, several medications are needed, which have potential side effects and contribute to increased socioeconomic burden [35]. Therefore, other modifiable risk factors must be identified.
Hydration status is defined as the balance between water input and output [6]. Excess output or insufficient input of water causes dehydration. Generally, dehydration is thought to have harmful renal effects, causing acute kidney injury [7,8] or chronic kidney damage [911]. However, if dehydration is mild and persistent, the effect of dehydration on kidney function is complicated. To date, there has been substantial evidence demonstrating that mild dehydration causes renal hyperfiltration, as shown in high protein intake cases [12]. Although the exact mechanisms have not been fully elucidated, recent studies have suggested that increased vasopressin in dehydrated individuals may play a central role in dehydration-associated hyperfiltration [13].
Improving hydration status and reducing vasopressin and associated hyperfiltration may be a good strategy for controlling CKD [13]. Although several studies have attempted to demonstrate the benefits of improving hydration and reducing risk related to CKD [1420], the results were inconsistent and therefore not conclusive. One limitation of previous studies was that they mostly used water intake for hydration status. Water intake is a poor hydration marker since it does not measure output. It is necessary to measure both water intake and output simultaneously to obtain a precise hydration marker and to appropriately reflect hydration status. In this regard, urine specific gravity may be a more suitable hydration marker, particularly in a large population study [6]. Although there have been many animal and human studies in regards to dehydration-associated hyperfiltration, it has never been assessed at a population level. Therefore, we used data from the Korea National Health and Nutrition Examination Survey (KNHANES) to identify the relationship between hydration status and kidney function in a large-scale ambulatory sample of community-dwelling Korean adults.

Methods

Participants

Since 1998, KNHAHES has been performed periodically to assess the health and nutritional status of the civilian, non-institutionalized Korean population. The population subject to the KNHANES includes citizens of the Republic of Korea and excludes nursing home residents, servicepersons, prisoners, and foreigners. Participants were selected using proportional allocation systematic sampling with multistage stratification. Details of the sample design can be found elsewhere [21]. This study used data from KNHANES 2008 to 2011 and 2014 to 2015. Of the 65,983 candidates, 52,683 agreed to participate in KNHANES 2008 to 2011 and 2014 to 2015 (participation rate of 79.7%). The protocol was comprised of a health-questionnaire survey, health examination, and nutrition survey. The nutrition survey was conducted by visiting the subject’s house. Health questionnaire surveys and health examinations were conducted using mobile examination vehicles. The study protocol was in accordance with the Declaration of Helsinki. The Institutional Review Board of the Korea Centers for Disease Control approved the study (IRB numbers: 2008-04EXP-01-C, 2009-01CON-03-2C, 2010-02CON-21-C, 2011-02CON-06-C, and 2013-12-EXP-03-5C). Written informed consent was obtained from all subjects. Of the 52,683 participants, 24,341 were excluded. Excluded participants consisted of 1,778 participants assessed in a different central laboratory, 12,417 age < 20 years, 4,653 missing a urine specific gravity test, 1,033 missing blood urea nitrogen and creatinine tests, and 4,460 missing urine sodium and creatinine tests. In total, 28,342 participants were included in the final analysis (Supplementary Fig. 1).

Data collection and measurements

Standardized interviews were conducted in participant houses in order to collect information on demographic variables, medical history, medication use, and a variety of other health-related variables. Blood pressure (BP) was measured three times in accordance with a standard protocol, and the mean value of the three measurements was used as the representative BP. Height was measured to the nearest 0.1 cm using a portable stadiometer (Seriter, Bismarck, USA). Weight was measured to the nearest 0.1 kg using a Giant-150N calibrated balance-beam scale (Hana, Seoul, Korea). Body mass index was calculated by dividing the weight of the participant by the height squared (kg/m2). Waist circumference was measured with a tape measure (Seca 200; Seca, Hamburg, Germany) to the nearest 0.1 cm at the midpoint between the lower border of the rib cage and the highest point of the iliac crest. Fasting blood samples and spot urine samples collected from each participant were processed, refrigerated immediately, and transported in cold storage to a central laboratory (Neodin Medical Institute, Seoul, Korea). Total cholesterol, fasting blood glucose, blood urea nitrogen, serum and urinary creatinine, and urinary sodium levels were measured using the Hitachi Automatic Analyzer 7600 (Hitachi, Tokyo, Japan). Urine specific gravity and protein were measured by a dipstick method using the UriSys 2400 analyzer (Roche, Mannheim, Germany). The estimated glomerular filtration rate (eGFR) was calculated using the Chronic Kidney Disease Epidemiology Collaboration equation [22].

Definitions

Hypertension was defined as systolic BP ≥ 140 mmHg, diastolic BP ≥ 90 mmHg, treatment with anti-hypertensive drugs, or previous diagnosis by a physician. Diabetes was defined as fasting plasma glucose ≥ 6.94 mmol/L, any treatments with insulin or oral anti-diabetic drugs, or previous diagnosis by a physician. Dyslipidemia was defined as total cholesterol ≥ 6.22 mmol/L, treatment with dyslipidemic drugs, or previous diagnosis by a physician. Cardiovascular disease was defined as cerebrovascular attack or coronary artery disease. A frequent drinker was defined as an individual who consumed alcoholic beverages two or more times a week. Regular walking was defined as the highest quartile of weekly walking time (≥ 7 hours/week). High water intake was defined as the highest quartile of daily water intake (≥ 1.2 L/day). High eGFR was defined as a median value of 95.24 mL/min/1.73 m2 or more. Urine specific gravity unit (SGU) was calculated using the following equation: SGU = (urine specific gravity − 1.0) × 100 [23]. Proteinuria was defined as protein level ≥ 1+ on a dipstick urinalysis test.

Statistical analysis

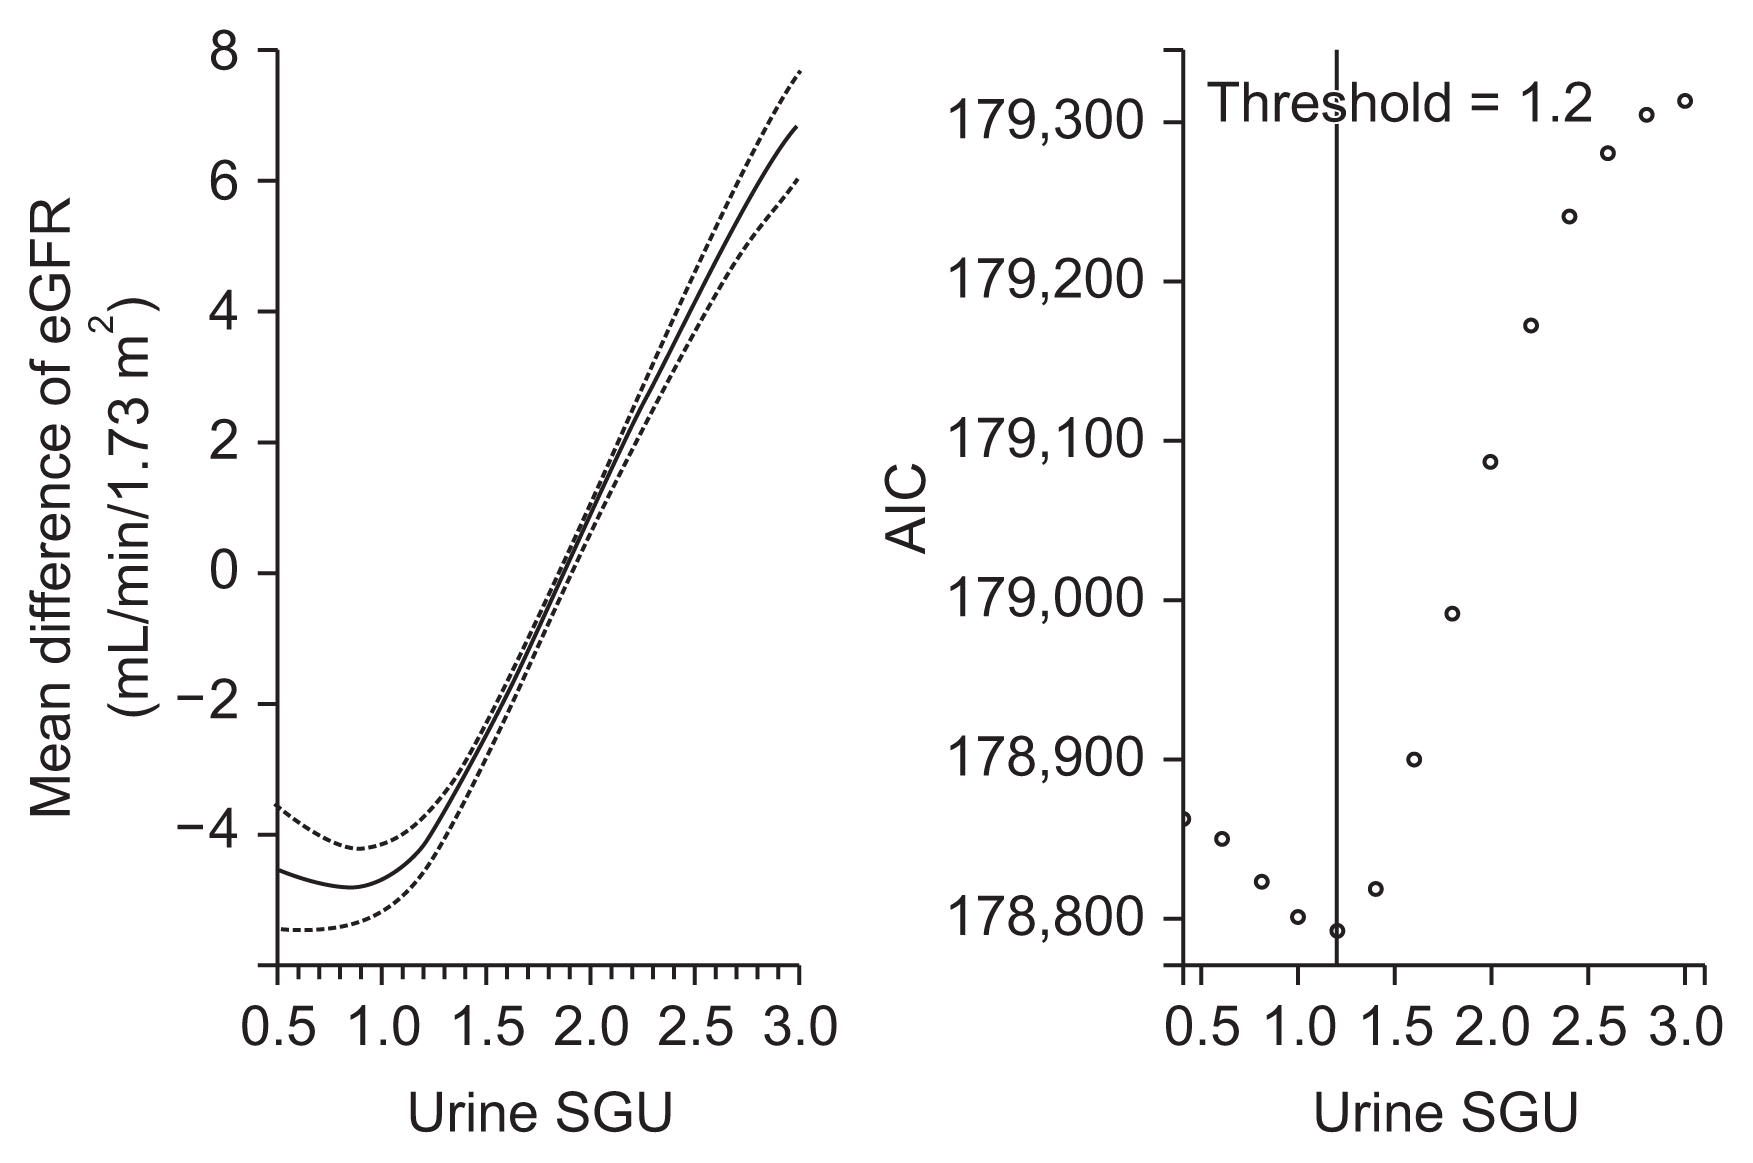
Continuous and categorical variables were expressed as mean ± standard deviation (SD) and percentages, respectively. A P value was assessed using a one-way analysis of variance (ANOVA) for continuous variables and a linear-by-linear association for categorical variables. Differences between multiple groups were analyzed using Bonferroni post-hoc analysis for continuous variables and the chi-squared test for categorical variables. The association between urine SGU and eGFR was analyzed via linear regression analysis. The relationship between urine SGU and high eGFR was investigated via logistic regression analysis. In the multivariate analysis, covariates were chosen based on clinical and statistical relevance. For potential non-linear associations between urine SGU and eGFR, the generalized additive model (GAM) for Gaussian distributions was adapted in order to visualize the association between urine SGU and eGFR after adjusting for the same variables used in the multivariate linear regression analysis. We used Akaike’s information criterion (AIC) as the primary measure of model fit [24]. In the AIC analysis, lower scores within the data set indicated a better model fit, and a urine SGU with the lowest AIC value was assumed to be the threshold value. A P value less than 0.05 was considered statistically significant. The relationship between urine SGU and high eGFR was plotted with the penalized smoothing spline method, using the “pspline” package in R statistical software version 3.0.3 (R Foundation for Statistical Computing, Vienna, Austria). All analyses, unless otherwise specified, were performed using SPSS version 22 (IBM Corp., Armonk, USA).

Results

The baseline characteristics of the study participants according to urine SGU quartiles are shown in Table 1. The median eGFR, proportion of men, and the numbers of current and frequent alcohol drinkers increased as the urine SGU quartile increased. On the other hand, participant age, prevalence of hypertension, diabetes, dyslipidemia, and cardiovascular disease decreased as the urine SGU quartile increased. Proteinuria was positively associated with urine SGU quartile. The mean and SD of eGFR and USG were 94.6 ± 294.6 mL/min/1.73 m2 (range, 3.3–146.9 mL/min/1.73 m2; interquartile range [IQR], 22) and 1.018 ± 0.000 (range, 1.000–1.048; IQR, 0.008), respectively.
The association between urine SGU and eGFR was explored (Table 2). Univariate linear regression analysis showed eGFR significantly increased as urine SGU increased. In the multivariate linear regression analysis adjusted for variables related to eGFR in the univariate analysis, urine SGU was still positively associated with eGFR. To identify a possible non-linear relationship, we performed a multivariate GAM plot and identified a J-shaped association between urine SGU and eGFR with the lowest AIC observed when the urine SGU was 1.2 (Fig. 1).
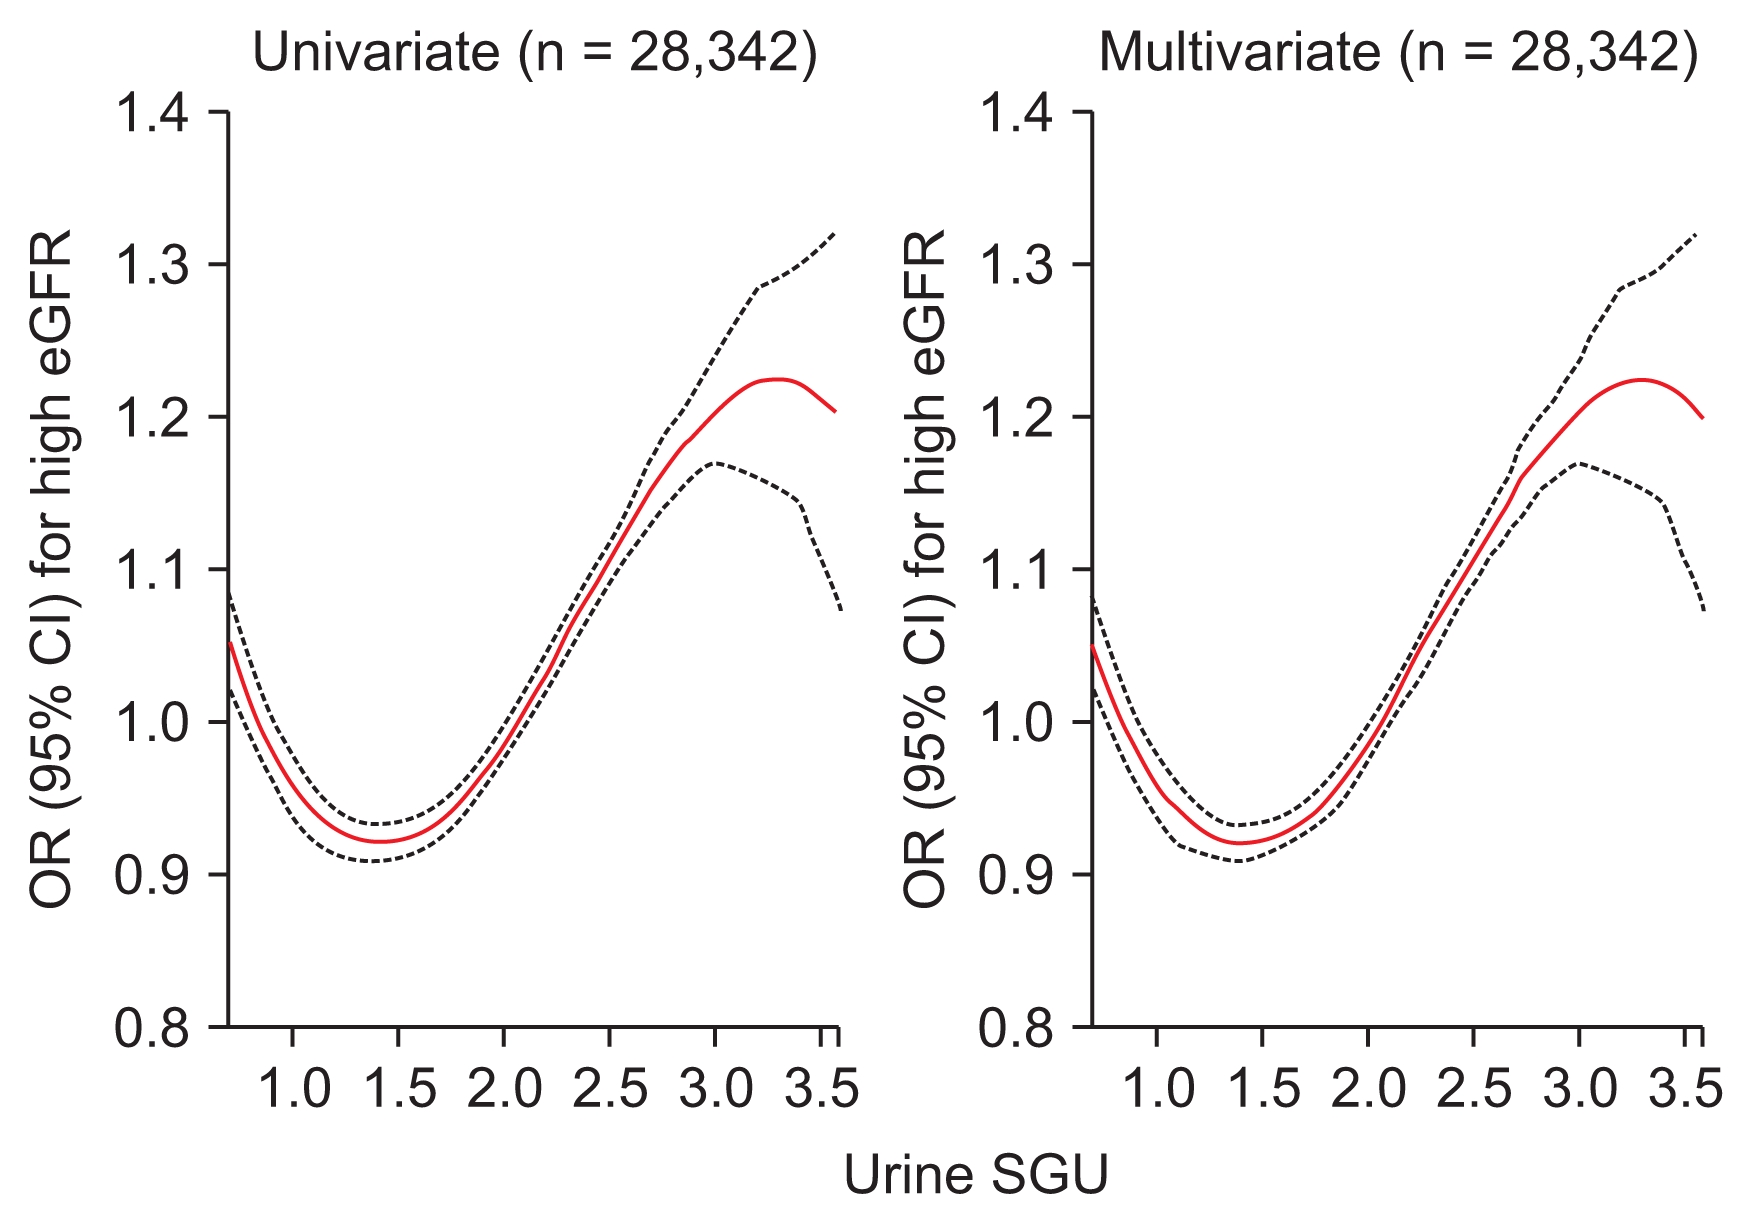
We analyzed the association between urine SGU and high eGFR. The odds ratio (OR) and 95% confidence interval (CI) for a 1 unit increase in urine SGU for high eGFR was 1.432 (1.376–1.491, P < 0.001) using univariate logistic regression analysis. Multivariate analysis adjusted for age, sex, systolic and diastolic BP, pulse rate, diabetes, dyslipidemia, cardiovascular disease, waist circumference, proteinuria, smoking and alcohol drinking habits, urine sodium and creatinine, and high water intake showed the OR (95% CI) per 1 unit increase of urine SGU for high eGFR was 2.570 (2.289–2.886, P < 0.001). We also performed subgroup analysis and observed the same results regardless of gender, age, water intake, diabetes, and hypertension (Supplementary Fig. 2). As the SGU quartile increased, the OR for high eGFR increased (Fig. 2). In the penalized spline curve analysis, we identified a relationship between urine SGU and high eGFR. As a result, the OR for high eGFR steadily increased as the urine SGU quartile increased (Fig. 3). We analyzed the factors associated with the highest urine SGU quartile using multivariate logistic regression analysis (Supplementary Table 1). Futher details on Supplementary materials are presented online (available at: https://doi.org/10.23876/j.krcp.18.0147).
We explored the cardio-metabolic effect of urine SGU (Table 3). Increased urine SGU was independently associated with decreased systolic and diastolic BP and pulse rate. Although increased urine SGU was associated with decreased waist circumference, it was independently associated with increased fasting glucose and total cholesterol levels.

Discussion

It is known that severe dehydration can cause pre-renal acute kidney injury. Profound and prolonged dehydration can also contribute to increased risk of CKD [11]. Paradoxically, mild and sub-morbid dehydration causes hyperfiltration, which has been associated with increased vasopressin levels [13]. Thus, as a rationale for a low protein diet [25], improving hydration status aims not only to increase renal perfusion but also to limit dehydration-associated hyperfiltration. In this regard, improving hydration status may be another modifiable factor to control CKD and should be studied further. Until recently, there have been several studies [1420] that have investigated the effect of improving hydration status on CKD progression. However, the results have been inconsistent and no significant benefit of improving hydration status has been demonstrated. This may be due to previous studies [1417,19,20] using water intake only, which would not reflect actual hydration status since water output was not been considered. Since urine specific gravity is an easy and reliable hydration marker, especially in a large population [6], we conducted the current study to identify the relationship between urine SGU, a unit derived from urine specific gravity, and eGFR in a large-scale sample of ambulatory community-dwelling Korean adults.
In this study, increased urine SGU was associated with increased eGFR. This was independent of several confounders in the multivariate linear regression analysis, which included demographics, comorbidities, and behavioral patterns. In addition, we identified a J-shaped association between urine SGU and eGFR, with a definite threshold value of 1.2 (specific gravity of 1.012), in the multivariate GAMs plot. Since the study only included ambulatory community-dwelling adults, it was reasonable to classify dehydration in this population as sub-morbid dehydration. To our knowledge, this was the first study to demonstrate that hyperfiltration was associated with sub-morbid dehydration in a population-based data set.
In the current analysis, increased urine SGU quartile was associated with increased OR for high eGFR. Penalized spline curve analysis shows a nonlinear relationship between urine SGU and the OR for high eGFR. As a result, the odds for high eGFR steadily increased as urine SGU increased. Interestingly, the results were consistent with the results of Anastasio et al [26]. In their study, participants with high hydration showed an inverse relationship between urine osmolality and inulin clearance (r = −0.237). On the other hand, increased urine osmolality was positively associated with inulin clearance (r = 0.703) in participants with low hydration [26].
To date, the clinical meaning of dehydration-associated hyperfiltration is uncertain. In this study, increased SGU was associated with increased fasting glucose and total cholesterol, which is similar to the metabolic risk of copeptin. Copeptin is derived from the arginine vasopressin precursor and is a marker of vasopressin, which is positively correlated with insulin resistance, obesity, metabolic syndrome, and diabetes mellitus [2732]. Increased copeptin has a deleterious effect in individuals who have conditions such as diabetic nephropathy and salt-sensitive hypertension [12]. Therefore, we postulated that dehydration-associated hyperfiltration may have a detrimental renal effect and should be treated meticulously to reduce CKD-associated risks, for instance high protein intake-associated hyperfiltration [25,33,34].
The present study has several limitations. First, a causal relationship could not be accurately identified, and since this is a cross-sectional study, the results need to be interpreted cautiously. However, while this was a cross-sectional study, new hypotheses can be made. The study was based on a large-scale general population, and due to the participant number, we found potential beneficial cardiovascular effects (decreased BP and pulse rate) for sub-morbid dehydration. Therefore, future prospective interventional studies are needed to determine whether the cardiovascular effect of sub-morbid dehydration is beneficial. Second, other hydration indices, such as the results of a bioimpedance analysis, were not used. In addition, other biomarkers, such including copeptin or uric acid, could not be analyzed since KNHANES was not primarily designed to identify the association between hydration status and kidney function. Even after 8 hours of fasting, we only obtained a measure of urine specific gravity, which is a limitation of this study. Finally, the generalizability of the results is limited because the study was conducted within a single country with a single ethnic population.
In conclusion, sub-morbid dehydration was associated with higher kidney function. Future studies are needed to confirm our study results and to identify the clinical meaning of dehydration-associated hyperfiltration.

Supplementary Information

Notes

Conflicts of interest

All authors have no conflicts of interest to declare.

Authors’ contributions

Hyang Ki Min and Sung Woo Lee participated in the research ideation, study design, and drafting the article. Su Ah Sung and So Young Lee participated in the data analysis/interpretation and statistical analysis. So Young Lee and Sung Woo Lee participated in the supervision or mentorship. All authors read and approved the final manuscript.

Figure 1

GAM plot between urine SGU and eGFR

Upper (≥ 3.0) and lower (< 0.5) one percent of urine SGU were truncated. The dashed line indicates 95% confidence intervals for the smoothed eGFR values using the multivariate GAM analysis adjusted for age, sex, systolic and diastolic blood pressure, pulse rate, diabetes, dyslipidemia, cardiovascular disease, waist circumference, proteinuria, smoking and alcohol drinking habits, urine sodium and creatinine, and high water intake.
AIC, Akaike’s information criterion; eGFR, estimated glomerular filtration rate; GAM, generalized additive model; SGU, specific gravity unit.
krcp-38-196f1.jpg
Figure 2

Odds ratio (OR) of urine SGU quartiles for high eGFR

Black bar graphs represent the percentage of patient with low eGFR. Red square dots represent OR and red bars represent the 95% confidence interval (CI) using multivariate logistic analysis adjusted for age, sex, systolic and diastolic blood pressure, pulse rate, diabetes, dyslipidemia, cardiovascular disease, waist circumference, proteinuria, smoking and alcohol drinking habits, urine sodium and creatinine, and high water intake.
eGFR, estimated glomerular filtration rate; Ref., reference; SGU, specific gravity unit.
krcp-38-196f2.jpg
Figure 3

Penalized smoothing splines showing the relationship between urine SGU and high eGFR

Upper (≥ 3.0) and lower one percent (< 0.5) of urine SGU were truncated. The red line indicates the odds ratio (OR) and the black dotted line indicates the 95% confidence interval (CI) for the urine SGU that influences high eGFR. OR and 95% CI were analyzed using logistic regression analysis. In multivariate analysis, covariates were age, sex, systolic and diastolic blood pressure, pulse rate, diabetes, dyslipidemia, cardiovascular disease, waist circumference, proteinuria, smoking and alcohol drinking habits, urine sodium and creatinine, and high water intake.
eGFR, estimated glomerular filtration rate; SGU, specific gravity unit.
krcp-38-196f3.jpg
Table 1
Baseline characteristics of the study population according to urine SGU quartile status
Characteristic Quartile of urine SGU P-trend

< 1.4 (n = 5,261) 1.4 to 1.8 (n = 6,355) 1.8 to 2.2 (n = 6,988) ≥2.2 (n = 9,738)
Age (yr) 53.8 ± 15.5 55.1 ± 15.5a 52.1 ± 15.4a,b 44.9 ± 15.4a,b,c < 0.001
Sex, male (%) 29.9 40.4a 48.1a,b 54.6a,b,c < 0.001
Current smoker (%) 15.2 17.1a 22.3a,b 26.9a,b,c < 0.001
Frequent drinker (%) 16.0 19.5a 25.2a,b 24.9a,b < 0.001
Regular walking (%) 27.0 26.6 26.5 27.0 0.820
Hypertension (%) 38.0 40.6a 34.4a,b 26.1a,b,c < 0.001
Diabetes (%) 12.6 13.3 10.3a,b 9.9a,b < 0.001
Dyslipidemia (%) 20.8 21.4 19.1a,b 15.8a,b,c < 0.001
Cardiovascular disease (%) 5.0 5.6 4.7b 2.8a,b,c < 0.001
BMI (kg/m2) 23.5 ± 3.2 23.8 ± 3.3a 23.8 ± 3.4a 23.9 ± 3.5a 0.008
Waist circumference (cm) 80.8 ± 9.5 82.0 ± 9.7a 82.1 ± 9.8a 81.8 ± 10.3a 0.025
Systolic BP (mmHg) 122.3 ± 18.9 123.0 ± 18.6 120.7 ± 16.8a,b 117.1 ± 15.5a,b,c < 0.001
Diastolic BP (mmHg) 76.2 ± 10.7 76.8 ± 10.7 76.8 ± 10.4 76.3 ± 10.3 0.608
Pulse rate (counts/min) 69.9 ± 9.2 69.9 ± 9.3 70.1 ± 9.3 70.4 ± 9.8 0.002
Fasting glucose (mmol/L) 5.44 ± 1.11 5.50 ± 1.12 5.46 ± 1.11 5.54 ± 1.60a,c < 0.001
Total cholesterol (mmol/L) 4.90 ± 0.93 4.91 ± 0.94 4.93 ± 0.93 4.88 ± 0.93c 0.488
eGFR (mL/min/1.73 m2) 92.9 ± 18.2 91.0 ± 17.9a 93.7 ± 16.3b 98.4 ± 15.9a,b,c < 0.001
 ≥ 90 (%) 60.3 55.0a 61.3b 70.9a,b,c < 0.001
 60–90 (%) 34.7 39.5a 35.7b 27.8a,b,c < 0.001
 30–60 (%) 4.4 5.2a 2.9a,b 1.3a,b,c < 0.001
 < 30 (%) 0.6 0.3a 0.1a,b 0.0a,b,c < 0.001
BUN (mmol/L) 4.7 ± 1.8 5.1 ± 1.5a 5.2 ± 1.5a,b 5.5 ± 1.5a,b,c < 0.001
Serum creatinine (μmol/L) 71.2 ± 30.5 73.4 ± 23.3a 73.4 ± 16.4a 74.5 ± 15.3a,b,c < 0.001
Urine SGU 1.0 ± 0.2 1.5 ± 0.1a 1.9 ± 0.1a,b 2.5 ± 0.3a,b,c < 0.001
Urine sodium (mmol/L) 81.1 ± 36.3 123.3 ± 42.6a 140.0 ± 48.6a,b 137.7 ± 51.9a,b < 0.001
Urine creatinine (mmol/L) 5.1 ± 2.1 9.0 ± 2.9a 13.0 ± 4.0a,b 19.6 ± 6.9a,b,c < 0.001
Urine sodium to creatinine 18.7 ± 11.9 15.7 ± 8.7a 12.3 ± 7.3a,b 8.3 ± 5.1a,b,c < 0.001
High water intake (%) 34.4 29.6a 27.6a 27.9a,b < 0.001
Proteinuria (%) 0.7 1.4a 1.1a,b 1.4a 0.002

Data are presented as mean ± standard deviation for continuous variables and a percentage for categorical variables.

Conversion factor from conversional unit to SI unit was in × 0.0555 in glucose, × 0.0259 in cholesterol, × 0.357 in BUN, and × 88.4 in serum and urine creatinine, respectively.

BMI, body mass index; BP, blood pressure; BUN, blood urea nitrogen; eGFR, estimated glomerular filtration rate; SGU, specific gravity unit.

P value was analyzed by the linear-term of a one-way ANOVA for continuous variables and a linear-by-linear association for categorical variables.

a, b, and c are defined as P = 0.008 when compared to the < 1.4, 1.4 to 1.8, and 1.8 to 2.2 groups, respectively, with a Bonferroni post-hoc analysis of one-way ANOVA for continuous variables and a chi-squared test for categorical variables.

Table 2
Factors associated with estimated glomerular filtration rate
Factor Univariate Multivariate


Beta (95% CI) P value Beta (95% CI) P value
Urine SGU (per 1 unit increase) 4.169 (3.838 to 4.505) < 0.001 5.334 (4.866 to 5.802) < 0.001
Age (per 1 yr increase) −0.757 (−0.766 to −0.749) < 0.001 −0.776 (−0.788 to −0.764) < 0.001
Male (yes vs. no) −5.095 (−5.492 to −4.698) < 0.001 −4.636 (−5.009 to −4.264) < 0.001
Hypertension (yes vs.no) −13.202 (−13.922 to −13.128) < 0.001
Systolic BP (per 1 mmHg increase) −0.341 (−0.352 to −0.330) < 0.001 0.024 (0.011 to 0.038) 0.169
Diastolic BP (per 1 mmHg increase) −0.163 (−0.182 to −0.144) < 0.001 −0.053 (−0.074 to −0.033) < 0.001
Diabetes (yes vs. no) −11.574 (−12.198 to −10.949) < 0.001 −1.595 (−2.097 to −1.093) < 0.001
Dyslipidemia (yes vs. no) −8.040 (−8.549 to−7.532) < 0.001 −1.233 (−1.622 to −0.843) < 0.001
Waist circumference (per 1 cm increase) −0.435 (−0.4545 to −0.415) < 0.001 −0.062 (−0.079 to −0.046) < 0.001
Proteinuria (yes vs. no) −16.056 (−17.877 to −14.235) < 0.001 −9.030 (−10.383 to −7.678) < 0.001
Cardiovascular disease (yes vs. no) −17.105 (−18.083 to −16.128) < 0.001 −3.266 (−4.001 to −2.531) < 0.001
Pulse rate (per 1 count/min increase) 0.174 (0.152 to 0.195) < 0.001 0.057 (0.041 to 0.072) < 0.001
Current smoker (yes vs. no) 2.306 (1.816 to 2.796) < 0.001 1.274 (0.858 to 1.689) < 0.001
Frequent drinker (yes vs. no) 0.627 (0.142 to 1.113) 0.011 2.265 (1.878 to 2.653) < 0.001
Urine sodium (per 1 mmol/L increase) 0.011 (0.007 to 0.015) < 0.001 0.007 (0.004 to 0.011) < 0.001
Urine creatinine (per 1 mmol/L increase) 0.263 (0.236 to 0.290) < 0.001 −0.614 (−0.652 to −0.577) < 0.001
High water intake (yes vs. no) 2.118 (1.650 to 2.586) < 0.001 0.546 (0.217 to 0.874) < 0.001

Beta and 95% confidence interval (CI) were analyzed by linear regression analysis. In the multivariate analysis, all of the statistically and clinically significant variables above were used as covariates.

BP, blood pressure; SGU, specific gravity unit; –, not included in the model.

Table 3
Association between urine SGU and cardio-metabolic derangements
Variable Per 1 unit increase of urine SGU

Beta (95% CI) P value
Systolic BP −1.859 (−2.327 to −1.392) < 0.001
Diastolic BP −1.859 (−2.327 to −1.392) < 0.001
Pulse rate −0.888 (−1.292 to −0.484) < 0.001
Waist circumference −0.481 (−0.856 to −0.106) 0.012
Fasting glucose 1.255 (1.208 to 1.302) < 0.001
Total cholesterol 0.103 (0.065 to 0.142) < 0.001

Beta and 95% confidence interval (CI) were analyzed using multivariate linear regression analysis with the following covariates: systolic and diastolic blood pressure (BP), pulse rate, fasting glucose, total cholesterol, waist circumference, age, sex, proteinuria, cardiovascular disease, smoking and drinking status, high water intake, and urine sodium and creatinine. When covariates were chosen as dependent variables, they were excluded from the model.

SGU, specific gravity unit.

References

1. Gansevoort RT, Correa-Rotter R, Hemmelgarn BR, et al. Chronic kidney disease and cardiovascular risk: epidemiology, mechanisms, and prevention. Lancet 2013;382:339–352.
crossref pmid
2. Jha V, Garcia-Garcia G, Iseki K, et al. Chronic kidney disease: global dimension and perspectives. Lancet 2013;382:260–272.
crossref pmid
3. Cohen JD. Hypertension epidemiology and economic burden: refining risk assessment to lower costs. Manag Care 2009;18:51–58.
4. Dall TM, Yang W, Halder P, et al. The economic burden of elevated blood glucose levels in 2012: diagnosed and undiagnosed diabetes, gestational diabetes mellitus, and pre-diabetes. Diabetes Care 2014;37:3172–3179.
crossref pmid
5. Mills KT, Bundy JD, Kelly TN, et al. Global disparities of hypertension prevalence and control: a systematic analysis of population-based studies from 90 countries. Circulation 2016;134:441–450.
crossref pmid pmc
6. Baron S, Courbebaisse M, Lepicard EM, Friedlander G. Assessment of hydration status in a large population. Br J Nutr 2015;113:147–158.
crossref pmid
7. Agarwal SK, Mohareb S, Patel A, et al. Systematic oral hydration with water is similar to parenteral hydration for prevention of contrast-induced nephropathy: an updated meta-analysis of randomised clinical data. Open Heart 2015;2:e000317
crossref pmid pmc
8. Bongers CCWG, Alsady M, Nijenhuis T, et al. Impact of acute versus prolonged exercise and dehydration on kidney function and injury. Physiol Rep 2018;6:e13734
crossref pmid pmc
9. Glaser J, Lemery J, Rajagopalan B, et al. Climate change and the emergent epidemic of CKD from heat stress in rural communities: the case for heat stress nephropathy. Clin J Am Soc Nephrol 2016;11:1472–1483.
crossref pmid pmc
10. Kuwabara M, Hisatome I, Roncal-Jimenez CA, et al. Increased serum sodium and serum osmolarity are independent risk factors for developing chronic kidney disease; 5 year cohort study. PLoS One 2017;12:e0169137
crossref pmid pmc
11. Roncal-Jimenez C, Lanaspa MA, Jensen T, Sanchez-Lozada LG, Johnson RJ. Mechanisms by which dehydration may lead to chronic kidney disease. Ann Nutr Metab 2015;66(Suppl 3):10–13.
crossref
12. Bouby N, Fernandes S. Mild dehydration, vasopressin and the kidney: animal and human studies. Eur J Clin Nutr 2003;57(Suppl 2):S39–S46.
crossref pmid
13. Clark WF, Sontrop JM, Huang SH, Moist L, Bouby N, Bankir L. Hydration and chronic kidney disease progression: a critical review of the evidence. Am J Nephrol 2016;43:281–292.
crossref pmid
14. Clark WF, Sontrop JM, Huang SH, et al. Effect of coaching to increase water intake on kidney function decline in adults with chronic kidney disease: the CKD WIT randomized clinical trial. JAMA 2018;319:1870–1879.
crossref pmid pmc
15. Clark WF, Sontrop JM, Macnab JJ, et al. Urine volume and change in estimated GFR in a community-based cohort study. Clin J Am Soc Nephrol 2011;6:2634–2641.
crossref pmid pmc
16. Hebert LA, Greene T, Levey A, Falkenhain ME, Klahr S. High urine volume and low urine osmolality are risk factors for faster progression of renal disease. Am J Kidney Dis 2003;41:962–971.
crossref pmid
17. Palmer SC, Wong G, Iff S, et al. Fluid intake and all-cause mortality, cardiovascular mortality and kidney function: a population-based longitudinal cohort study. Nephrol Dial Transplant 2014;29:1377–1384.
crossref pmid
18. Plischke M, Kohl M, Bankir L, et al. Urine osmolarity and risk of dialysis initiation in a chronic kidney disease cohort: a possible titration target? PLoS One 2014;9:e93226
crossref pmid pmc
19. Sontrop JM, Dixon SN, Garg AX, et al. Association between water intake, chronic kidney disease, and cardiovascular disease: a cross-sectional analysis of NHANES data. Am J Nephrol 2013;37:434–442.
crossref pmid
20. Strippoli GF, Craig JC, Rochtchina E, Flood VM, Wang JJ, Mitchell P. Fluid and nutrient intake and risk of chronic kidney disease. Nephrology (Carlton) 2011;16:326–334.
crossref pmid
21. Kweon S, Kim Y, Jang MJ, et al. Data resource profile: the Korea National Health and Nutrition Examination Survey (KNHANES). Int J Epidemiol 2014;43:69–77.
crossref pmid pmc
22. Levey AS, Coresh J, Greene T, et al. Chronic Kidney Disease Epidemiology Collaboration. Using standardized serum creatinine values in the modification of diet in renal disease study equation for estimating glomerular filtration rate. Ann Intern Med 2006;145:247–254.
crossref pmid
23. Newman DJ, Pugia MJ, Lott JA, Wallace JF, Hiar AM. Urinary protein and albumin excretion corrected by creatinine and specific gravity. Clin Chim Acta 2000;294:139–155.
crossref pmid
24. Burnham KP, Anderson DR. Model selection and multi-model inference: a practical information-theoretic approach. 2nd ed.New York: Springer-Verlag New York, Inc; 2002.
25. Brenner BM. Nephron adaptation to renal injury or ablation. Am J Physiol 1985;249:F324–F337.
crossref pmid
26. Anastasio P, Cirillo M, Spitali L, Frangiosa A, Pollastro RM, De Santo NG. Level of hydration and renal function in healthy humans. Kidney Int 2001;60:748–756.
crossref pmid
27. Canivell S, Ponte B, Pruijm M, et al. 4B.05: Plasma copeptin is associated with insulin resistance in a Swiss population-based study. J Hypertens 2015;33(Suppl 1):e54
28. Wannamethee SG, Welsh P, Papacosta O, Lennon L, Whincup PH, Sattar N. Copeptin, insulin resistance, and risk of incident diabetes in older men. J Clin Endocrinol Metab 2015;100:3332–3339.
crossref pmid pmc
29. Abu-Basha EA, Yibchok-Anun S, Hsu WH. Glucose dependency of arginine vasopressin-induced insulin and glucagon release from the perfused rat pancreas. Metabolism 2002;51:1184–1190.
crossref pmid
30. Vintilă M, Gheorghiu ML, Caragheorgheopol A, et al. Increased copeptin levels in metabolic syndrome from a Romanian population. J Med Life 2016;9:353–357.
pmid pmc
31. Saleem U, Khaleghi M, Morgenthaler NG, et al. Plasma carboxy-terminal provasopressin (copeptin): a novel marker of insulin resistance and metabolic syndrome. J Clin Endocrinol Metab 2009;94:2558–2564.
crossref pmid pmc
32. Scott LV, Dinan TG. Vasopressin and the regulation of hypothalamic-pituitary-adrenal axis function: implications for the pathophysiology of depression. Life Sci 1998;62:1985–1998.
crossref pmid
33. Garneata L, Stancu A, Dragomir D, Stefan G, Mircescu G. Ketoanalogue-supplemented vegetarian very low-protein diet and CKD progression. J Am Soc Nephrol 2016;27:2164–2176.
crossref pmid pmc
34. Klahr S, Levey AS, Beck GJ, et al. The effects of dietary protein restriction and blood-pressure control on the progression of chronic renal disease. Modification of Diet in Renal Disease Study Group. N Engl J Med 1994;330:877–884.
crossref pmid
TOOLS
METRICS Graph View
  • 9 Web of Science
  • 10 Crossref
  • 8 Scopus
  • 3,992 View
  • 54 Download
Related articles


ABOUT
BROWSE ARTICLES
EDITORIAL POLICY
FOR CONTRIBUTORS
Editorial Office
#301, (Miseung Bldg.) 23, Apgujenog-ro 30-gil, Gangnam-gu, Seoul 06022, Korea
Tel: +82-2-3486-8736    Fax: +82-2-3486-8737    E-mail: registry@ksn.or.kr                

Copyright © 2024 by The Korean Society of Nephrology.

Developed in M2PI

Close layer