


Introduction
Management of fluid and sodium balance is the fundamental key to treatment of dialysis patients. A hypervolemic status affects patient outcomes through uncontrolled hypertension and left ventricular hypertrophy, leading to an increase in cardiovascular death [1,2]. Adequate fluid removal in peritoneal dialysis (PD) patients is usually achieved by ultrafiltration from peritoneal membrane transport and residual renal function. Previous studies have shown that residual urine output progressively declines over time [3]. Diuretic drugs can be used for the management of excessive extracellular fluid (ECF) and to control blood pressure in dialysis patients. Loop diuretics are considered to be the first-line drug of choice in end-stage renal disease because they retain efficacy at a low glomerular filtration rate [4,5]. A study in hemodialysis patients showed the efficacy of high-dose furosemide (250–2,000 mg daily) to increase urine volume; however, this response gradually declined during the 1-year follow-up period [6]. In the general population, the use of combined diuretics with a different mechanism of action at each part of the renal tubule promotes greater natriuresis than a single diuretic alone. Thiazide inhibits the Na+-Cl− co-transporter at the distal tubule and patients with impaired renal function should be given high enough doses to deliver thiazide diuretics to the distal tubular lumen. Thiazide is often used in combination with loop diuretics for increased efficacy, even in patients with advanced renal failure [7]. The efficacy of different types of diuretics in the management of volume status in continuous ambulatory peritoneal dialysis (CAPD) patients is not known. The aim of this study was to compare the efficacy of triple diuretic treatment (loop diuretic, hydrochlorothiazide [HCTZ], and aldosterone antagonist) with that of a single diuretic (loop diuretic) with regard to urine volume, small solute clearance, urinary sodium and urinary potassium excretion, and hydration status in CAPD patients.
Methods
Participants
The study protocol was approved by the Ethics Committee of Burapha University on November 4, 2014 (Number 20/2527) and registered with the Thai clinical trial registry (identification number TCTR20140625002). This study was conducted in CAPD patients who were followed up at Burapha University Hospital. All 67 CAPD patients in our unit were screened for inclusion and exclusion criteria as described below. The enrollment period was from May 2014 to April 2015.
Inclusion criteria
CAPD patients older than 20 years, able to undergo PD cycles 3 to 5 times per day, and available for follow-up for at least 6 months.
Exclusion criteria
Patients with obstructive uropathy, contraindication for diuretic drugs, on medications that known to be toxic to the kidney, inability to record urine volume, contraindicated for multifrequency bioimpedance spectroscopy measurement (implantable electrical device and amputation), and refusal to participate in this study.
Fifty-five participants were enrolled in the study after providing written informed consent.
Study design and treatment procedures
This was a two-phase prospective, double-blinded, randomized controlled trial. The first phase was a run-in period with 1,000 mg of furosemide and renin-angiotensin system blockage (ACEIs/ARBs) in all patients for 1 month before randomization with cessation of other diuretics. In the second phase, 55 patients were randomly assigned to the triple diuretic group (furosemide 1,000 mg/day [Lasix®; Sanofi Aventis, Laval, Canada] + spironolactone 50 mg/day [Aldactone®; Pfizer Ltd., Sandwich, United Kingdom] + HCTZ 100 mg/day [HCTZ®; Government Pharmaceutical Organization, Bangkok, Thailand]) or the single diuretic group (furosemide 1,000 mg/day) by computer randomization (Fig. 1). The study drugs were masked by re-encapsulation by the pharmacists; at every visit, the pharmacist prepared active gradients and excipient (starches) using a scale and then filled and labeled hard capsules. Physicians and patients were blinded to the medication treatment group.
Data collection
Baseline demographic data including sex, age, comorbidity, medications, dialysis vintage, blood pressure, and body weight were collected. PD treatment data were recorded. Patients underwent a peritoneum equilibrium test (PET) using a modified PET. A venous blood chemistry profile, including electrolyte, calcium, phosphorous, albumin, and hematocrit was obtained and 24-hour urine volume and urine chemistry were recorded at 0, 3, and 6 months.
PD was prescribed according to patient size, amount of residual kidney function, membrane characteristics, and patient’s volume status. PD adequacy was assessed with a target of Kt/Vurea ≥ 1.7 per week [8] and the target for creatinine clearance was > 50 L/1.73 m2 per week.
Formula for weekly creatinine clearance (normalized to 1.73 m
2
body surface area)
Formula of total weekly Kt/V
urea
Total body water (TBW), 0.6 × BW; Vdrained, volume drained; Purea, plasma urea; Pcreatinine, plasma creatinine; D, dialysate; U, urine.
Hydration status was assessed by multifrequency bio-impedance spectroscopy (BCM®; Fresenius Medical Care, Bad Homburg, Germany) at 0, 3, and 6 months. BCM measured hydration status during dwell time (while PD fluid was in the abdomen). Overhydration (OH) was identified by ECF volume minus predicted ECF volume for each patient. As a result, PD solution did not interfere with the results.
Outcome measurement
The primary outcome was the difference in daily urine output at the 3rd and 6th month of the study compared to baseline (ΔUO) between the single diuretic and triple diuretic group.
Change in daily urine output (ΔUO) = daily urine output at the 3rd and 6th months of study – daily urine output at baseline
Secondary outcomes were the difference in daily urinary sodium excretion, urinary potassium excretion, hydration status, and daily glucose exposure (g/day) at the 3rd and 6th months compared to baseline (all participants used a dextrose-based PD fluid). The PD prescription was adjusted according to the patient’s volume status and dialysis adequacy. We recorded PD data, including glucose concentration, daily PD fluid volume, and ultrafiltration, and calculated daily net glucose exposure.
Change in daily urinary sodium excretion = daily urinary sodium excretion at 3rd, 6th month of study – daily urinary sodium excretion at baseline
Change of daily urinary potassium excretion = daily urinary potassium excretion at 3rd, 6th month of study – daily urinary potassium excretion at baseline
Change in OH = OH at 3rd, 6th month – OH at baseline
Daily net glucose exposure (g/day) = sum of % glucose × PD fluid volume
Statistical analysis
To detect a 20% difference in delta urine output (ΔUO) between groups, a sample size of 25 patients in each group was required to achieve 80% power to detect a significant difference in daily urine output at 3 and 6 months compared to baseline with two-tailed alpha of 0.05. Numerical data were presented as mean ± standard deviation. The difference between the two groups was analyzed by paired Student’s t test to test the difference in primary and secondary outcomes at 3 and 6 months between groups and Fisher’s exact test was used to test the adverse events profiles. A P value < 0.05 was considered significant. Data were analyzed by intention-to-treat analysis. Statistical analysis was performed using R programming language version 3.0.1 (R Foundation for Statistical Computing, Vienna, Austria).
Results
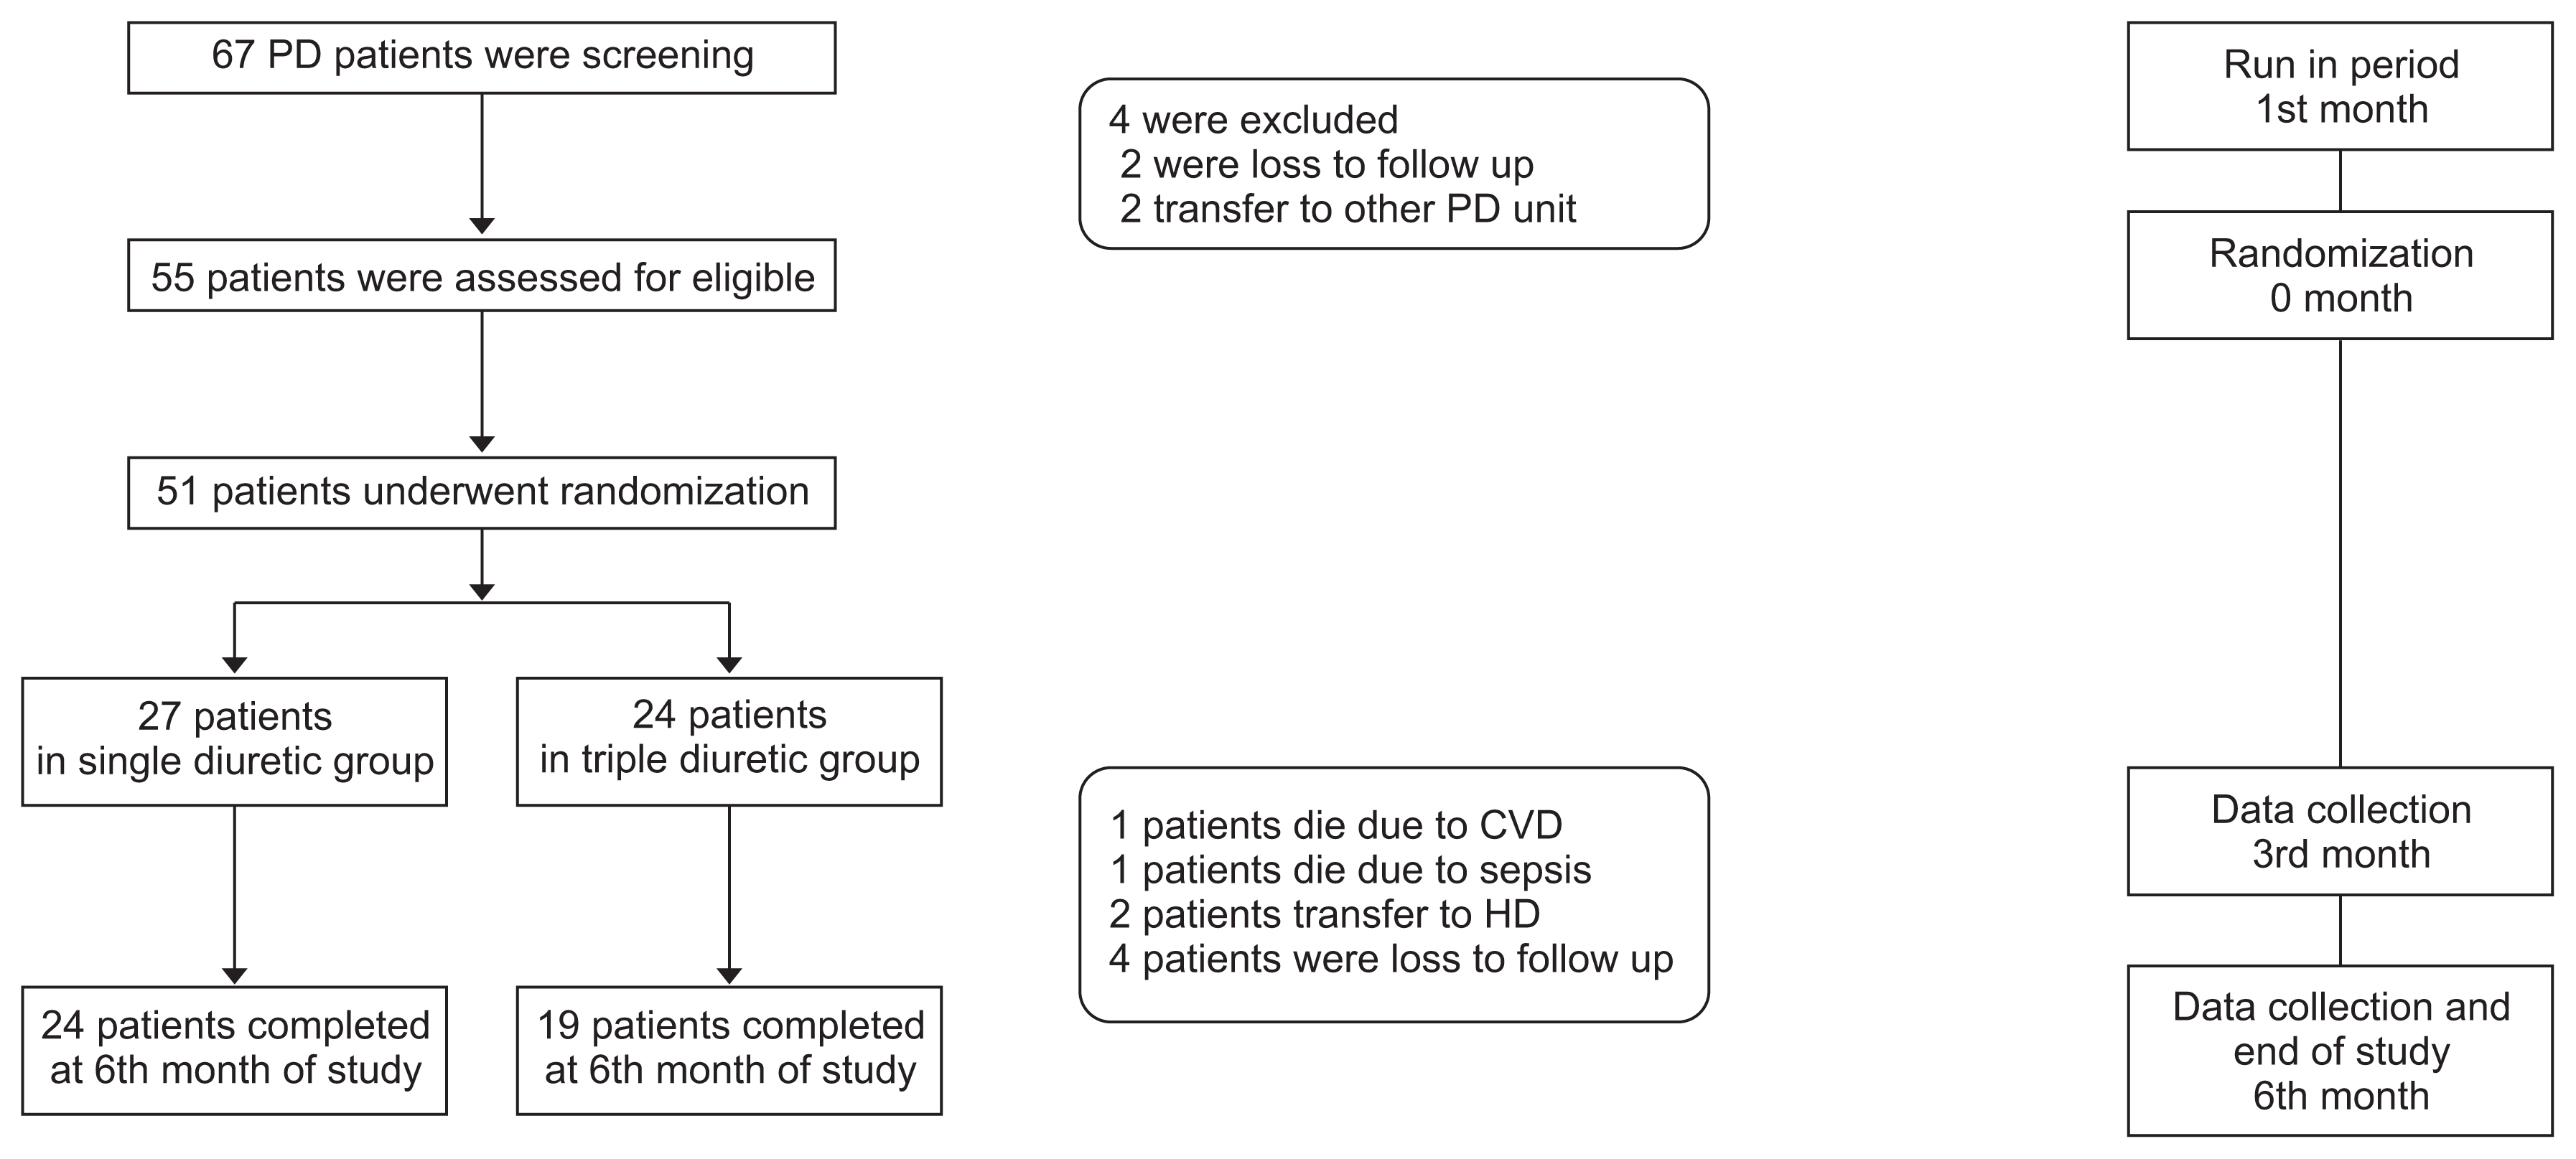
Of 55 CAPD patients enrolled in our study, four patients were excluded during the run-in period due to transfer to other PD units (n = 2) or loss to follow up (n = 2). The remaining 51 patients were randomly assigned to treatment groups, with 24 patients assigned to the triple diuretics arm (Fig. 1).
During the study period, two patients died due to cardiovascular disease, two patients died due to sepsis, two patients were transferred to hemodialysis due to ultrafiltration failure, and four patients were lost to follow-up, resulting in 43 patients available for statistical analysis.
Baseline demographic features of both groups are shown in Table 1. Sex, mean age, dialysis vintage, and proportion of patients with diabetes and hypertension in both groups were similar. Mean baseline residual urine output in both groups was not statistically different. The proportion of patients who had urine volume greater than 1 L per day or less than 1 L per day were comparable in both groups but two patients in the triple diuretics group had urine volume less than 100 mL/day. Most of the patients had high average or low average peritoneal membrane transport. Renal Kt/V and peritoneal Kt/V were not statistically different between the two groups. Patients in the triple diuretics group had higher weekly peritoneal creatinine clearance but the difference was not significant.
Urine volume
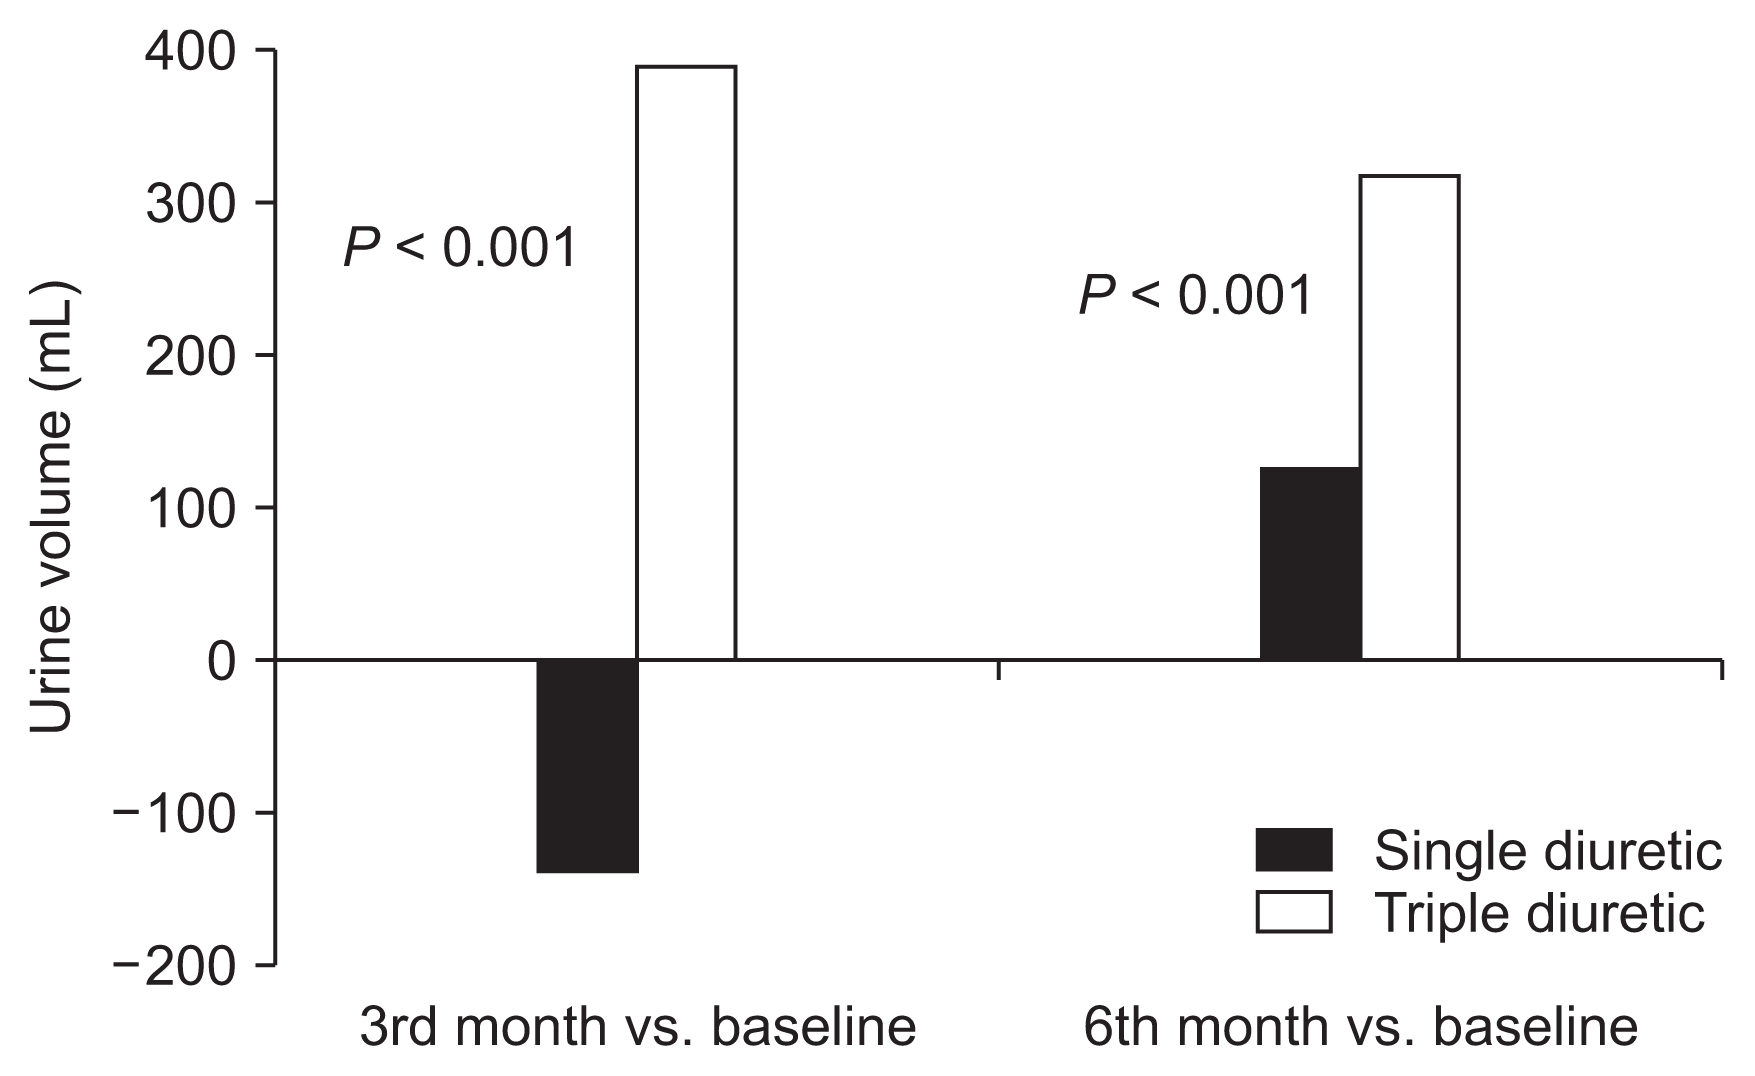
Mean changes in urine volume are summarized in Fig. 2. At the end of the study period, mean urine volume was increased in both groups (858.75 ± 481.54 to 978.75 ± 436.89 mL/day in the single diuretic group; 850 ± 557.56 to 1,143.15 ± 558.81 mL/day in the triple diuretic group). At the 3rd and 6th month, ΔUO of the triple diuretic group was significantly higher than that of the single diuretic group (386.32 ± 733.92 vs. −136.25 ± 629.08, P < 0.001; 311.58 ± 640.31 vs. 120.00 ± 624.07, P < 0.001).
Urinary sodium and potassium excretion
Daily urinary sodium excretion increased in the triple diuretic group but decreased in the single diuretic group at the 3rd month of study but without statistical significance (+140.96 ± 377.80 vs. −6.51 ± 65.25 mmol/day, P = 0.08). At the 6th month, urinary sodium excretion was higher in the triple diuretic group compared with the single diuretic group but the difference did not reach statistical significance (+230.59 ± 520.27 vs. +15.57 ± 46.55 mmol/day; P = 0.47). Similarly, mean change in urine potassium excretion at the 3rd month was higher in the triple diuretic group than in the single diuretic group (5.15 ± 7.91 vs. 0.47 ± 4.74; P = 0.64). At the 6th month, urinary potassium excretion decreased in the single diuretic group and increased in the triple diuretic group without statistical significance (−2.33 ± 24.96 vs. 7.25 ± 16.01; P = 0.63).
Hydration status
Hydration status was assessed by bioimpedance spectroscopy. Body composition and hydration status in all patients were measured at baseline and the 3rd and 6th month. Mean changes in OH are reported in Table 2. Baseline hydration status was not statistically different between groups. Hydration status was significantly better in the triple diuretics group compared to the single diuretic group at the 3rd month (OH +1.03 ± 0.68 L vs. +2.03 ± 1.80 L; P = 0.01).
The triple diuretic group had significantly decreased OH compared with the single diuretic group at the 3rd and 6th month (1.84 ± 2.24 L vs. 0.44 ± 1.62 L, P = 0.03; 1.49 ± 2.82 L vs. −0.48 ± 2.61 L, P = 0.02). The TD group showed better reduction of excessive water than the SD group at both the 3rd and 6th months of study.
Blood pressure
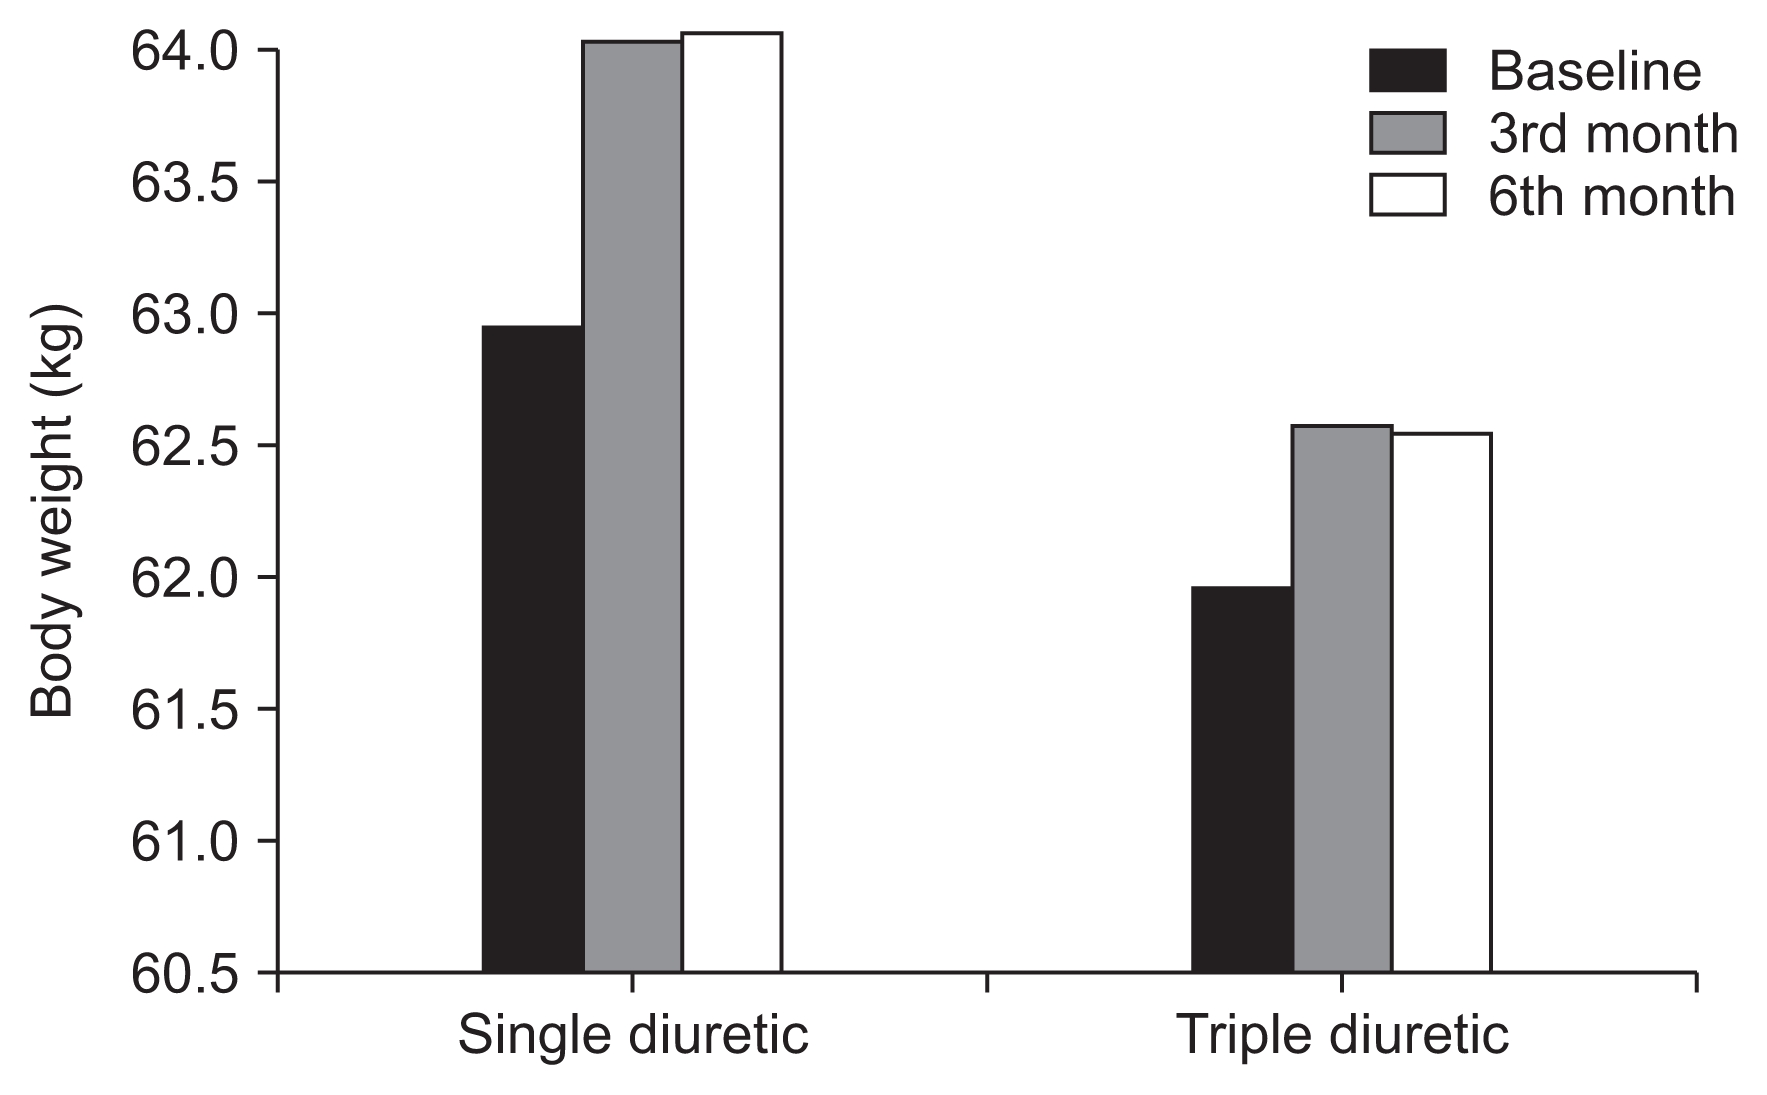
Mean systolic blood pressure and diastolic blood pressure and body weight in both groups were not significantly different at baseline, 3rd month, and 6th month of study (Fig. 3).
Peritoneal dialysis data
The change in mean daily net glucose exposure between 3rd month and baseline was not significantly different between the groups. Mean daily net glucose exposure was increased at the end of the study in both groups (Table 3).
Adverse events
Adverse event profiles in the two groups were similar. The most common adverse events occurring during the study were dizziness, dehydration, and hypotension in both groups. No serious adverse events occurred (Table 4).
Discussion
Residual renal function plays an important role in water balance and solute clearance in dialysis patients and is a strong predictor of PD patient outcomes [10]. Analysis of data from the CANUSA study showed that residual renal function was more important than peritoneal clearance in predicting outcome in PD patients. Every 250 mL of urine volume per day was associated with a 36% lower death rate [11]. Likewise, the ADEMEX study in Mexico showed that an increase in the amount of urine volume was associated with an increase in survival in PD patients [12]. Although most studies have shown that the rate of decline in residual renal function is slower in PD than hemodialysis [13], residual renal function progressively declines with dialysis time for both [14,15].
Several studies showed the efficacy of loop diuretics in dialysis patients. Medcalf et al [16] demonstrated the efficacy of 250 mg furosemide daily in PD patients over a 1-year period compared with control, with mean daily urine volume in the furosemide group higher than that in the control group at 6 months and 12 months. Urinary sodium excretion was also increased in the furosemide group. van Oldan et al [17] studied the effect of high-dose furosemide in seven PD patients who still had residual urine. They found that high-dose furosemide increased urine volume about 400 mL/day and increased the urinary sodium excretion 54 mmol/day but did not affect the filtration rate of the kidneys, urea clearance, creatinine clearance, and peritoneal water and solute clearance. These two studies indicate that high-dose furosemide resulted in increased urine volume and urinary sodium excretion in PD patients but could not slow the decline of kidney function.
Most studies on diuretic use in PD patients collected data from patients who had initiated PD for a short period of time [16,18,19]. These patients still had a sufficient volume of urine to prevent them from entering the hypervolemic state. Hypervolemia is frequently seen in patients who dialyze for more than 1 year and have a decrease in residual urine volume. The subjects of this study had higher dialysis vintage than those in previous studies so they would tend to have more problems controlling water balance.
We used triple diuretics with a different mechanism of action at each segment of the renal tubules to enhance diuresis efficacy and decrease adverse drug reactions of electrolyte imbalance. This was the first prospective randomized controlled trial that studied the efficacy of triple diuretic drugs (loop diuretic, thiazide, and aldosterone antagonist) compared with a single diuretic (only loop diuretic) on daily urine volume and small solute clearance in PD patients. The results suggested that triple diuretics increased daily urine output at 3 and 6 months of the study compared with high-dose furosemide alone. Urinary sodium and potassium excretion were also higher in the triple diuretic-treated group but the difference did not reach statistical significance. These results suggested that triple diuretic therapy is beneficial for salt and water balance in PD patients. Moreover, bioimpedance analysis was measured in all patients. The hydration status in the triple diuretic group was better than that in the single diuretic group, which was consistent with the increase in urine volume.
Two patients in triple diuretic group had urine output < 100 mL/day at randomization. At the 6th month after treatment, urine volume was increased. Triple diuretic drugs may slow time to anuria in PD patients. A recent small study by Scapioni et al [20] enrolled anuric PD patients and administered furosemide 500 mg/day or muzolimine 480 mg/day. Their results did not show a difference in urine volume and urinary solute clearance at the end of the study.
Many factors may affect patient urine output such as hydration status, illness, some medications, ultrafiltration, and PD solution, and might explain why the urine volume decreased at the 3rd month and then increased at the 6th month in the single diuretic group.
There were some limitations in this study. This was a single-center study with a small sample size. In addition, there was a high dropout rate and the study duration was only 6 months, which might not long enough to observe differences in residual renal function such as renal small solute clearance between groups.
Adequate fluid and sodium balance are crucial for the management of CAPD patients. Diuretic drugs are commonly prescribed to manage hypervolemia. Triple diuretic treatment causes a significant increase in urine volume and results in improvement of fluid balance measured by bioimpedance spectroscopy. Urine sodium and potassium levels tend to increase with triple diuretics. Our results indicate that triple diuretic therapy is useful for the management of excessive fluid in patients undergoing CAPD.
 PDF Links
 PubReader
 Full text via DOI
 Download Citation
 Print
Print


")


