Identification of osteopontin as a urinary biomarker for autosomal dominant polycystic kidney disease progression
Article information

Abstract
Background
Autosomal dominant polycystic kidney disease (ADPKD), one of the most common human monogenic diseases, is characterized by the presence of numerous fluid-filled renal cysts and is a leading cause of end-stage renal disease (ESRD). Urinary biomarkers may be useful for predicting the variable course of ADPKD progression from cyst growth to ESRD.
Methods
To identify candidate urinary biomarkers of ADPKD progression, we used CRISPR/Cas9 genome editing to generate porcine fibroblasts with mono- and biallelic ADPKD gene knockout (PKD2+/– and PKD2–/–, respectively). We then performed RNA-sequencing analysis on these cells.
Results
Levels of osteopontin (OPN), which is expressed by renal epithelial tubular cells and excreted into urine, were reduced in PKD2–/– cells but not in PKD2+/– cells. OPN levels were also reduced in the renal cyst cells of ADPKD patients. Next, we investigated whether OPN excretion was decreased in patients with ADPKD via enzyme-linked immunosorbent assay. OPN levels excreted into renal cyst cell culture media and urine from ADPKD patients were decreased. To investigate whether OPN can predict the rate of ADPKD progression, we compared urinary excretion of OPN in ADPKD patients with slow progression and those with rapid progression. Those with rapid progression had an estimated glomerular filtration rate of >60 mL/min/1.73 m2. Urinary OPN excretion levels were lower in rapid progressors than in slow progressors.
Conclusion
These findings suggest that OPN is a useful urinary biomarker for predicting ADPKD progression.
Introduction
Autosomal dominant polycystic kidney disease (ADPKD) is a genetic disease caused by mutations in the PKD1 and PKD2 genes. Among genetic diseases, ADPKD has a high incidence and a long disease progression course. Cysts, a typical symptom of this disease, occur in both kidneys and sometimes in the liver or other organs. The number and size of these cysts gradually increase. When patients reach their 40s and 50s, kidney function deteriorates, eventually progressing to end-stage renal disease (ESRD) [1–5].
Currently, ADPKD is diagnosed by direct PKD1 and PKD2 gene sequencing analyses. However, these techniques are associated with difficulties due to the size and complexity of these genes. Although gene variants can be detected by direct sequencing of the PKD1 and PKD2 genes, distinguishing between gene polymorphisms and pathogenic missense mutations in the absence of family history is difficult [6–9]. Therefore, in addition to direct sequencing of the PKD1 and PKD2 genes, radiologic analysis of renal cysts is performed for the diagnosis of ADPKD [10–12]. Kidney cysts begin in childhood, but the size and number of cysts must be sufficient to be detected in radiographic images. Therefore, radiologic diagnosis may be difficult in the early stages of adolescence. In addition to radiologic evaluation, monitoring of renal function is also used to determine the progression of ADPKD [13,14]. However, decreases in renal function are not completely consistent with increases in the size and number of cysts. Since decreased renal function is observed when total kidney volume (TKV) has increased to some extent, determining progression of ADPKD by measuring levels of creatinine as an indicator of renal function, especially in the early stages of disease, is difficult. Therefore, a new biomarker, preferably one detectable in the urine, is needed for predicting ADPKD progression before renal function deteriorates. Pigs in which only one allele of PKD1 has been mutated exhibit a phenotype similar to human ADPKD [15]. Compared with mice, which exhibit the ADPKD phenotype only after biallelic knockout, pigs are more similar to humans and are good animal models for the study of disease mechanisms and biomarkers. Porcine fibroblasts with biallelic knockout of the ADPKD-related gene PKD2 are similar to human renal cyst cells that display a recessive mechanism but dominant inheritance, and genes that exhibit changes in expression in these cells could be potential biomarkers. In the current study, genes that could affect the number and size of cysts via mutation were selected.
Osteopontin (OPN) is an acidic glycoprotein that has been identified as a soluble cytokine in both urine and plasma. OPN is composed of 314 amino acids, and its structure includes an N-terminal fragment that contains an integrin-binding site and a C-terminal fragment that binds two heparin molecules and CD44 variants [16–18]. OPN is a member of the small integrin-binding ligand N-linked glycoprotein (SIBLING) family of proteins and is involved in bone remodeling, cell survival, inflammation, and kidney damage [19]. According to the results of several studies, the expression levels of OPN were increased in animals with kidney diseases. These diseases included glomerulonephritis, stone formation, acute ischemic renal injury, tubulointerstitial nephritis, hydronephrosis, chronic cyclosporine-induced nephropathy, interstitial inflammation and fibrosis, and lupus nephritis [16].
In this study, we investigated OPN as a potential urinary biomarker for predicting ADPKD severity or progression.
Methods
Study subjects
The subjects enrolled in the HOPE-PKD cohort (the coHOrt for genotype-PhenotypE correlation in ADPKD) between 2009 and 2017 were screened [20]. All methods were conducted in accordance with relevant guidelines and regulations. The study protocol was approved by the Institutional Review Board of Seoul National University Hospital (No. 1205-112-411). The informed consent was obtained from all subjects before performing study. Subjects who were aged over 18 years with compatible imaging findings using the unified criteria, with or without a family history of disease, were enrolled in the HOPE-PKD cohort.
Cell lines and culture
For the immortalization of porcine fibroblasts, primary cultured porcine fibroblasts from White Yucatan miniature pigs were transfected with human telomerase reverse transcriptase (hTERT) via Lipofectamine 2000 (Invitrogen, Carlsbad, CA, USA). After transfection, the cells were selected with 1-mg/mL G418 for two passages and then maintained in medium supplemented with 0.5-mg/mL G418. Immortalized porcine fibroblasts were cultured in Dulbecco’s Modified Eagle’s Medium (DMEM) supplemented with 10% fetal bovine serum (FBS) and minimum essential media nonessential amino acid solution (Thermo Fisher Scientific, Waltham, MA, USA) at 37°C in 5% CO2.
To achieve PKD2 gene knockout in porcine fibroblasts by CRISPR/Cas9 genome editing, a single-guide RNA targeting PKD2 (5'-GCA TCC GGC AGG CGG CCG CG-3') was inserted into the CRISPR/Cas9 plasmid pSpCas9-2A-Puro version 2.0 (Addgene, Watertown, MA, USA). The resulting plasmid was transfected into immortalized porcine fibroblasts using Lipofectamine 2000. After transfection, the cells were selected with 1-g/mL puromycin for two passages.
To culture renal cyst cells, kidney tissues from the subjects in the HOPE-PKD cohort were obtained. The hTERT-immortalized renal cyst cells from ADPKD patients were derived from proximal tubular epithelial cells and cultured in DMEM supplemented with 10% FBS at 37°C in 5% CO2 as previously described [21]. Human renal proximal tubular epithelial cells (RPTECs) were cultured in American Type Culture Collection (ATCC)-formulated DMEM/F12 supplemented with an hTERT RPTEC Growth Kit (ATCC, Manassas, VA, USA) as previously described [21].
RNA preparation and RNA-sequencing analysis
Total RNA was isolated from PKD2+/+, PKD2+/–, and PKD2–/– porcine fibroblasts using the TRIzol method according to the manufacturer’s protocol (Qiagen, Hilden, Germany). RNA-sequencing analysis was performed by MacroGen, Inc. (www.macrogen.com) with the Illumina HiSequation 2000 platform (Illumina, San Diego, CA, USA).
Real-time polymerase chain reaction
Total RNA isolated from individual porcine fibroblasts or RPTECs and from renal cyst cells was used for real-time polymerase chain reaction (RT-PCR) assays to quantify OPN and glyceraldehyde 3-phosphate dehydrogenase (GAPDH) messenger RNA (mRNA) expression. First, we synthesized first-strand complementary DNA (cDNA) from total RNA using a PrimeScript RT-PCR Kit (Takara Bio, Shiga, Japan). Then, the first-strand cDNA was subjected to RT-PCR using Power SYBR Green PCR Master Mix (Thermo Fisher Scientific) and a QuantStudio 3 Real-Time PCR system (Thermo Fisher Scientific) according to the manufacturer’s protocols. PCR was conducted in triplicate with 40 cycles of 95°C for 15 seconds, 61°C for 30 seconds, and 58°C for 30 seconds. The threshold cycle (Ct) value was measured to determine the starting copy numbers of the target genes using the standard curve. The primers used to amplify porcine and human OPN and GAPDH were: sense porcine OPN: 5′-GGG CTT CGC CTC TGC CCT TC-3′ and antisense porcine OPN: 5′-GTC GGT TGC TGG GGT GTC GG-3′; sense human OPN: 5′-CCC ACG GAC CTG CCA GCA AC-3′ and antisense human OPN: 5′-TCC TTC CCA CGG CTG TCC CA-3′; sense porcine GAPDH: 5′-TCG CCA TCA ATG ACC CCT TCA-3′ and antisense porcine GAPDH: 5′-CAC CCC ATT TGA TGT TGG C-3′; and sense human GAPDH: 5′-TTG CCA TCA ATG ACC CCT TCA-3′ and antisense human GAPDH: 5′-CGC CCC ACT TGA TTT TGG A-3′.
Western blotting analysis
RPTECs and renal cyst cells from patients with ADPKD were lysed with RIPA buffer (Thermo Fisher Scientific). The protein lysates were separated by 12% sodium dodecyl sulfate-polyacrylamide gel electrophoresis (SDS-PAGE) and transferred to polyvinylidene difluoride (PVDF) membranes. The membranes were incubated in blocking buffer (3% nonfat dry milk in Tris-buffered saline and 0.1% Tween 20 [TBST]) for 1 hour and then probed with primary antibodies overnight at 4°C. We used anti-PC2 (Baltimore PKD Center), anti-OPN (Proteintech, Rosemont, IL, USA), and anti-β-actin (Sigma-Aldrich, Burlington, MA, USA) primary antibodies for Western blotting analysis. After washing 3 times with TBST, the blots were incubated with a peroxidase-labeled secondary antibody for 1 hour. The blots were then washed 3 times with TBST, and the target proteins were detected using an enhanced chemiluminescence detection system (GE Healthcare, Chicago, IL, USA).
Quantitative analysis of the osteopontin levels in cell culture supernatants and urine
Supernatants from RPTEC and human renal cyst cell cultures and urine from normal individuals and ADPKD patients were collected. We used a Human Osteopontin Quantikine enzyme-linked immunosorbent assay (ELISA) Kit (R&D Systems, Minneapolis, MN, USA) to quantify the OPN levels in the cell culture supernatants and urine. Urine samples from the HOPE-PKD cohort ADPKD patients were obtained. The levels of OPN in urine were corrected by the creatine levels that were measured with a QuantiChrom Creatinine Assay Kit (BioAssay Systems, Hayward, CA, USA). The assay was performed according to the manufacturer’s protocol.
All human-derived materials containing urine were processed in accordance with relevant guidelines and regulations. This study was approved by the Institutional Review Board of Seoul National University Hospital (No. 1205-112-411).
Results
Establishment of porcine fibroblasts with CRISPR/Cas9-mediated targeted PKD2 gene knockout
PKD2-knockout porcine fibroblasts were generated to establish a porcine model of ADPKD that is more similar to human ADPKD disease than mouse models of ADPKD. PKD2-knockout porcine fibroblasts are additionally helpful to study ADPKD because renal fibrosis is the main reason for kidney function deterioration among ADPKD patients. We then investigated the gene expression profiles of these PKD2-knockout porcine fibroblasts through RNA-sequencing analysis to identify biomarker candidates for the prediction of ADPKD progression. We established porcine fibroblast cells in which PKD2, the ADPKD-related gene, was knocked out using CRISPR/Cas9 genome editing. First, porcine fibroblasts were immortalized with hTERT rather than simian virus 40 (SV40). SV40 induced aneuploidy and altered some signaling pathways, and induction of a PKD2 mono-allelic mutation with CRISPR/Cas9 requires no abnormalities in the number or structure of chromosomes. Since SV40 caused changes in the number and structure of chromosomes, we evaluated whether hTERT also causes these changes by karyotype analysis. We confirmed that there were no abnormalities in the number and structure of chromosomes in the karyotype of porcine fibroblasts immortalized with hTERT (Fig. 1A). Then, we used CRISPR/Cas9 to establish an ADPKD disease model in vitro in which a C nucleotide insertion mutation occurred in exon 1 of PKD2 (Fig. 1B). The protein expression levels in porcine fibroblasts were assessed to confirm whether the gene knockout was successfully achieved with the CRISPR/Cas9 system (Fig. 1C).

Knockout of the PKD2 gene using the CRISPR/Cas9 genome editing method in porcine fibroblasts immortalized with hTERT.
(A) Karyotype of porcine fibroblasts immortalized with hTERT. (B) Base sequence analysis of the CRISPR/Cas9 target site in the PKD2 gene. (C) Comparison of PC2, the protein product of the PKD2 gene, in genetically edited porcine fibroblasts.
hTERT, human telomerase reverse transcriptase; PC2, polycystin-2.
Messenger RNA expression of osteopontin was reduced in PKD2–/– porcine fibroblasts but not in PKD2+/– porcine fibroblasts
Porcine fibroblasts with PKD2 mono- and biallelic knockout (PKD2+/– and PKD2–/– cells, respectively) were prepared using the CRISPR/Cas9 system, and the gene expression profiles of these cells were determined through RNA-sequencing (Fig. 2A). Although ADPKD exhibits dominant inheritance, actual cyst formation is inherited in a recessive manner. PKD2–/– cells were considered to be cyst cells, and genes whose expression levels were increased or decreased in these cells were considered to be genes with altered expression in the actual renal cysts of ADPKD patients. Changes in the expression of these genes affect the number and extent of cysts and could be predictive indicators. Therefore, genes with altered expression in PKD2–/– cells but not in PKD2+/– cells were selected as potential biomarkers. Among the genes with increased or decreased expression only in PKD2–/– cells as determined by RNA-sequencing analysis, the genes with the highest expression changes and expressed in renal epithelial tubules were subsequently selected. Among these genes, genes that encode secreted proteins that can be detected in urine were selected (Fig. 2B). One such gene was OPN, and mRNA expression level of this gene was assessed by RT-PCR and agarose gel electrophoresis (Fig. 2C).
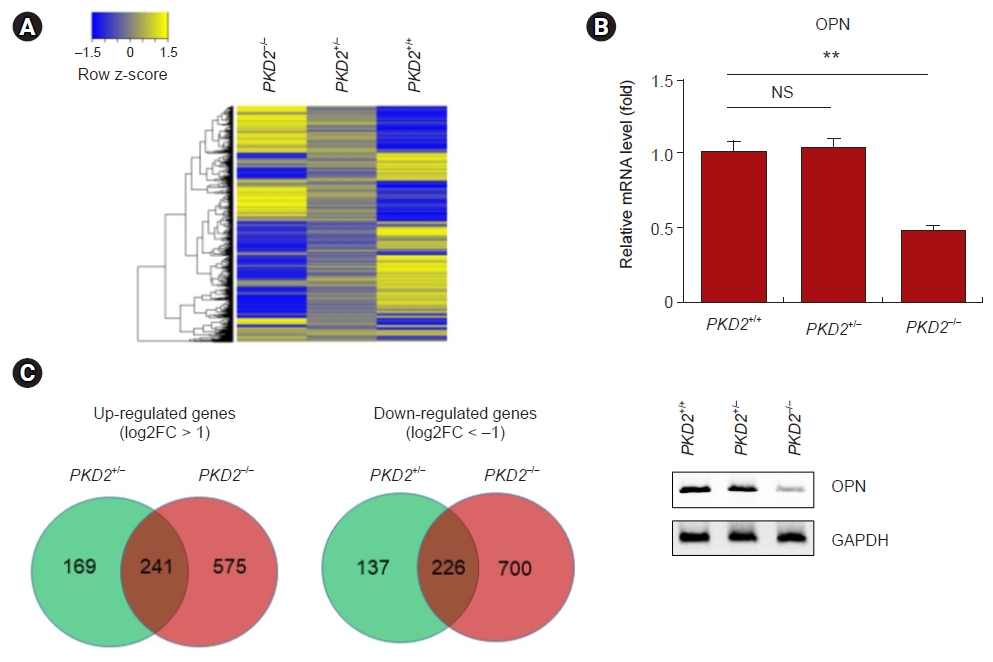
mRNA expression of OPN was reduced in PKD2–/– cells but not in PKD2+/– cells.
(A) Heatmap of genes with different expression levels among normal porcine fibroblasts (PKD2+/+ cells) and porcine fibroblasts with PKD2 mono- and biallelic knockout mediated by CRISPR/Cas9 (PKD2+/– and PKD2–/– cells, respectively). (B) Venn diagram of upregulated and downregulated genes in PKD2+/– and/or PKD2–/– cells compared to PKD2+/+ cells. (C) mRNA expression analysis of PKD2+/+ cells, PKD2+/– cells, and PKD2–/– cells by RT-PCR. Relative expression of OPN among PKD2+/+ cells, PKD2+/– cells, and PKD2–/– cells normalized to the expression of GAPDH.
GAPDH, glyceraldehyde 3-phosphate dehydrogenase; mRNA, messenger RNA; NS, not specific; OPN, osteopontin.
**p < 0.01.
Expression of osteopontin was reduced in renal cysts of patients with autosomal dominant polycystic kidney disease
To confirm whether the mRNA expression level of OPN is decreased in the renal cysts of ADPKD patients, similar to the observations in PKD2–/– porcine fibroblasts, the mRNA expression levels of OPN in renal cyst cells were analyzed by RT-PCR. The results revealed that the OPN mRNA expression levels were significantly reduced in renal cyst cells (Fig. 3A). To determine whether these reductions also affected protein expression, the OPN protein expression levels were assessed by Western blotting analysis. This analysis confirmed that the OPN protein levels were significantly reduced in renal cyst cells (Fig. 3B). Since OPN is a secreted protein, we measured the OPN levels in the supernatants of renal cyst cell cultures and confirmed that these levels were significantly reduced (Fig. 3C).
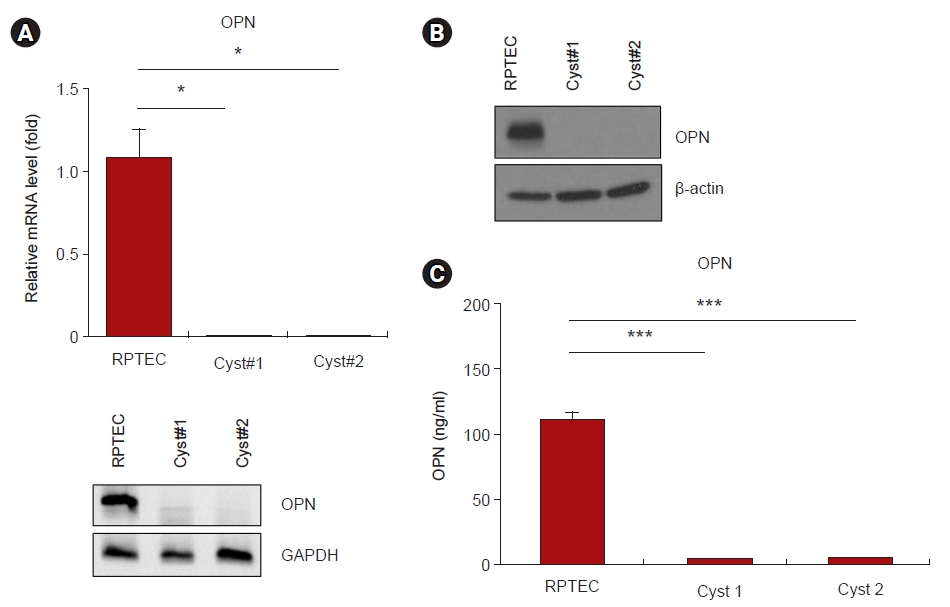
Expression and secretion of OPN were reduced in renal cyst cells from patients with ADPKD.
(A) mRNA expression analysis of RPTECs and two different renal cyst cells from ADPKD patients by real-time polymerase chain reaction. The relative expression of OPN in RPTECs and renal cyst cells was normalized to the expression of GAPDH. (B) OPN protein expression in RPTECs and renal cyst cells. Beta-actin was used as a control for Western blotting. (C) The level of OPN secreted from RPTECs and renal cyst cells was measured by ELISA.
ADPKD, autosomal dominant polycystic kidney disease; ELISA, enzyme-linked immunosorbent assay; GAPDH, glyceraldehyde 3-phosphate dehydrogenase; mRNA, messenger RNA; OPN, osteopontin; RPTEC, renal proximal tubular epithelial cell.
*p < 0.05. ***p < 0.001.
Osteopontin levels in urine from autosomal dominant polycystic kidney disease patients were significantly decreased and further decreased with increasing disease severity
Since the expression of OPN in the renal cyst cells of ADPKD patients and the level of extracellular OPN secretion were decreased, the levels of OPN in urine were tested by ELISA. The levels of OPN were significantly lower in the urine of ADPKD patients than in that of normal individuals, demonstrating the potential for the use of OPN as a biomarker for the diagnosis of ADPKD (Fig. 4A).
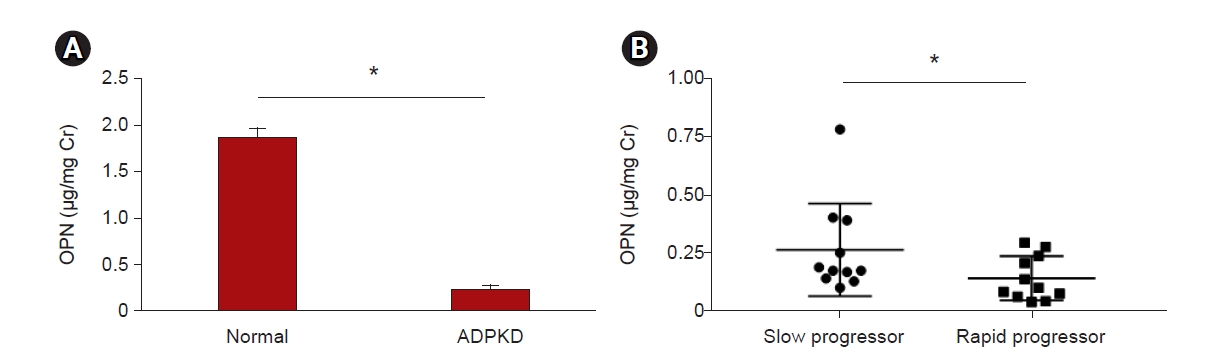
OPN in urine measured by enzyme-linked immunosorbent assay.
(A) Urinary OPN levels from three different normal individuals and ADPKD patients corrected according to creatine levels. (B) Urinary OPN levels were measured in ADPKD patients in the slow progressor group (n = 11) and the rapid progressor group (n = 11).
ADPKD, autosomal dominant polycystic kidney disease; Cr, creatinine; OPN, osteopontin.
*p < 0.05.
In addition, we selected only subjects with estimated glomerular filtration rates (eGFRs) of >60 mL/min/1.73 m2 to determine the ability of using OPN level to diagnose disease progression in early stages. Patients with ADPKD were divided into two groups according to the Mayo classification (class 1A–1E): a rapid progressor group (n = 11) in which disease was classified as class 1C–1E and a slow progressor group (n = 11) in which disease was classified as class 1A–1B [22] (Table 1). The protein levels of OPN in the urine were significantly lower in the rapid progressor group than in the slow progressor group (mean ± standard deviation, 0.1217 ± 0.06629 μg/mg creatinine; p = 0.03) (Fig. 4B). This demonstrates the potential for the use of OPN as a urinary biomarker to predict the severity of ADPKD progression.
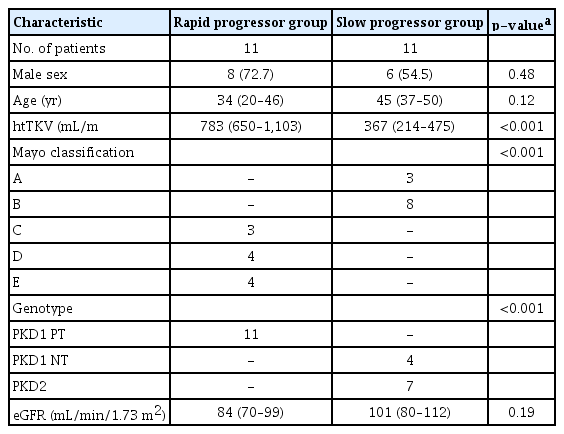
Baseline characteristics between rapid progressor and slow progressor group patients
Discussion
The diagnosis of ADPKD and the prediction of its progression remain difficult. Identification of biomarkers that can predict the progression of ADPKD is particularly challenging. To date, many variables, such as the glomerular filtration rate (GFR), TKV, and ADPKD genotype, have been used to predict ADPKD progression [22–26]. The GFR is an indicator of changes in kidney function, and TKV is an indicator of the number and size of renal cysts in patients with ADPKD. The GFR and TKV alone, however, are ineffective as biomarkers in the early stages of ADPKD; and, when linked to genotype analysis, these are expensive and have limitations for each individual patient. The predicting renal outcomes in ADPKD (PROPKD) score, which combines various factors such as sex, ADPKD genotype, and the presence of hypertension before the age of 35 years, also has limitations; this score can be applied only to patients older than 35 years of age and patients with the necessary clinical information available [26]. Identification of a meaningful biomarker in urine that can directly indicate the status of the kidneys in ADPKD patients would be superior to a blood biomarker. Measuring the urinary excretion of β2-microglobulin (β2MG) and monocyte chemotactic protein 1 (MCP-1) is more effective for predicting the rapid progression of ADPKD than measuring TKV and assessing genotype [27]. However, since β2MG and MCP-1 are factors that indicate tubular damage, their levels are also increased in patients with kidney diseases other than ADPKD, such as chronic kidney disease (CKD) and diabetic kidney disease. Therefore, although easy and inexpensive to measure, these urinary biomarkers do not predict ADPKD alone or distinguish ADPKD from other kidney diseases. For this reason, among the numerous proteins that are related to ADPKD, we focused on biomarkers found in urine. In addition, biomarkers in urine can predict not only a patient’s current condition but also the future progression of the disease. To examine possible biomarkers, we genetically targeted PKD2, the pathogenic gene of ADPKD, using the CRISPR/Cas9 genome editing method to create a cyst-like PKD2-knockout cell model. We selected kidney-expressed, urine-excreted gene products whose expression was altered in these porcine fibroblasts as being candidate urinary biomarkers of ADPKD. The expression of these genes was verified by various methods, such as RT-PCR and ELISA.
In this study, we found that the OPN levels were reduced in both PKD2 biallelic knockout porcine fibroblasts and renal cyst cells from ADPKD cohort patients. In addition, we confirmed that the urinary OPN levels of ADPKD patients were lower than those of normal controls. OPN is suggested to be an early biomarker of the renal progression of ADPKD given that, among ADPKD patients with eGFRs of 60 mL/min/1.73 m2 or higher, the OPN levels were lower in rapid progressors. Although the average urinary OPN levels between slow progressors and rapid progressors differed, most of the values overlapped between these groups. This may be because the patient group was divided simply according to the Mayo classification. This suggests the need for further research on additional subgroups considering various factors, such as age and patient genotypes, in the future.
OPN is a secreted phosphorylated glycoprotein that is expressed in multiple cells, such as osteoblasts, natural killer cells, smooth muscle, activated T cells, macrophages, epithelial cells, endothelial cells, neurons, adipocytes, bone cells, kidney cells, and inflammatory cells. OPN plays a multifunctional role as a cytokine and adhesion protein and contains an integrin-binding sequence and an adhesive protein-binding sequence. OPN has been implicated in physiological and pathological processes such as bone remodeling, cellular immunity, and tissue injury. OPN activates intracellular signaling pathways and regulates gene expression through its interactions with various receptors [16,28].
In humans, OPN is expressed in the kidneys and secreted into urine and is associated with several renal diseases. Several studies have shown that OPN can be used as a biomarker of kidney diseases. OPN expression is increased in renal diseases, such as kidney cancer, immunoglobulin A nephropathy, minimal change disease, and diabetic nephropathy [16]. These studies suggested that OPN expression is closely related to the pathogenesis of renal failure and can be used as an indicator of kidney damage. In particular, previous studies have demonstrated that the levels of OPN in the urine of patients with CKD are elevated [19]. However, in the present study, we found that OPN levels were significantly reduced in PKD2-knockout porcine fibroblasts and in the renal cyst cells and urine of ADPKD patients. This OPN expression pattern is the opposite of that seen in CKD patients. The expression of OPN is reduced in osteoblasts in which PKD1 expression was silenced by short hairpin RNA (shRNA) as well as in PKD1-knockout mice [29,30]. Polycystin-1, a PKD1-encoded protein, activates the Akt/glycogen synthase kinase 3β (GSK-3β)/β-catenin pathway, resulting in the expression of Runt-related transcription factor 2 (RUNX2), an activator of OPN. In the context of PKD1 deficiency, phospho-Akt and phospho-GSK-3β levels are reduced; and decreases in the levels of active β-catenin in the nucleus result in decreased OPN levels [29]. In a mouse model in which the osteoblast-specific PKD2 gene is deleted, the RUNX2 levels and OPN levels are reduced [31]. Thus, under conditions of PKD1 or PKD2 deficiency, similar to observations in renal cysts, the expression levels of OPN in the kidneys may be reduced. Unlike patients with CKD, ADPKD patients exhibit decreased expression and urinary secretion of OPN. Therefore, OPN is potentially a good urinary biomarker for the differential diagnosis of ADPKD from CKD and for the prediction of the severity of ADPKD in patients. Further studies on whether renal damage, such as fibrosis and inflammation, in patients with ADPKD affects the urinary or plasma levels of OPN and the role of OPN gene polymorphisms are needed. These studies should include assessment of the expression of both full- and N-half-length OPN.
Notes
Conflicts of interest
All authors have no conflicts of interest to declare.
Funding
This work was carried out with the support of the Cooperative Research Program for Agriculture Science & Technology Development (Project No. PJ016222), Rural Development Administration, Republic of Korea.
Authors’ contributions
Conceptualization: Hyunho Kim
Formal analysis: Hyunsuk Kim, JS, JYB, PL, Hyunho Kim
Investigation: Hyunsuk Kim, JS
Methodology: Hyunho Kim, YKO
Resources: Hyunho Kim, YKO
Writing–original draft: Hyunsuk Kim, YKO, Hyunho Kim
Writing–review & editing: Hyunsuk Kim, YKO, Hyunho Kim
All of the authors read and approved the final manuscript.