Performance evaluation of Chronic Kidney Disease Epidemiology Collaboration equations for estimated glomerular filtration rate compared to inulin clearance in Koreans
Article information

Abstract
Background
A race-free glomerular filtration rate (GFR) estimation equation has recently been developed. However, the performance of the new Chronic Kidney Disease Epidemiology Collaboration (CKD-EPI) equations needs to be evaluated in Asian populations.
Methods
We performed a cross-sectional study at a single center in South Korea. The measured GFR (mGFR) was determined based on systemic inulin clearance. The GFR was estimated using the five CKD-EPI equations: 2009 CKD-EPIcr, 2012 CKD-EPIcr-cys, 2012 CKD-EPIcys, 2021 CKD-EPIcr, and 2021 CKD-EPIcr-cys. The performances of five estimated GFR (eGFR) equations were assessed by bias, precision, and accuracy (percentage of estimates within 30% of mGFR).
Results
The median mGFR and interquartile range (IQR) was 53.5 (32.4–80.0) mL/min/1.73m2. The mGFR better correlated with 2009 CKD-EPIcr (ρ = 0.628) and 2021 CKD-EPIcr-cys (ρ = 0.806) than with 2021 CKD-EPIcr (ρ = 0.623) and 2012 CKD-EPIcr-cys (ρ = 0.801). The median bias of 2009 CKD-EPIcr and 2012 CKD-EPIcr-cys were lower than those of 2021 CKD-EPI equations (2009 CKD-EPIcr, 2.24 [IQR, –8.83 to 17.39] vs. 2021 CKD-EPIcr, 5.40 [IQR, –6.04 to 20.40]; 2012 CKD-EPIcr-cys, 6.74 [IQR, –2.81 to 20.80] vs. 2021 CKD-EPIcr-cys, 10.54 [IQR, 0.30–24.37]; all in mL/min/1.73 m2). The percentage of eGFR values within 30% of mGFR was higher in 2009 CKD-EPIcr and 2012 CKD-EPIcr-cys equations than 2021 CKD-EPI equations. The CKD prevalence in 2009 CKD-EPIcr, 2021 CKD-EPIcr, 2012 CKD-EPIcr-cys, and 2021 CKD-EPIcr-cys was 54.8%, 51.0%, 47.7%, and 44.8%, respectively.
Conclusion
Our study demonstrated better performance of the original CKD-EPIcr and CKD-EPIcr-cys equations than the 2021 new CKD-EPI equations. We do not recommend the adoption of the new CKD-EPI equations in Korea.
Introduction
Glomerular filtration rate (GFR) is considered the best overall indicator of kidney function [1], and its estimation is vital for the early detection and management of chronic kidney disease (CKD). Accurate and reproducible GFR estimation also helps understand the prevalence of CKD.
Modification of Diet in Renal Disease (MDRD) equations using creatinine, age, sex, and race were released in 1999 [1]; however, they inherently have several problems, including limited precision and underestimation of relatively higher kidney function. A new equation, the Chronic Kidney Disease Epidemiology Collaboration (CKD-EPI) creatinine (CKD-EPIcr), was reported to have higher accuracy in 2009 [2] and has been used globally to estimate GFR. Other CKD-EPI equations using cystatin C alone (CKD-EPIcys) or cystatin C and creatinine (CKD-EPIcr-cys) have been subsequently published [3]. The CKD-EPIcr-cys equation showed the best performance and is used as a confirmatory test for CKD.
Cystatin C and creatinine levels are affected by demographics; therefore, age, sex, and race were included in the estimation of GFR. However, there have been many criticisms about race inclusion in estimating GFR; race is a social and not a biological concept, and it may contribute to systemic racism in medicine [4]. Therefore, new creatinine- and cystatin C-based equations to estimate GFR without race were reported in 2021 [4].
GFR estimation using the 2021 CKD-EPI equation resulted in a substantial reclassification of CKD grade staging, especially for stages 2 and 3a. Estimated GFR (eGFR) <60 60 mL/min/1.73m2 increased by 2.9% in Blacks and decreased by 1.6% in other races. However, CKD-related complication prevalence was not substantially altered [5]. The 2021 CKD-EPI equation did not significantly differ from the original CKD-EPI equation in kidney transplant recipients [6]. However, eGFR recalculation using the 2021 CKD-EPI equation showed potentially important effects on event rates and efficacy estimates in a clinical trial [7].
Here, we compared the performance of the CKD-EPI equations with the measured GFR (mGFR) to identify whether adopting the 2021 CKD-EPI equations in South Korea is appropriate. We aimed to demonstrate the differences in performance between 2009, 2012, and 2021 CKD-EPI equations in the population included in the study of the Korean coefficient of MDRD equations [8,9] and the reclassification of CKD stages according to each eGFR equation.
Methods
Study setting and population
We conducted retrospective cross-sectional analyses using the previously constructed dataset from the study for the Korean coefficient of MDRD equations conducted at the Seoul National University Hospital in 2008 and 2013 [9]. The study population consisted of individuals of Korean ethnicity. The inclusion criteria for the previous study were: 1) participants aged ≥18 years, regardless of previous kidney disease, and 2) those who agreed to participate in the study and voluntarily signed on informed consent. The study included both CKD and healthy volunteers. All healthy volunteers exhibited normal urinalysis and systemic inulin clearances >60 mL/min/1.73 m2. The exclusion criteria were: 1) rapid decline of kidney function within 3 months, 2) proteinuria >10 g/day or serum albumin <2.5 g/dL, 3) presence of edema or ascites, 4) active infection, 5) history of coronary artery intervention including coronary artery bypass graft or percutaneous coronary intervention within 1 year, 6) abnormal liver function tests, 7) history of severe allergy, 8) pregnant or lactating female, 9) gross hematuria, 10) oliguria (<500 mL/day), and 11) history of kidney replacement therapy including dialysis or kidney transplantation.
Ethical statement
This study was approved by the Institutional Review Board of the Seoul National University Hospital (No. H-2302-107-1407), and the informed consent was waived because we utilized previously collected clinical data and laboratory results. This study was conducted in accordance with the principles of the Declaration of Helsinki.
Measurement of glomerular filtration rate
We used sinistrin (Inutest 25%; Fresenius Kabi Austria GmbH), an inulin analog, to measure GFR in previous studies because of its water solubility and ease of handling [10]. We used systemic inulin clearance as mGFR due to its more simple and fairly accurate measurement of true GFR, although urinary inulin clearance is the gold standard for measuring GFR [11–13]. A single-shot method was performed, and six consecutive blood samples (5, 10, 15, 30, 75, and 150 minutes after the injection) were collected as in the previous studies [8,14,15]. The inulin concentration (g/mL) was determined using the high-performance liquid chromatography method [16]. The mGFR was determined by systemic inulin clearance, calculated by dividing the infusion dose by the area under the curve obtained by curve fitting.
Measurement of serum creatinine and cystatin C
Serum creatinine (SCr) was measured using the alkaline picrate Jaffé kinetic method with a Hitachi 7600 analyzer (200FR; Toshiba). The assay was calibrated to standardized creatinine measured using the isotope-dilution mass spectrometry standard with the following corrected equations: calibrated SCr = 1.07 × measured SCr – 0.2 (mg/dL) until December 2010; and calibrated SCr = 1.00 × measured SCr – 0.3 (mg/dL) since January 2011. Serum cystatin C levels were measured using a particle-enhanced immunoturbidimetric assay on a COBAS 6000 analyzer (Roche Diagnostics).
Estimation of glomerular filtration rate
The eGFR was calculated using the following five CKD-EPI equations: (1) 2009 CKD-EPIcr [2], (2) 2012 CKD-EPIcr-cys, (3) 2012 CKD-EPIcys [3], (4) 2021 CKD-EPIcr, and (5) 2021 CKD-EPIcr-cys [4]. Equations (1) to (3) incorporated standardized creatinine levels, age, sex, and race, whereas new eGFR equations (4) and (5) redact racial coefficients.
Statistical analyses
Categorical variables were described as numbers (percentages) and continuous variables as means ± standard deviations (SDs) if normally distributed or medians (interquartile ranges, IQR) if nonnormally distributed.
The performance of the eGFR equations was determined by measuring the bias, precision, and accuracy. Linear regressions were performed by comparing the five eGFRs to the mGFR (systemic inulin clearance). The degree of linear correlation was estimated using the Pearson correlation coefficient (ρ). The bias of the five eGFR equations was calculated by subtracting mGFR from eGFR and expressed as median bias (IQR), absolute bias, and percentage bias with 95% confidence intervals (CIs) were assessed. The precision was defined as the SD of the difference between mGFR and eGFR values. The accuracy of the five eGFR equations was measured as the percentage of study participants with eGFR values within 15% (P15), 30% (P30), and 50% (P50) of the mGFR. The P30 value indicates clinical accuracy and is used to achieve good medical decision-making based on eGFR. Subgroup analysis according to eGFR categories was conducted to evaluate generalizability among eGFR categories. The differences of mGFR and eGFR estimates were assessed using the Wilcoxon signed-rank test and paired t test. Two-sided p-value of <0.05 was considered significant. Scatter plots with linear regression were used to visualize the distribution of mGFR and eGFR values calculated from five eGFR equations. Bland-Altman plots were used to assess the agreement between each eGFR equation and mGFR [17].
The participants were classified into the 2012 Kidney Disease Improving Global Outcomes (KDIGO) GFR categories according to the mGFR and five eGFR equations: G1, ≥90; G2, ≥60 and <90; G3a, ≥45 and <60; G3b, ≥30 and <45; G4, ≥15 and <30; and G5, <15 mL/min/1.73 m2. The concordance rates between the mGFR and each of the five eGFRs were assessed using Lin’s concordance correlation coefficient (CCC). The proportion of CKD was evaluated according to each eGFR equation, and CKD was defined as a GFR <60 mL/min/1.73 m2. All statistical analyses were performed using R version 4.2.3 (R Foundation for Statistical Computing).
Results
Baseline characteristics
This study included 239 participants (patients with CKD, n = 201; healthy volunteers, n = 38). Participants’ baseline characteristics are described in Table 1. The mean age was 49.4 ± 15.9 years, and 40.5% were female. Among patients with CKD, the most common etiologies of CKD were glomerulonephritis (31.8%), hypertension (17.9%), and diabetes mellitus (14.4%). The median mGFR (mL/min/1.73 m2) was 53.5 (IQR, 32.4–80.0; ≥60 [42.3%], ≤30 and <60 [36.3%], and <30 [21.3%], respectively). The median eGFR (mL/min/1.73 m2) calculated by the 2009 CKD-EPIcr equation was the lowest (56.4; IQR, 36.2–87.7), while the median eGFR (mL/min/1.73 m2) calculated by the 2012 CKD-EPIcys equation was the highest (74.3; IQR, 36.8–116.1).
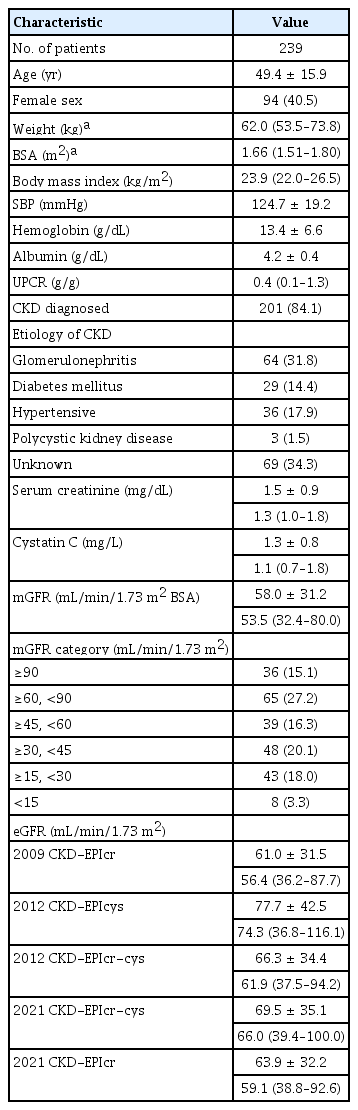
Baseline characteristics of the study participants
Bias, precision, and accuracy of 2009, 2012, and 2021 CKD-EPI estimated glomerular filtration rate equations
The intercepts and slopes of each linear regression with the performances expressed as bias, precision, and accuracy are presented in Table 2. The slope of the 2009 CKD-EPIcr equation (0.61; 95% CI, 0.51–0.71) was closer to the identity line than that of the 2021 CKD-EPIcr equation (0.59; 95% CI, 0.5–0.69). The slope of the 2012 CKD-EPIcr-cys equation (0.71; 95% CI, 0.64–0.78) was also closer to the identity line than that of the 2021 CKD-EPIcr-cys equation (0.70; 95% CI, 0.64–0.77). The slope was largest in the 2012 CKD-EPIcys equation (0.57; 95% CI, 0.52–0.63). Fig. 1 shows scatter plots with regression lines for each eGFR equation against mGFR values. mGFR better correlated with 2009 CKD-EPIcr (ρ = 0.628) than with 2021 CKD-EPIcr (ρ = 0.623), while 2021 CKD-EPIcr-cys (ρ = 0.806) correlated better than 2012 CKD-EPIcr-cys (ρ = 0.801) with mGFR.
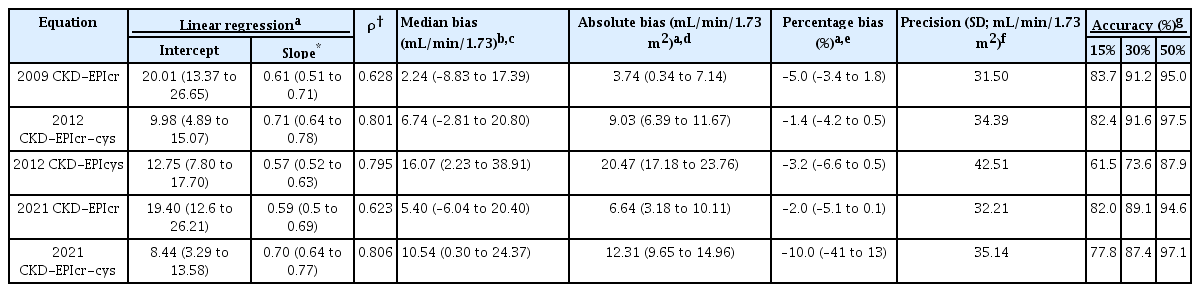
Performance characteristics of GFR estimates calculated by five eGFR equations against mGFR
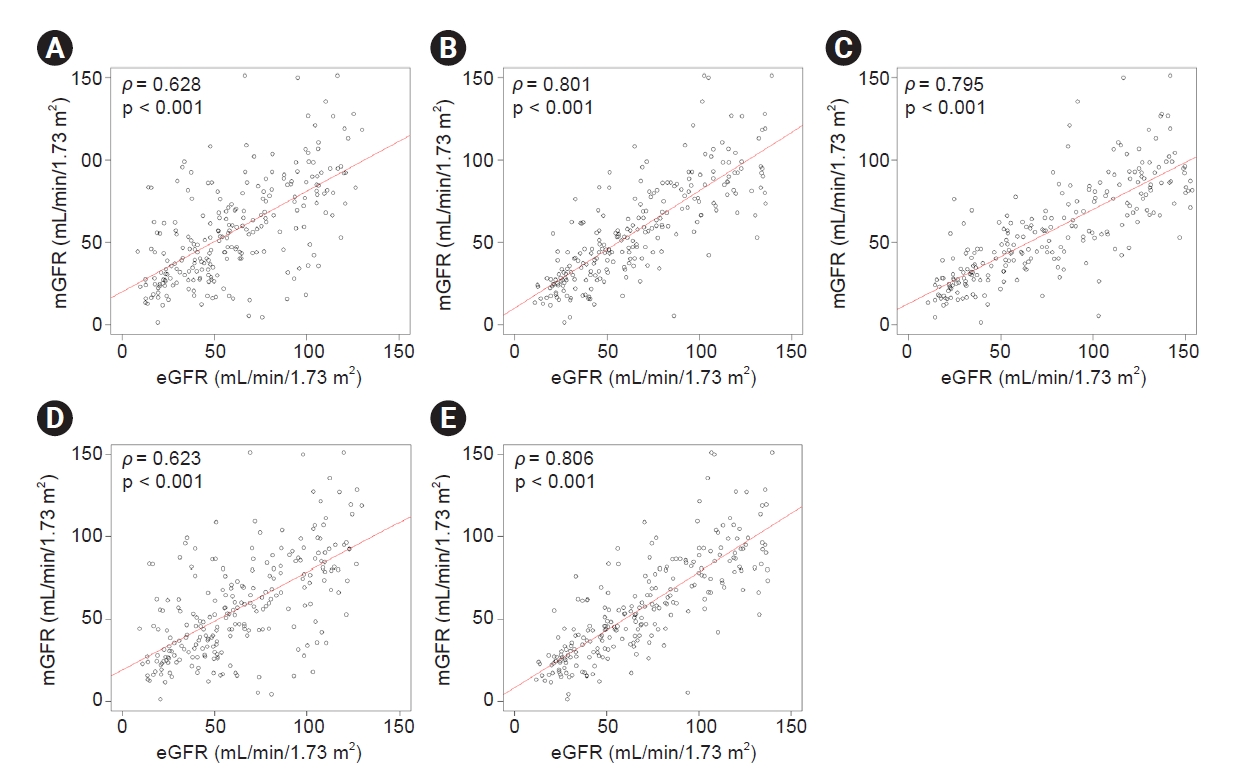
Scatter plots and linear regression lines of mGFR with each of the estimating equations.
(A) 2009 CKD-EPIcr, (B) 2012 CKD-EPIcr-cys, (C) 2012 CKD-EPIcys, (D) 2021 CKD-EPIcr, and (E) 2021 CKD-EPIcr-cys.The mGFR values are plotted on the y-axis and the eGFR values of the five CKD-EPI equations are plotted on the x-axis.
CKD-EPI, Chronic Kidney Disease Epidemiology Collaboration; cr, creatinine; cys, cystatin C; mGFR, measured glomerular filtration rate; eGFR, estimated glomerular filtration rate; ρ, Pearson correlation coefficient.
All five equations showed an overestimation of mGFR, and the eGFR calculated by the 2012 CKD-EPIcys was overestimated the most among the five equations. The median bias was lower when eGFR (mL/min/1.73 m2) was calculated with the 2009 CKD-EPIcr equation (2.24; IQR, –8.83 to 17.39) than with the 2021 CKD-EPIcr equation (5.40; IQR, –6.04 to 20.40). The median bias was larger in 2021 CKD-EPIcr-cys (10.54; IQR, 0.30 to 24.37) than 2012 CKD-EPIcr-cys (6.74; IQR, –2.81 to 20.80). The absolute and percentage bias showed a concordant result to that of the median bias. The mean biases and 95% CIs for each eGFR equation are displayed in the Bland-Altman plots (Fig. 2). The precision was better in 2009 CKD-EPIcr equation than in the 2021 CKD-EPIcr equation (SD, 31.50 vs. 32.21). The 2012 CKD-EPIcr-cys equation presented better precision compared to 2021 CKD-EPIcr-cys equation (SD, 34.39 vs. 35.14). Accuracy was higher in the 2009 CKD-EPIcr equation than in the 2021 CKD-EPIcr equation, as demonstrated by P15, P30, and P50 (83.7%/91.2%/95.0% and 82.0%/89.1%/94.6%, respectively). The accuracy of the 2012 CKD-EPIcr-cys equation was also higher than that of the 2021 CKD-EPIcr-cys equation (82.4%/91.6%/97.5% and 77.8%/87.4%/97.1%, respectively). The 2012 CKD-EPIcys equation showed the highest median bias and the lowest precision and accuracy (bias, 16.07 [IQR, 2.23–38.91]; SD, 42.51; accuracy, 61.5%/73.6%/87.9%).

Bland-Altman plots for the concordance rate between mGFR and eGFR.
(A) 2009 CKD-EPIcr, (B) 2012 CKD-EPIcr-cys, (C) 2012 CKD-EPIcys, (D) 2021 CKD-EPIcr, and (E) 2021 CKD-EPIcr-cys. The x-axis of the plot presents the average measurement of the mGFR and eGFR, and the y-axis presents the difference between mGFR and eGFR. The black line indicates the average difference in measurement between mGFR and eGFR, and the two red dotted lines represent the 95% confidence interval limits for the average difference.
CKD-EPI, Chronic Kidney Disease Epidemiology Collaboration; cr, creatinine; cys, cystatin C; eGFR, estimated glomerular filtration rate; mGFR, measured glomerular filtration rate.
The subgroup analysis presented concordant results with the main findings, showing the bias and precision of 2021 CKD-EPI equation lower than those of the 2009 CKD-EPIcr and 2012 CKD-EPIcr-cys equation across eGFR categories (Supplementary Table 1, available online). Patients with lower eGFR exhibited an increased degree of bias while showing decreased precision and accuracy.
Glomerular filtration rate category concordance and chronic kidney disease proportion
The concordance and Lin’s CCC between the eGFRs and mGFR are shown in Table 3. Compared with the 2009 CKD-EPIcr equation, a larger degree of overestimation in the eGFR category was found in the 2021 CKD-EPIcr equation. Specifically, the 2021 CKD-EPIcr equation classified 96 participants in the higher eGFR category than the mGFR category, whereas the 2009 CKD-EPIcr equation classified 84 participants in the higher category. The 2012 CKD-EPIcr-cys equation misclassified 29 participants in the higher eGFR category, whereas the 2021 CKD-EPIcr-cys equation misclassified 23 participants.
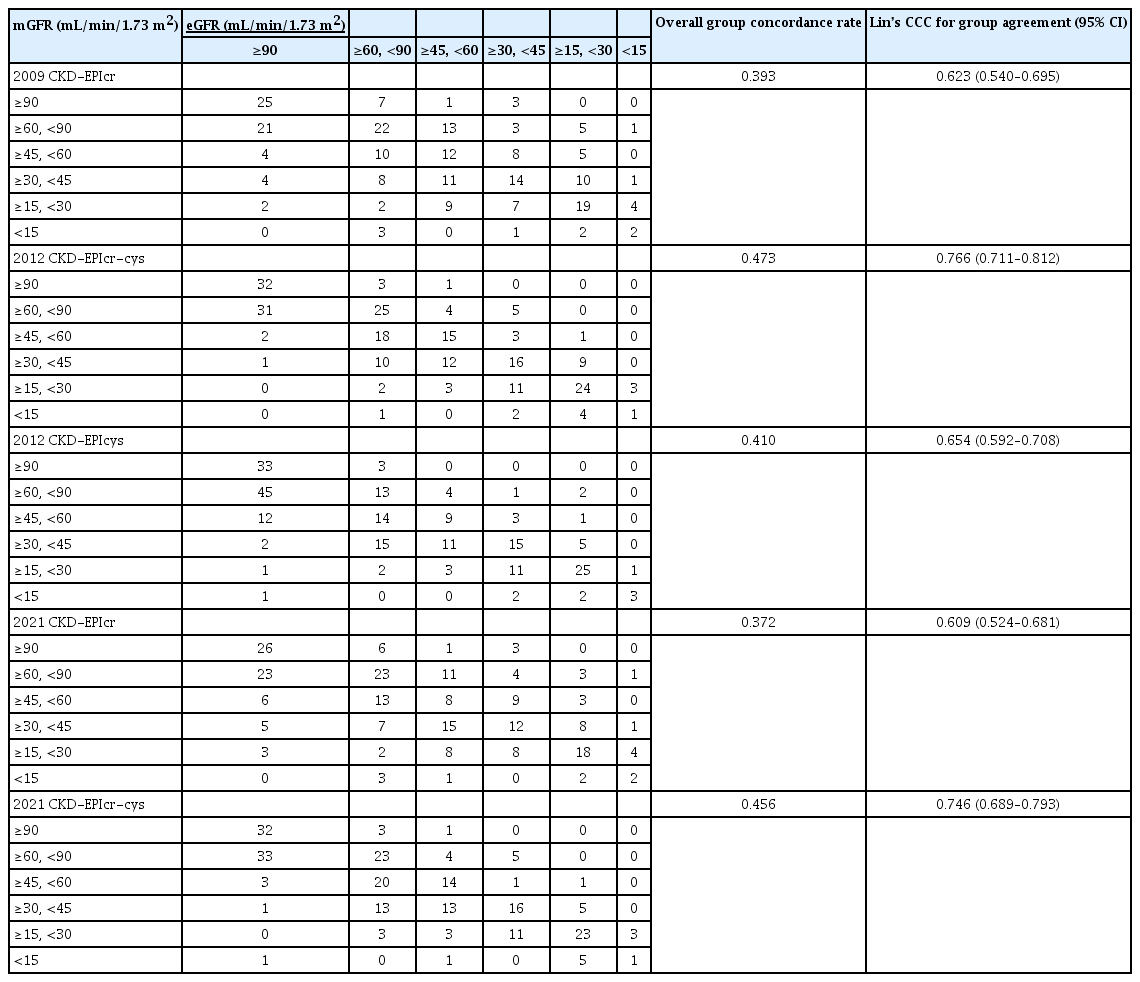
Distribution of study population and concordance rate according to mGFR and eGFR categories
The overall concordance rate and Lin’s CCC of the GFR category between mGFR and eGFR were 0.393 and 0.623 (95% CI, 0.540–0.695) for 2009 CKD-EPIcr, and 0.372 and 0.609 (95% CI, 0.524–0.681) for 2021 CKD-EPIcr, respectively. The corresponding values for the 2012 CKD-EPIcr-cys (0.473 and 0.766; 95% CI, 0.711–0.812) were superior to those for the 2021 CKD-EPIcr-cys (0.456 and 0.746; 95% CI, 0.689–0.793). The 2012 CKD-EPIcr-cys showed the highest overall concordance rate and Lin’s CCC among the five equations.
Using the five eGFR equations, the prevalence of CKD was examined to assess the clinical implications of using different eGFR equations (Fig. 3A). The CKD prevalence of 2009 CKD-EPIcr, 2021 CKD-EPIcr, 2012 CKD-EPIcr-cys, 2021 CKD-EPIcr-cys, and 2012 CKD-EPIcys was 54.8%, 51.0%, 47.7%, 44.8%, and 41.0%, respectively. We evaluated the distribution of the study population across the KDIGO GFR categories using five CKD-EPI equations (Fig. 3B). The proportion of G2 was higher in 2021 CKD-EPIcr (25.9%) compared to 2009 CKD-EPIcr (21.8%). In contrast, the proportion of G3a was lower in 2021 CKD-EPIcr (18.4%) than in 2009 CKD-EPIcr (19.2%). The proportion of eGFR categories G3a and G3b was higher in 2009 CKD-EPIcr (34.3%) compared to 2021 CKD-EPIcr (33.5%). In addition, the proportions of G4 and G5 were higher in 2009 CKD-EPIcr (20.5%) than in 2021 CKD-EPIcr (17.5%). The 2012 and 2021 CKD-EPIcr-cys datasets showed similar patterns.
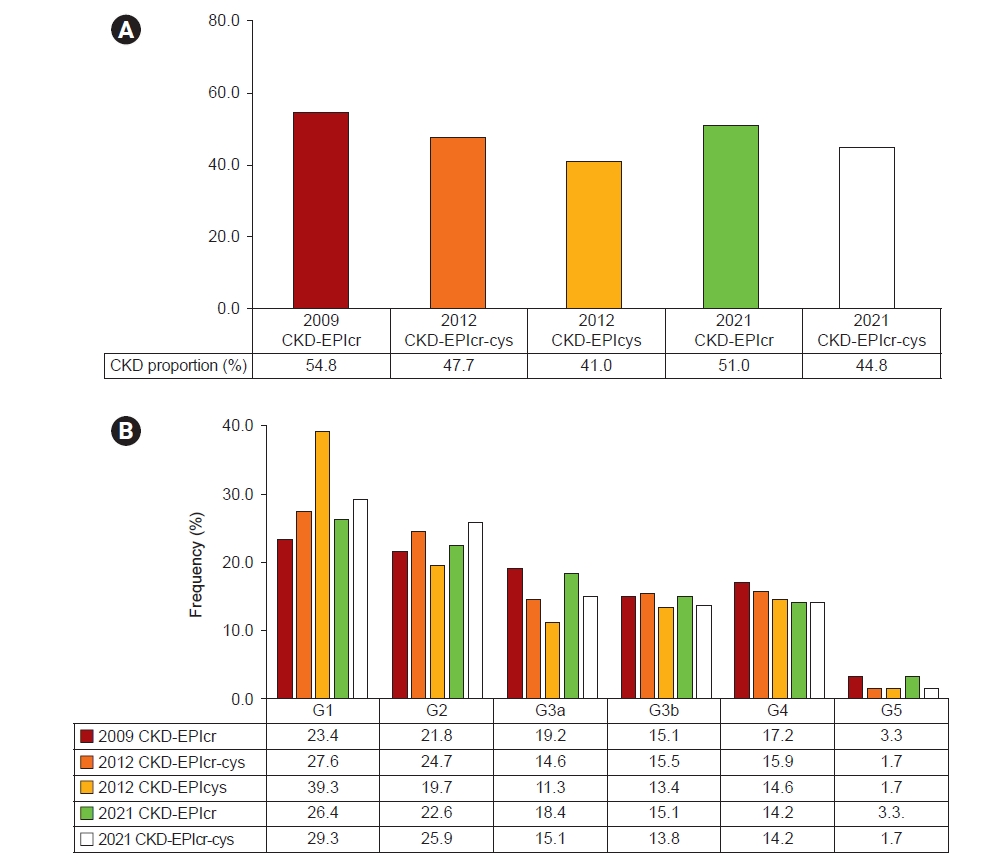
CKD prevalence and eGFR categories.
(A) CKD prevalence and (B) the distribution of eGFR categories according to CKD-EPI equations. CKD was defined as patients with eGFR <60 mL/min/1.73 m2. The eGFR categories are classified as follows: G1, ≥90; G2, ≥60 and <90; G3a, ≥45 and <60; G3b, ≥30 and <45; G4, ≥15 and <30; and G5, <15 mL/min/1.73 m2.
CKD, chronic kidney disease; CKD-EPI, Chronic Kidney Disease Epidemiology Collaboration; cr, creatinine; cys, cystatin C; eGFR, estimated glomerular filtration rate.
Discussion
In this study, we evaluated the performance of five CKD-EPI equations developed in 2009, 2012, and 2021 and compared them with mGFR values in a Korean cohort. The 2009 and 2012 CKD-EPIcr-cys equations exhibited lower median bias and higher accuracy than the 2021 CKD-EPIcr and CKD-EPIcr-cys equations. Regarding the concordance rates of mGFR and eGFR categories, the 2012 CKD-EPIcr-cys equation exhibited the highest concordance rate. The concordance rates of the 2009 CKD-EPIcr and 2012 CKD-EPIcr-cys equations were higher than those of the 2021 CKD-EPIcr and CKD-EPIcr-cys equations. Misclassifications of CKD stages into higher classes were more prevalent in the 2021 equations than in the 2009 equations.
Accurate estimation of GFR is crucial in clinical contexts as GFR thresholds are widely used as a criterion for diagnosis and guidance of medical therapy [18–20]. Previously developed eGFR equations, including the MDRD and 2009 and 2012 CKD-EPI equations, incorporate race coefficients for Black individuals [1–3]. However, race coefficients were criticized because “race” is not a biological proxy but a sociocultural construct, and incorrect use of race may negatively affect health equity [21]. Therefore, along with attempts to examine the traditional medical practice that comprises race modifiers [22], a new GFR estimating equation without racial coefficient was developed by the National Kidney Foundation and American Society of Nephrology [4]. Although 2021 CKD-EPIcr-cys equations minimized inaccuracy for non-Black and Black groups, 2021 CKD-EPIcr equations exhibited larger biases in both race groups. Specifically, the differential bias between racial groups observed in the 2021 CKD-EPIcr equation resulted in significant differences in the prevalence of CKD and GFR stages, which could potentially lead to systemic differences in medical services for these populations [4]. Therefore, further validation studies are needed across a diverse range of racial groups, and the clinical implications of these findings should be addressed.
The 2021 CKD-EPIcr equation assigned a higher eGFR to non-Black persons compared to the 2009 CKD-EPIcr equation, decreasing the prevalence of CKD [4]. In a European study for external validation [23], higher bias and lower accuracy were also observed in the 2021 CKD-EPIcr equation compared to the 2009 CKD-EPIcr or European Kidney Function Consortium (EKFC) equation [24]. However, it is essential to note that the developmental cohort of the EKFC equation differs from that of the 2021 CKD-EPI equation, resulting in decreased performance.
Transitioning from 2009 to 2021 CKD-EPIcr equation in calculating eGFR resulted in approximately 3 to 5 mL/min/1.73 m2 increase in non-Black individuals [5,25–28]. The overestimation of eGFR reclassified up to 30% of individuals into the higher GFR category. This may potentially lead to the underdiagnosis of kidney diseases, unnecessary discontinuation or initiation of medications, and delays in planning for dialysis [18–20,28]. In addition, the Asian population was not evaluated as a distinct racial group, as the 2021 CKD-EPIcr developmental study categorized participants into two ethnic groups: Black and White. Therefore, the performance of the new equations in Asian populations must be validated to understand their clinical implications. Currently, the 2009 CKD-EPI and 2012 CKD-EPI equations are universally applied in estimating GFR in all clinical laboratories in Korea [29]. Given the substantial socioeconomic and medical changes that may result from the change in eGFR equations [28], it is crucial to comprehensively evaluate the current standard and novel GFR estimating equations before adopting the 2021 CKD-EPI equations in Korea.
In this study, the 2009 CKD-EPIcr equation demonstrated better performance than the 2021 CKD-EPIcr equation for estimating GFR, supported by lower bias, higher accuracy, and higher agreement with mGFR in the 2009 CKD-EPIcr. The 2021 CKD-EPIcr equation demonstrated a greater tendency to overestimate eGFR, leading to a higher transition rate to a higher eGFR category than the 2009 CKD-EPIcr equation. The proportion of G2 was higher in 2021 CKD-EPIcr (25.9%) compared to 2009 CKD-EPIcr (21.8%), whereas the proportion of G3a was lower in 2021 CKD-EPIcr (18.4%) than in 2009 CKD-EPIcr (19.2%). The overall proportion of eGFR category G3 was higher in 2009 CKD-EPIcr (34.3%) compared to 2021 CKD-EPIcr (33.5%). The discrimination of G2 and G3a stages is crucial because various complications of decreased GFR, such as anemia, malnutrition, bone disease, neuropathy, and decreased quality of life, begin to rise when GFR declines to <60 mL/min/1.73 m2 [30]. Furthermore, according to the KDIGO and Korean Society of Nephrology current guidelines, CKD patients with eGFR <60 mL/min/1.73 m2 combined with proteinuria >0.5 g/day or eGFR <30 mL/min/1.73 m2 (GFR categories G4) should be referred to a nephrologist [20,31–34]. An overestimation of eGFR may delay timely referral to a nephrologist and disrupt preparation for kidney replacement therapy, which should ideally begin during G4 [20,30,35]. Delayed referral to nephrologists increases the risk of cardiovascular and overall survival, medical expenses, and quality of life [36].
Moreover, the switch from 2009 to 2021 CKD-EPIcr equation showed a net decrease of 3.8% in CKD prevalence, specifically in the G4 category (17.2% to 14.2%). Our findings are consistent with those of a previous study that compared the accuracy of the 2009 and 2021 CKD-EPIcr equations in approximately 40,000 participants, including Black and non-Black individuals. A net decrease of 5.1% in patients classified as eGFR <20 mL/min/1.73 m2 in non-Black patients was observed, indicating the inferior performance of the 2021 CKD-EPIcr equation in classifying patients with CKD at lower eGFR [26]. Patients with lower eGFR, who are near critical decision thresholds, are particularly vulnerable to changes in CKD stages, as an increase in GFR estimates does not signify an improvement of the underlying kidney function. The transition to a higher GFR category may preclude patients with a lower GFR from receiving appropriate medical practices [28].
Our study had some limitations. First, due to the small sample size recruited from a single center, our findings may not reflect the effect of the new CKD-EPIcr equation on the overall Korean population. As a small sample size increases bias, it is important not to neglect the possibility of significant differences based on null findings in this study. Furthermore, the study population includes a very small proportion of patients with eGFR <15 mL/min/1.73 m2 (3.3%). The result of this study may not be applicable to these patients. Second, the differences in estimating the bias might have occurred because of different urinary or plasma exogenous filtration markers compared with previous studies. For example, urinary clearance of iothalamate, plasma clearance of iohexol, or 51Cr-ethylenediaminetetraacetic acid was used to measure GFR in a developmental study of a new eGFR equation. In contrast, systemic inulin clearance was used in our study. Third, the presence of CKD in the study population was calculated based on eGFR measurements without considering albuminuria. Fourth, long-term clinical outcomes driven by discrepancies between the 2009 and 2021 eGFR equations, including mortality, reduction in kidney function, and kidney replacement therapy, were not investigated. Hence, further investigation of the long-term prognosis is necessary. Also, there is a possibility of additional eGFR overestimation due to tubular secretion of creatinine in advanced CKD because our study participants had lower kidney function compared to the previous race-free eGFR equation developmental study [4].
In conclusion, our study demonstrated a higher bias and lower accuracy of the 2021 CKD-EPI equations compared to the 2009 CKD-EPIcr or 2012 CKD-EPIcr-cys equations, the current standards for estimating GFR in Korea. Given the potential economic burden associated with the national modification of the GFR estimation system, possible underestimation of CKD prevalence, and potential delay in nephrology referrals and access to various medical interventions, we do not recommend the adoption of the 2021 CKD-EPI equations in Korea. Further studies are warranted to determine whether variations in medical services occur in response to using different eGFR equations and identify the association between different eGFR equations and clinical outcomes, including mortality and progression to end-stage renal disease.
Supplementary Materials
Supplementary data are available at Kidney Research and Clinical Practice online (https://doi.org/10.23876/j.krcp.23.124).
Notes
Conflicts of interest
All authors have no conflicts of interest to declare.
Data sharing statement
The datasets analyzed during the current study are available from the corresponding author upon reasonable request.
Authors’ contributions
Conceptualization: HJC
Data curation, Formal analysis, Investigation, Methodology, Resources, Visualization: JMC, RHC
Project administration, Supervision: RHC, DKK, HJC
Writing–original draft: JMC, RHC
Writing–review & editing: All authors
All authors read and approved the final manuscript.