Medium cut-off dialyzer improves reduction ratios of large middle molecules associated with vascular calcification
Article information

Abstract
Background
We aimed to investigate the change in the large middle molecule (>15 kDa) removal rate, which is associated with vascular calcification, when using a medium cut-off (MCO) dialyzer compared to a high-flux (HF) dialyzer.
Methods
Twenty patients with clinically stable maintenance hemodialysis were investigated over a 15-week study period. Dialyzer efficacies were evaluated during the last midweek hemodialysis treatment for each consecutive dialyzer membrane use: 1st HF, MCO, and 2nd HF dialyzer; 5 weeks each period. Changes in α1-microglobulin (33 kDa) during a dialysis session were analyzed to assess the efficacy of the MCO dialyzer as a reference. The levels and reduction ratios of fibroblast growth factor 23 (FGF23, 32 kDa), osteoprotegerin (OPG, 60 kDa), and sclerostin (22 kDa) were analyzed. Large middle molecules were measured using an enzyme-linked immunosorbent assay.
Results
Serum hemoglobin, phosphorus, and corrected calcium levels were not significantly different for each dialyzer period. Total protein and albumin values during the MCO dialyzer period did not decrease compared with the HF dialyzer period. The reduction ratio of α1-microglobulin was significantly higher in the MCO dialyzer than in the HF dialyzer (p < 0.001). The reduction ratios of FGF23 (p < 0.001), OPG (p < 0.001), and sclerostin (p < 0.001) were significantly higher in the MCO dialyzer than those in the HF dialyzer.
Conclusion
The reduction rate of large middle molecules related to vascular calcification, such as FGF23, OPG, and sclerostin, was significantly higher when using the MCO dialyzer than the HF dialyzer.
Introduction
Uremic toxins accumulate during kidney impairment. They can be broadly categorized into small water-soluble molecules, protein-bound solutes, and middle molecules. Established dialysis technologies efficiently remove small, water-soluble molecules. However, the use of current dialysis techniques (low-flux or high-flux [HF] dialyzer) for removing large middle molecules (molecular weight of >15 kDa) is limited [1]. A recently developed new generation of dialyzers, the medium cut-off (MCO) dialyzers, allows the removal of large middle molecules, surpassing even the removal range provided by HF dialyzers or hemodiafiltration [HDF] [2]. Large middle molecules are associated with chronic inflammation, structural heart disease, atherosclerosis, and secondary immunodeficiency [1]. Large middle molecules are also associated with fatigue, pruritus, and cardiovascular complications in end-stage kidney disease (ESKD) patients [3]. Previous studies have shown increased free light chain removal, improvement in anemia, and improvement in quality of life when MCO dialyzers improve the ability to remove large middle molecules [4–6].
Cardiovascular complications are the leading cause of death in patients with chronic kidney disease (CKD), and calcification of the tissue and blood vessel walls is common in patients with ESKD due to abnormal bone metabolism [7]. Complex physiopathological mechanisms are associated with vascular calcification, including inflammation, the release of chemical mediators, oxidation, and genetic factors that enhance osteochondrogenic differentiation of vascular smooth muscle cells [8]. Uremic toxins may also be involved in vascular calcification in patients with ESKD. Uremic toxins cause the release of several cytokines, resulting in increased insulin resistance, and decreased fetuin-A, which inhibits vascular calcification, increases bone remodeling, causes endothelial dysfunction, and increases smooth muscle proliferation and vascular calcification [9]. A previous study showed that large middle molecule uremic toxins are pathologically involved in atherosclerosis [1].
Vascular calcification is a strong predictor of cardiovascular morbidity and mortality in patients with ESKD. Various substances could affect vascular calcification. Fibroblast growth factor 23 (FGF23, 32 kDa), osteoprotegerin (OPG, 60 kDa), and sclerostin (22 kDa), which are large middle molecules, may be associated with vascular calcification in patients with ESKD. FGF23, a phosphaturic hormone mainly produced by osteocytes, is upregulated in CKD [10]. Higher FGF23 levels correlate with increased aortic calcification in patients with CKD and ESKD [11–13]. OPG is a member of the tumor necrosis factor receptor superfamily and a decoy receptor for the receptor activator of nuclear factor (RANK), which is predominantly expressed by osteoblasts and the vascular endothelium [9]. Elevated OPG is a risk factor for progressive atherosclerosis [14] and is associated with vascular calcification in CKD [15] and hemodialysis (HD) [16]. Sclerostin, a potent soluble inhibitor of the Wnt signaling pathway, is a glycoprotein that is almost exclusively secreted by osteocytes and inhibits bone formation by inhibiting osteoblasts [17]. Patients with CKD have high serum sclerostin levels, and as glomerular filtration rates decrease, sclerostin levels increase [18]. Several studies have reported a positive correlation between serum sclerostin levels and vascular calcification in patients with CKD and ESKD [18–20]. In this regard, this study aimed to investigate whether the removal rate of these substances related to vascular calcification is improved when an MCO dialyzer is used in HD patients.
Methods
This study was approved by the Institutional Review Board of Pusan National University Hospital (No. 2011-021-097). All the investigations were performed in accordance with the guidelines of the 2008 Declaration of Helsinki. Written informed consent was obtained from all study patients.
Study population and study design
This single-center prospective study was conducted with patients undergoing maintenance HD. This study utilized surplus samples of patients enrolled in the authors’ previous study that analyzed the treatment effects of HF and MCO dialyzers. The details of the previous study design and methods are described elsewhere [21].
Different dialyzers were applied for a 15-week study period as follows: 1) 1st HF dialyzer for 5 weeks; 2) MCO dialyzer for 5 weeks; and 3) 2nd HF dialyzer for 5 weeks (Fig. 1). To evaluate the efficacy of different dialyzers, blood samples were obtained midweek during the last (fifth) week of each dialyzer period. Polyflux 170H (Baxter International Inc.) was used as the HF dialyzer, and Theranova 400 (Baxter International Inc.) was used as the MCO dialyzer.

Serum hemoglobin and single-pool Kt/V changes during each dialyzer period.
(A) Serum hemoglobin levels were not significantly different in each dialyzer period (p = 0.56). (B) Single-pool Kt/V, which reflects dialysis adequacy, also did not differ significantly during each dialyzer period (p = 0.22).
HF, high-flux; MCO, medium cut-off.
Clinical data collection and laboratory analyses
Baseline clinical, demographic, and dialysis-related data, including sex, age, comorbidities, cause of ESKD, HD duration, and type of vascular access, were recorded. The serum biochemical parameters were measured using routine laboratory methods at our hospital.
Sampling and measurement of serological biomarkers
Blood samples were collected before and after dialysis on the midweek HD day of each dialyzer period’s fifth week (1st HF, MCO, and 2nd HF dialyzer periods). Blood samples were collected in tubes with a plasma- or serum-separating agent and centrifuged for 15 minutes at 3,000 rpm and 4 °C. The plasma and serum samples were immediately frozen and stored at –80 °C until serological biomarker analysis. Plasma α1-microglobulin (33 kDa), serum FGF23, serum OPG, and plasm sclerostin levels were measured before and after the dialysis each dialyzer period. Changes in α1-microglobulin during a dialysis session were analyzed to assess large middle molecule removal and check whether the MCO dialyzer functioned better than the HF dialyzer [22]. Levels of α1-microglobulin (Assaypro LLC.), FGF23 (KAINOS Co.), OPG (BioVender Co.), and sclerostin (TECOmedical AG) were measured using an enzyme-linked immunosorbent assay kit according to the manufacturer’s protocol. Reduction ratios were calculated using the following formula: reduction ratio (%) = {1 – (Cpost/Cpre)} × 100, where the predialysis (Cpre) and postdialysis (Cpost) concentrations are the measured molecular concentrations before and after the dialysis session, respectively. The postdialysis concentrations were adjusted in consideration of hemoconcentration, divided by {1 + (intradialytic weight loss [kg]) / (0.2 × end dialysis body weight [kg])} [23]. That is, the reduction ratio reflecting this is {1 – (Cadjusted post/Cpre)} × 100 (%).
Statistical analysis
Baseline clinical characteristics are presented as a mean ± standard deviation or number (percentage), depending on the nature of the variables. Laboratory parameters during each dialyzer period were analyzed using repeated measures a one-way analysis of variance (ANOVA). Results are presented as the mean ± standard deviation for normally distributed variables and as the median (interquartile range) for variables with a skewed distribution. Blood level changes in large middle molecules during an HD session were analyzed with paired t-test or Wilcoxon signed-rank test when comparing two groups and repeated measures one-way ANOVA or Friedman test when comparing three groups. Reduction ratios were compared between dialyzers using repeated measures one-way ANOVA. SPSS version 20.0 (IBM Corp.) and GraphPad Prism version 9.5.0 for Windows (GraphPad Software; www.graphpad.com) were used for the analyses. The p-values of <0.05 were considered statistically significant.
Results
Clinical characteristics of the patients
The baseline clinical characteristics of patients are presented in Table 1. The mean age of the 20 study patients was 59.9 ± 14.2 years and 50% were male. Among the underlying diseases, diabetes mellitus and hypertension were each present in 50% of the patients. Excluding other causes, diabetic kidney disease (25%) was the most common cause of ESKD. The mean HD duration was 92.1 ± 54.6 months.
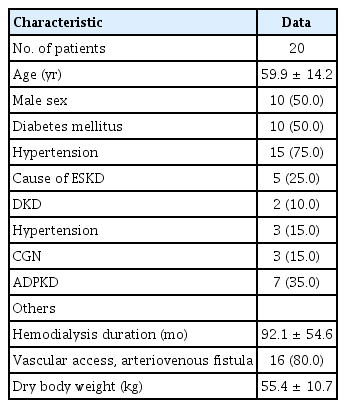
The baseline clinical characteristics of study patients
Changes in laboratory parameters during each dialyzer period
During three consecutive study periods (1st HF dialyzer, MCO dialyzer, and 2nd HF dialyzer period, each of 5 weeks), blood urea nitrogen and serum creatinine values were similar during each dialyzer period. Serum hemoglobin (p = 0.56) and single-pool Kt/V (p = 0.22), which reflect dialysis adequacy, did not differ significantly between dialyzer periods (Fig. 1). Serum corrected calcium and phosphorus levels were not significantly different between dialyzer periods (Supplementary Fig. 1, available online). Patients mainly consumed non-calcium-based phosphorus binders during the study period (Supplementary Table 1, available online). Total protein and albumin values during the MCO dialyzer period did not decrease compared to HF dialyzer periods (Fig. 2).

Serum total protein and albumin changes during each dialyzer period.
(A) Serum total protein levels during the MCO dialyzer period did not decrease compared with the HF dialyzer periods (p = 0.40). (B) Serum albumin levels during the MCO dialyzer period did not decrease compared with the HF dialyzer periods (p = 0.51).
HF, high-flux; MCO, medium cut-off.
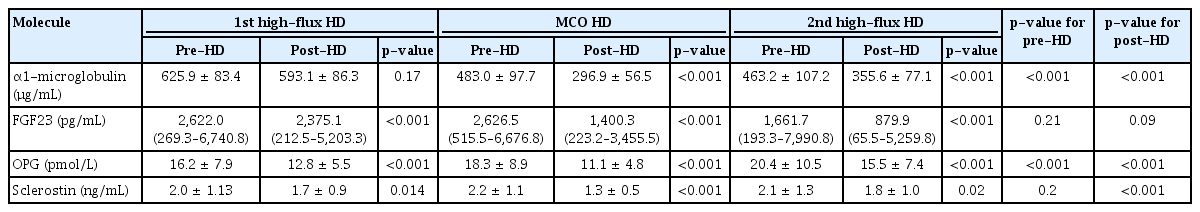
Blood level changes in large middle molecules before and after dialysis and reduction ratios according to the dialyzers
The blood level changes in the large middle molecules during each HD session are presented in Table 2. Changes in α1-microglobulin levels were analyzed to assess large middle molecule removal [22]. The α1-microglobulin levels before and after dialysis, according to the dialyzers, are shown in Table 2. Alpha-1-microglobulin significantly decreased during MCO and 2nd HF dialyzer use at each HD session. The α1-microglobulin reduction ratio was significantly higher during MCO dialyzer use than during HF dialyzer use (p < 0.001) (Fig. 3A). There was no significant difference in the reduction ratio of blood urea nitrogen, a small molecule, during each dialyzer period (p = 0.13) (Fig. 3B). It can be seen that the MCO dialyzer removed large middle molecules better than the HF dialyzer.
Blood level changes in large middle molecules during an HD session
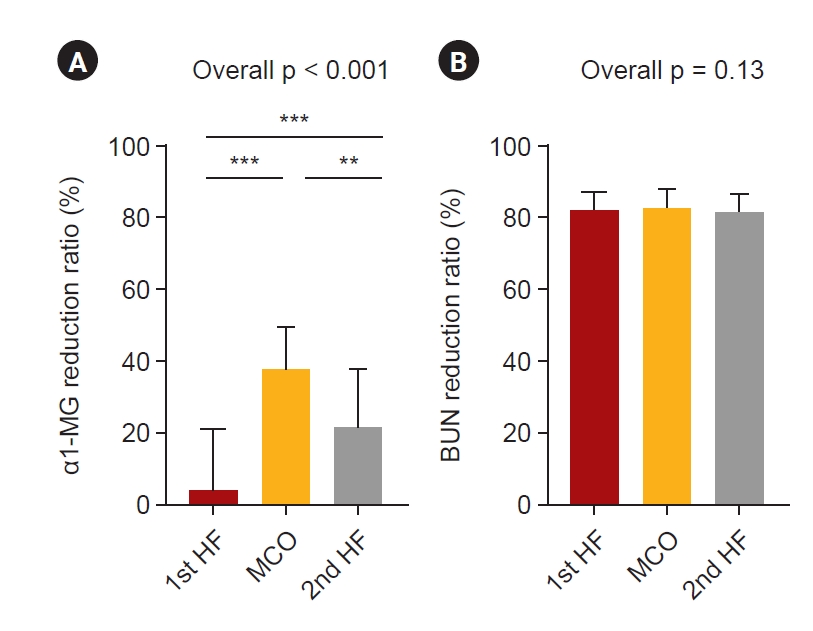
Reduction ratios of α1-macroglobulin and blood urea nitrogen according to the treatment modalities.
(A) α1-MG reduction ratio was significantly higher during MCO dialyzer use than during HF dialyzer use (p < 0.001). (B) There was no significant difference in the reduction ratio of the BUN reduction ratio, a small molecule, during each dialyzer period (p = 0.13). The p-values were calculated using the repeated measures one-way analysis of variance using GraphPad Prism version 9.5.0 for Windows (GraphPad Software; www.graphpad.com); **p < 0.01, ***p < 0.001.
α1-MG, α1-macroglobulin; BUN, blood urea nitrogen; HF, high-flux; MCO, medium cut-off.
FGF23, OPG, and sclerostin levels were measured before and after HD during each dialyzer period (Table 2). Serum FGF23 was significantly decreased in each dialysis session during both the HF and MCO dialyzer periods (Table 2). The reduction ratio of FGF23 was significantly higher with the MCO dialyzer (Fig. 4A). The reduction ratio of FGF23 was significantly higher in the 2nd than in the 1st HF dialyzer period, but the largest when using the MCO dialyzer. Serum OPG significantly decreased in each dialyzer period (Table 2), and the reduction ratio of OPG was significantly higher with the MCO dialyzer (Fig. 4B). Plasma sclerostin levels were also significantly decreased during both the HF and MCO dialyzer periods (Table 2). The reduction ratio of sclerostin was also significantly higher with the MCO dialyzer than with the HF dialyzer (Fig. 4C).
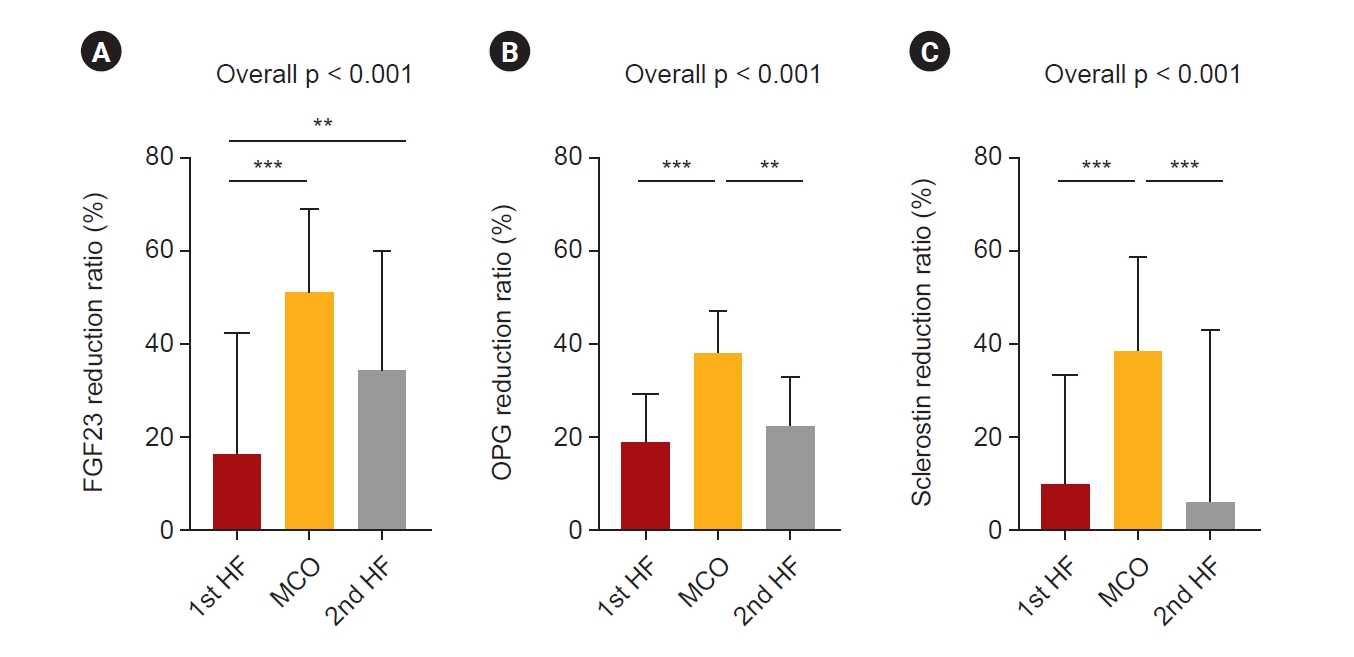
Reduction ratios of the large middle molecules according to the treatment modalities.
The reduction ratios of (A) FGF23, (B) OPG, and (C) sclerostin were significantly higher with the MCO dialyzer than with the HF dialyzer. The p-values were calculated using the repeated measures one-way analysis of variance using GraphPad Prism version 9.5.0 for Windows (GraphPad Software; www.graphpad.com); **p < 0.01, ***p < 0.001.
FGF23, fibroblast growth factor 23; HF, high-flux; MCO, medium cut-off; OPG, osteoprotegerin.
Discussion
This study evaluated the ability of HF and MCO dialyzers to remove large middle molecules. Alpha-1-microglobulin changes during a dialysis session were analyzed to assess large middle molecule removal and check whether the MCO dialyzer functioned better than the HF dialyzer. Alpha-1-microglobulin is a useful surrogate marker for middle molecule removal [22]. Sakurai [24] showed that reduction ratios of α1-microglobulin >35% alleviated severe restless legs syndrome. In our study, the α1-microglobulin reduction ratio using an MCO dialyzer was 37.3%, suggesting the appropriate removal of the large middle molecule. For large middle molecules related to vascular calcification, such as FGF23, OPG, and sclerostin, the reduction ratio was significantly higher when the MCO dialyzer was used than the HF dialyzer.
Several pathophysiologies are involved in vascular calcification in CKD, and CKD-related mineral bone disorder (MBD) is also involved in vascular calcification [10]. FGF23 is an early mineral biomarker of CKD-MBD and has been reported to increase as CKD progresses and might be related to vascular calcification. An experimental study showed that FGF23 augmented phosphate-induced vascular calcification in the aortic rings of uremic rats dose-dependently [25]. FGF23 was independently associated with aortic calcification in HD patients [12]. The relationship between FGF23 and vascular calcification remains controversial, with an ongoing debate regarding its role as either a bystander or mediator. Although the exact nature of this relationship is not yet clearly understood, emerging evidence suggests that FGF23 may have implications beyond its traditional role in mineral metabolism [26]. In addition, FGF23 is associated with the exacerbation of inflammation [27], which may be related to vascular calcification. In a previous experimental study using a murine model of CKD, FGF23 was reported to exhibit regulatory effects on genes associated with inflammation [28]. Higher FGF23 levels were associated with higher levels of inflammatory markers in patients with CKD [29]. FGF23 contributes to uremic inflammation, and high FGF23 levels are associated with a greater risk of severe inflammation [30,31]. FGF23 is a large middle molecule with a molecular weight similar to that of α1-microglobulin, and using an MCO dialyzer improves the FGF23 reduction ratio. MCO dialyzers increase the FGF23 removal rate, and modification of inflammation might help improve the prognosis of patients with ESKD.
Vascular calcification is associated with several factors that promote osteochondrogenic differentiation of vascular smooth muscle cells. Bone turnover inhibitors may be associated with vascular calcification. OPG, which inhibits osteoclasts, and sclerostin, which inhibits osteoblasts, may be involved in vascular calcification. OPG, a potent osteoclast activation inhibitor, decreases bone resorption and vascular calcification by interfering with the binding of the RANK ligand to RANK [32,33]. However, a pathological increase in OPG levels causes inflammation via leukocyte adhesion to endothelial cells. OPG is increased in patients with ESKD, and pathologically elevated OPG is associated with vascular calcification progression [34] and mortality [23] in HD patients. In our study, the reduction ratio of OPG while using the MCO dialyzer was significantly higher than that while using the HF dialyzer, and this improvement in the large middle molecule removal rate may reduce vascular calcification.
Sclerostin primarily regulates bone metabolism and inhibits bone formation by suppressing osteoblastic activity. It has also been observed that sclerostin directly affects vascular smooth muscle cells, which are responsible for maintaining the structural integrity of blood vessels. Sclerostin is known to be involved in vascular calcification; however, previous studies have reported conflicting results. A study has shown that sclerostin prevents vascular calcification in mice [35]. However, in animal experiments, the expression of sclerostin in calcified blood vessels was reported to be either increased [36,37] or decreased [38]. When renal function declines, sclerostin levels increase, and in several clinical studies, this increase has been associated with vascular calcification. In advanced CKD, serum sclerostin levels are elevated, and high serum sclerostin levels are associated with aortic valve calcification in HD patients [39]. Kanbay et al. [40] showed that high sclerostin levels are a risk factor for fatal and non-fatal cardiovascular events in non-dialysis CKD patients. Morena et al. [18] reported that OPG and sclerostin are independently associated with vascular calcification with potential additive effects in patients with CKD. However, other previous studies in patients with CKD or EKSD observed no or negative association between sclerostin and vascular calcification [41]. Studies on the effects of sclerostin modification have shown conflicting results. Upregulation of sclerostin by the transgenic introduction of human sclerostin or injection of recombinant sclerostin reduces the development of atherosclerosis and aortic aneurysm [38]. However, in a mouse model of CKD, compared to the wild-type control, aortic calcification was not observed when sclerostin was deficient [42]. In other words, in animal experiments, studies with only some models have shown that sclerostin deficiency causes vascular calcification. The cardiovascular safety of romosozumab, which is a sclerostin antibody, is controversial. In a meta-analysis, Bovijn et al. [43] showed that inhibition of romosozumab increases cardiac ischemic events. In a meta-analysis that included additional studies, administration of the sclerostin-blocking antibody, romosozumab, did not significantly increase the risk of major adverse cardiovascular events or cardiovascular death [41]. Therefore, the effect of sclerostin on vascular calcification remains controversial, and animal models cannot definitively replace human data. In addition, sclerostin is involved in various physiological processes, and the Wnt/β-catenin signaling pathway has been identified as a critical mediator of the effects of sclerostin on vascular calcification. The Wnt signaling pathway is complex; consequently, different results may be obtained, requiring further research.
Vascular calcification is a process of gradual osteogenesis initiated by inflammatory factors in the vessels. Sclerostin inhibits the Wnt pathway, resulting in the inhibition of bone formation. The Wnt signaling pathway can play a role in regulating endothelial inflammation, mesenchymal stem cell differentiation, and promoting the migration of smooth muscle cells, monocytes, and endothelial cells [44,45]. Given the close relationship between sclerostin and the Wnt pathway, sclerostin may be involved in inflammation. ESKD is a chronic inflammatory condition that can lead to multiple complications in patients undergoing HD [46]. OPG [47,48] and FGF23 [30,31] are also associated with inflammation. Improving the removal rate of uremic toxins, which can affect inflammation, may help mitigate vascular calcification caused by a vascular inflammatory response. In our previous study, component 4B, an inflammatory marker, significantly decreased during MCO dialyzer use compared to that during HF dialyzer use [21]. Retinol-binding protein 4 levels, which are associated with inflammation and oxidative stress, also decreased during the MCO period. In addition, an increase in epithelial cell proliferation and a decrease in endothelial cell apoptosis occurred during the MCO period. As such, MCO dialyzers reduce inflammatory substances, suggesting that they might improve the clinical outcomes of HD patients.
HDF and using an MCO dialyzer improves the clearance of uremic toxins more than HD with an HF dialyzer. Some studies have shown an improvement in the cardiovascular outcomes of patients with HDF compared to undergoing HD with an HF dialyzer [49,50]. In a randomized controlled study comparing HDF and the use of MCO dialyzers for 1 year, patients using MCO dialyzers had non-inferior cardiovascular outcomes, including levels of cardiovascular blood biomarkers, brachial-ankle pulse wave velocity, left ventricular ejection fraction, left ventricular mass index, and cardiovascular and all-cause mortality, compared to those undergoing HDF [51]. The use of an MCO dialyzer was associated with increased vascular calcification. However, this was a subgroup analysis of a few patients, and the authors suggested that a long-term follow-up study with more patients was needed. MCO membranes offer the advantage of better removal of large middle molecules, leading to improved control of inflammation and oxidative stress, which may benefit vascular calcification [52]. Some studies have reported decreased albumin levels when using an MCO dialyzer. Decreased albumin levels are associated with malnutrition and inflammation. However, previous studies have shown that albumin loss in MCO dialyzers does not cause severe hypoalbuminemia or require supplementation and is usually manageable with hepatic synthesis [52]. Additional long-term studies are required to determine the effects of MCO dialyzers on vascular calcification.
The strength of our study is that we evaluated changes in large middle molecules using HF and MCO dialyzers sequentially. However, this study has a few limitations. This was an exploratory and pilot study of available patients. Therefore, only a few patients were included in the study, which was conducted in a single center in Korea. Changes in the markers of vascular calcification were examined, but the long-term outcomes of the patients were not evaluated. However, it is meaningful to observe a significant reduction ratio of large middle molecules depending on different dialyzers, even in a small number of patients.
In conclusion, the rate of reduction of large middle molecules related to vascular calcification, such as FGF23, OPG, and sclerostin, was significantly higher when using the MCO dialyzer than the HF dialyzer. Further studies are needed to determine the clinical outcomes of HD patients following the removal of these large middle molecules.
Supplementary Materials
Supplementary data are available at Kidney Research and Clinical Practice online (https://doi.org/10.23876/j.krcp.23.061).
Notes
Conflicts of interest
All authors have no conflicts of interest to declare.
Funding
This study was supported by a Biomedical Research Institute Grant (20200010) from Pusan National University Hospital.
Data sharing statement
The data presented in this study are available upon reasonable request from the corresponding author.
Authors’ contributions
Conceptualization: HJK, SHS
Data curation, Investigation: all authors
Formal analysis: HJK, SHS
Funding acquisition: HJK
Writing–original draft: HJK
Writing–review & editing: all authors
All authors read and approved the final manuscript.