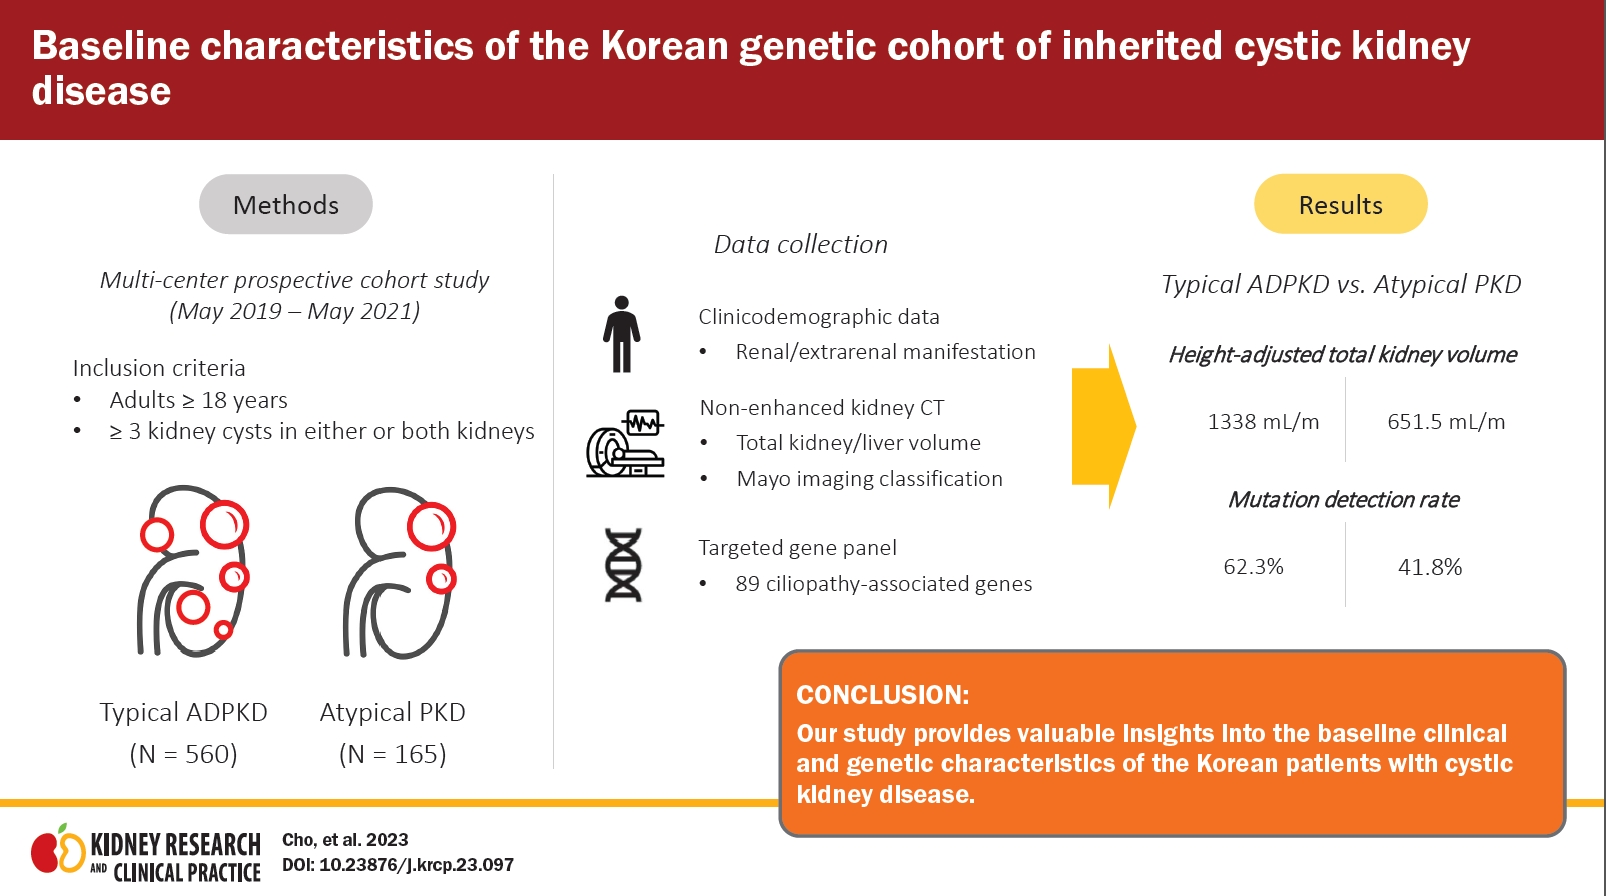
Baseline characteristics of the Korean genetic cohort of inherited cystic kidney disease
Article information

Abstract
Background
Identifying genetic mutations in individuals with inherited cystic kidney disease is necessary for precise treatment. We aimed to elucidate the genetic characteristics of cystic kidney disease in the Korean population.
Methods
We conducted a 3-year prospective, multicenter cohort study at eight hospitals from May 2019 to May 2022. Patients with more than three renal cysts were enrolled and classified into two categories, typical autosomal dominant polycystic kidney disease (ADPKD) and atypical PKD. We identified the clinical characteristics and performed a genetic analysis using a targeted gene panel.
Results
A total of 725 adult patients were included in the study, of which 560 (77.2%) were diagnosed with typical ADPKD and 165 (22.8%) had atypical PKD. Among the typical ADPKD cases, the Mayo imaging classification was as follows: 1A (55, 9.9%), 1B (149, 26.6%), 1C (198, 35.8%), 1D (90, 16.3%), and 1E (61, 11.0%). The atypical PKD cases were classified as bilateral cystic with bilateral atrophic (31, 37.3%), lopsided (27, 32.5%), unilateral (nine, 10.8%), segmental (eight, 9.6%), bilateral cystic with unilateral atrophic (seven, 8.4%), and asymmetric (one, 1.2%). Pathogenic variants were found in 64.3% of the patients using the ciliopathy-related targeted gene panel. The typical ADPKD group demonstrated a higher discovery rate (62.3%) than the atypical PKD group (41.8%).
Conclusion
We present a nationwide genetic cohort’s baseline clinical and genetic characteristics for Korean cystic kidney disease.
Introduction
Inherited cystic kidney disease is a heterogeneous group of diseases caused by mutations in genes involved in the cilium-centrosome complex, leading to cilium dysfunction and the development of kidney cysts of various sizes [1]. The disease spectrum of cystic kidney disease includes autosomal dominant polycystic kidney disease (ADPKD), nephronophthisis, autosomal recessive polycystic kidney disease, tuberous sclerosis complex, and autosomal dominant tubule-interstitial kidney disease [1]. Currently, more than 100 genes are known to be involved in kidney cystogenesis [2].
Among the various disease entities, ADPKD stands as the most prevalent inherited cystic kidney disease [3–5]. Clinical diagnosis of ADPKD typically relies on family history and kidney imaging [6,7], but accurately diagnosing patients with mild phenotypes or late-onset symptoms presents a significant challenge [8]. Genetic testing has greatly improved diagnostic accuracy [9], and recent research on genotype-phenotype correlations in ADPKD has yielded valuable insights into prognostic prediction [10–12].
However, despite ADPKD being caused by a single gene, it displays significant variability in both renal and extrarenal manifestations, which can be attributed to the presence of multiple variants within the disease-causing genes [13]. These challenges are further compounded by other gene-associated factors, such as the intricate nature of the PKD1 gene [14,15], the high allelic heterogeneity of both the PKD1 and PKD2 genes, and genotype-phenotype discrepancies. Consequently, achieving an accurate diagnosis of ADPKD remains a complex task [8]. In addition, there is a lack of research specifically focused on atypical ADPKD cases that do not have typical imaging features or family history [16]. Therefore, conducting a comprehensive genetic analysis linked to clinical data within a well-established cystic kidney disease cohort is essential. This approach will help identify specific genetic variants, establish associations between genotypes and phenotypes, and develop a precise diagnostic protocol that guides appropriate treatment planning.
We conducted a 3-year prospective, multicenter, nationwide cohort study of Korean cystic kidney disease to establish a comprehensive database of the disease and identify its genetic profiles. The primary focus of this study is to present the baseline clinical and genetic characteristics of the Korean cystic kidney disease cohort.
Methods
Study design
This 3-year prospective, multicenter study was designed to establish a cohort of Korean patients with cystic kidney disease. It aimed to develop an individualized genetic analysis protocol for each patient (Clinical Research Service: KCT0005580). The study design for the cohort was previously published [16].
Study population
Participants aged 18 years and older, presenting with three or more renal cysts in either or both kidneys, were registered between May 2019 and May 2021. The enrollment process took place in eight medical centers. Cases involving simple renal cysts or acquired cystic kidney disease resulting from kidney failure were excluded from the study. Patients who passed away or withdrew their consent were also excluded from the analysis. The participants were categorized into two groups: typical ADPKD and atypical polycystic kidney disease (PKD). Typical ADPKD cases were characterized by bilateral and diffuse distribution of cysts, resulting in the replacement of kidney tissue, and were identified based on the Pei-Ravine criteria. Patients displaying features not aligning with the typical radiological presentation were classified as having atypical PKD. In particular, within the atypical PKD group, further classification was performed, resulting in two distinct subclasses: 1) subclass 2A included cases with unilateral, segmental, asymmetric, or lopsided imaging findings, and 2) subclass 2B encompassed cases with bilateral cystic manifestation accompanied by either unilateral atrophy or bilateral kidney atrophy. Additionally, patients with typical radiological features but lacked a family history were classified as having clinically atypical PKD.
Data collection
Demographic data, including age, gender, height, and weight, were collected. The medical history of hypertension, diabetes mellitus, cardiovascular diseases, cerebrovascular accidents, malignancy, liver diseases, and complications associated with cystic kidney disease were obtained through patient interviews or by reviewing electronic medical records. The definitions of comorbidities and relevant drugs can be found in Supplementary Table 1, 2 (available online). Systolic and diastolic blood pressure measurements were taken, and laboratory analyses were conducted based on blood and urine sample test results. Kidney function was evaluated using the estimated glomerular filtration rate (eGFR), calculated using the Chronic Kidney Disease Epidemiology Collaboration (CKD-EPI) equation. The stage of chronic kidney disease was defined according to the Kidney Disease Improving Global Outcome (KDIGO) serum creatinine classification. Non-enhanced kidney computed tomography (CT) scans were performed to classify patients as having typical or atypical cystic kidney disease. Genetic analysis was conducted using an 89-gene panel designed to detect pathogenic variants associated with ciliopathies, including polycystic kidneys and liver. The composition of the gene panel was described in our previous publication [16].
Assessment of volumetry and Mayo imaging classification
The assessment of well-established prognostic factors for ADPKD, including total kidney volume (TKV), height-adjusted TKV (htTKV), and Mayo imaging classification (MIC), was conducted [17,18]. TKV and total liver volume (TLV) were measured using both the ellipsoid and stereological volume equations [19]. For the stereological equation, kidney CT images were carefully screened to ensure complete coverage of both the kidneys and liver. The images were then reconstructed into 5-mm sections for axial images and 3-mm sections for coronal and sagittal sections. TKV and TLV were measured by a trained radiologist using the semiautomatic volumetry software ImageJ ver. 1.5a (https://imageJ.nih.gov/ij/). Given the high correlation between the two volume measurement methods (Pearson correlation coefficient r = 0.952 [0.969–0.980], p < 0.001; unpublished data), stereologically calculated TKV and TLV values were analyzed. The htTKV was calculated by dividing the TKV by the patient’s height. Using MIC, patients with typical ADPKD were stratified into five subclasses (1A–1E) based on the yearly increase in htTKV estimated using baseline htTKV measurements and age-specific htTKV limits. The subclasses were defined as 1A for a yearly increase of <1.5%, 1B for 1.5%–3%, 1C for 3%–4.5%, 1D for 4.5%–6%, and 1E for >6%. In atypical PKD, patients were stratified into two subclasses: 2A (unilateral, asymmetric, segmental, lopsided) and 2B (bilateral cystic with unilateral atrophy, bilateral cystic with bilateral atrophy).
Variant prioritization
Variants were prioritized based on several criteria for predicted deleteriousness and rarity.
Class 1: Loss-of-Function (LoF) variants, including canonical splice site, frameshift insertion, frameshift deletion, and stop gain variants. Additionally, missense variants annotated as “(Likely) Pathogenic” for PKD-related phenotypes in ClinVar, polycystic kidney disease database, Rheinisch-Westfälische Technische Hochschule Aachen University's Datenbank or annotated as “DM” (Damaging) for PKD-related phenotypes in Human Gene Mutation Database (HGMD).
Class 2: LoF and missense variants predicted as “deleterious” by MetaSVM (Dmis). These variants are either annotated as “DM” in the HGMD for indirect relevance to PKD phenotypes, “DM?” for PKD-related phenotypes in HGMD or have a minor allele frequency (MAF) of <2 × 10⁻⁵ in both gnomAD and BRAVO when not reported in HGMD. Additionally, missense variants predicted as “tolerated” by MetaSVM (Tmis) are included if they are annotated as “DM” for indirect relevance to PKD phenotypes in HGMD, “DM?” for PKD-related phenotypes in HGMD while meeting additional deleteriousness criteria (CADD ≥ 20 and REVEL ≥ 0.75), or not reported in clinical databases in addition to any population database.
Class 3A: LoF and damaging missense (Dmis) variants with a MAF of ≤1 × 10⁻³ (1 × 10⁻² for homozygotes) in East Asian populations from gnomAD. Additionally, Tmis variants were annotated as “DM?” for PKD-related phenotypes in HGMD.
Class 3B: LoF or Dmis variants with a MAF of ≤1 × 10⁻³ (1 × 10⁻² for homozygotes) in East Asian populations from gnomAD and Tmis variants that do not meet the classification criteria for class 3A.
Class 4: LoF and missense variants annotated as “(Likely) benign” or “Likely neutral” for PKD-related phenotypes in clinical databases.
Statistical analyses
Statistical analyses were conducted using R version 4.2.1 (R Foundation for Statistical Computing). Continuous variables with a normal distribution were reported as mean ± standard deviation, while variables with a skewed distribution were reported as median (interquartile range [IQR]). Categorical variables were presented as frequencies. Baseline characteristics were compared between the typical ADPKD and atypical PKD groups using the independent t tests for continuous variables and the chi-square tests for categorical variables. A p-value of <0.05 was considered statistically significant.
Ethics declarations
The study was conducted in accordance with the principles of the Declaration of Helsinki and was approved by the Institutional Review Boards of each participating center: 1) Seoul National University College of Medicine/Seoul National University Hospital (No. H-1907-067-1047), 2) Chonnam National University Hospital (No. CNUH-2019-276), 3) Kangbuk Samsung Hospital (No. KBSMC 2019-07-029), 4) Inje University Busan Paik Hospital (No. 19-0151), 5) Seoul Metropolitan Government Seoul National University Boramae Medical Center (No. 30-2019-104), 6) Hallym University Kangnam Sacred Heart Hospital (No. 2019-07-015), 7) Keimyung University Dongsan Hospital (No. DSMC 2019-07-055-008), and 8) Seoul National University Bundang Hospital (No. 19-0151). Informed consent was received upon study enrollment from all participants.
Results
Study population
A total of 751 adults over 18 years old with three or more kidney cysts in either or both kidneys were included in the study conducted from May 2019 to May 2021. Twenty-six patients who died or withdrew their consent were excluded from the analysis. Ultimately, 725 individuals were enrolled in the study. Among them, 560 (77.2%) were classified as typical ADPKD cases, while 165 (22.8%) were classified as atypical PKD cases (Fig. 1).
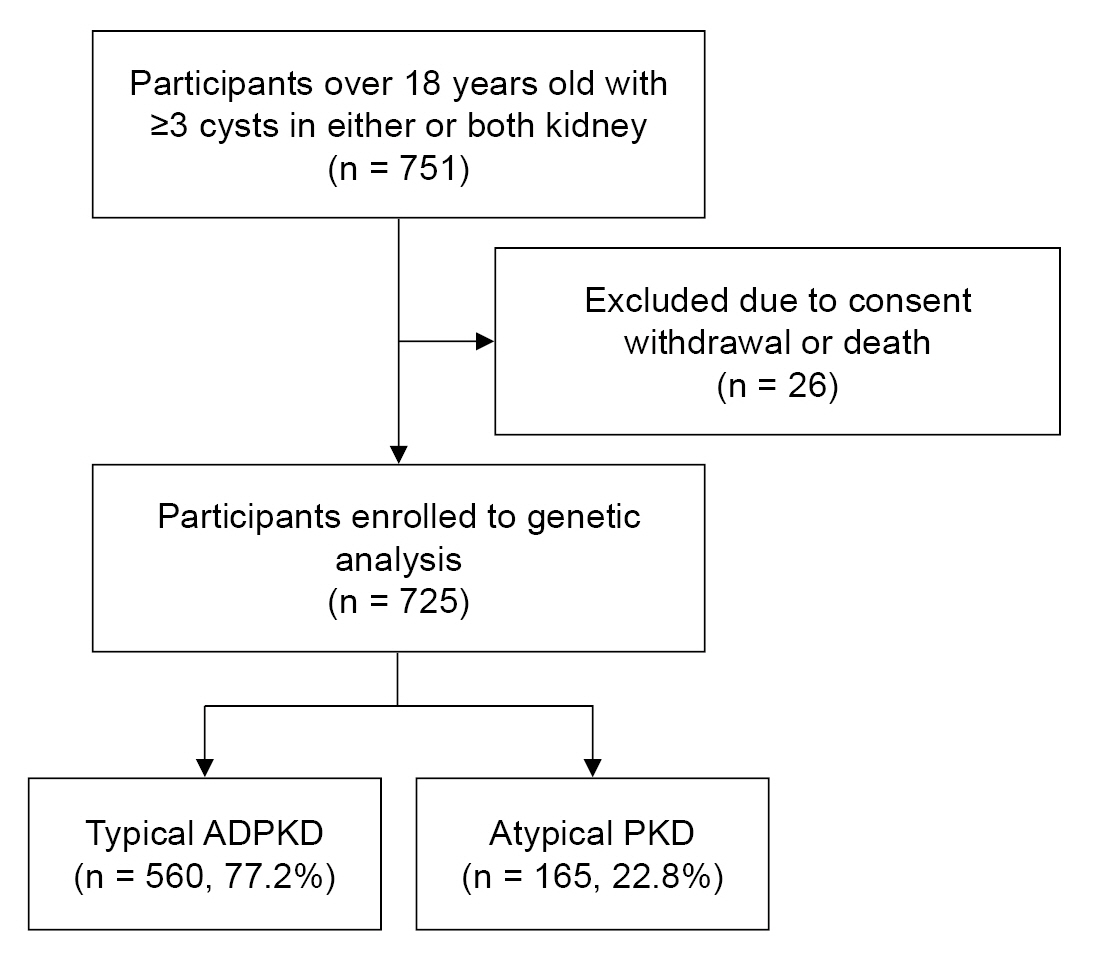
Study flowchart.
ADPKD, autosomal dominant polycystic kidney disease; PKD, polycystic kidney disease.
Demographic and clinical characteristics
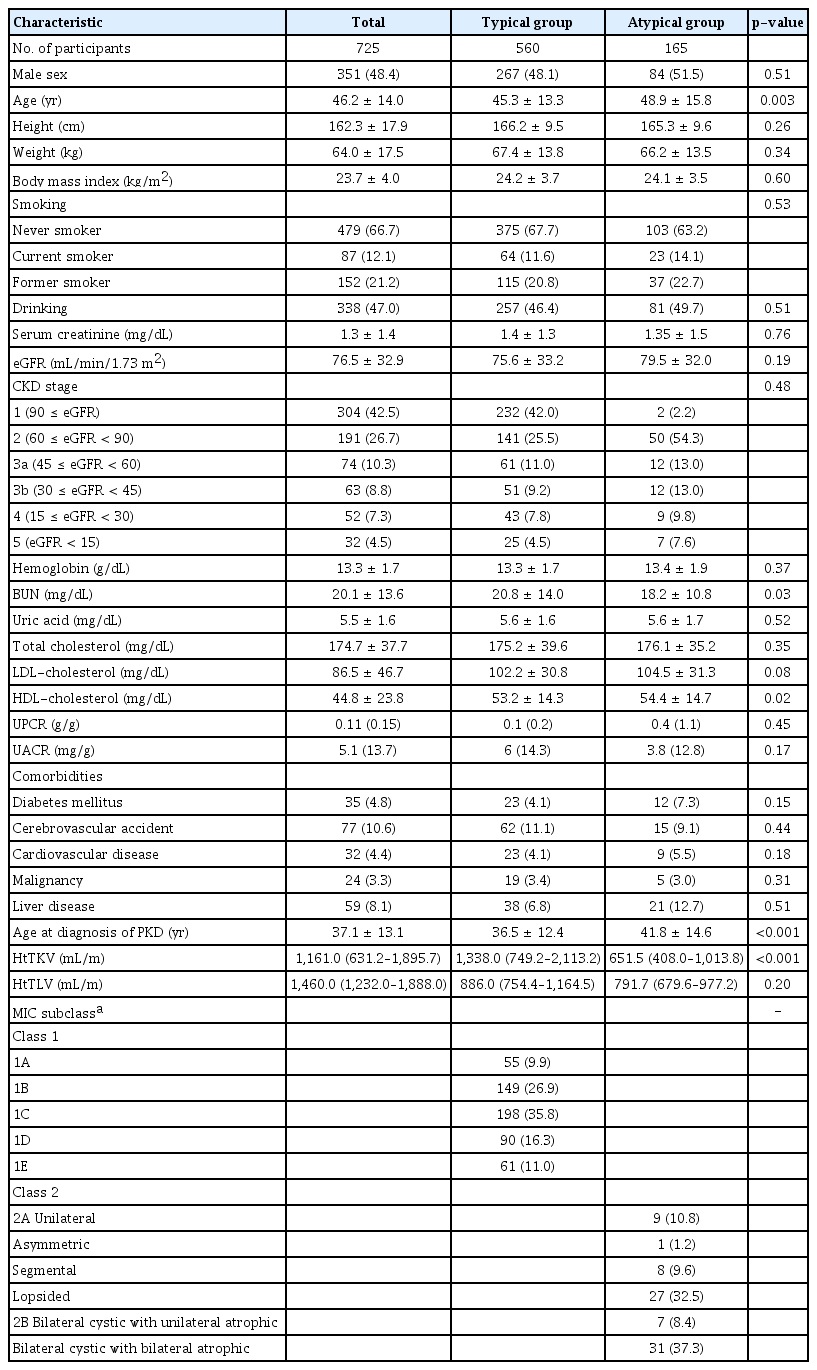
The mean age of the study population was 46.2 ± 14.0 years, with 48.4% being male. The average age at PKD diagnosis was 37.1 ± 13.1 years. Out of the study participants, 479 (66.7%) reported never smoking, 87 (12.1%) were current smokers, and 152 (21.2%) were former smokers. A history of drinking was reported by 338 participants (47.0%). The mean eGFR was 76.5 ± 32.9 mL/min/1.73 m2, and the mean serum creatinine level was 1.3 ± 1.4 mg/dL. The median (IQR) urine protein/creatinine ratio was 0.11 g/g (0.09–0.31 g/g).
The mean ages of the typical ADPKD and atypical PKD groups were 45.3 ± 13.3 years and 48.9 ± 15.8 years, respectively, indicating a significantly younger age in the typical group (p = 0.003). The age at PKD diagnosis was also lower in the typical group (36.5 ± 12.4 years) compared to the atypical group (41.8 ± 14.6 years; p < 0.001). Blood urea nitrogen (BUN) levels were higher in the typical group (p = 0.03), while high-density lipoprotein (HDL) cholesterol was higher in the atypical group (p = 0.02). No significant differences were found in either serum creatinine or eGFR between the groups. Comorbidities, including diabetes mellitus, cerebrovascular disease, cardiovascular disease, malignancy, and liver disease, did not differ significantly between the groups. Table 1 presents the demographic and clinical characteristics.
Characteristics of study participants
Volumetry and Mayo imaging classification profiles
Out of the total population, the median htTKV was 1,161.0 mL/m (IQR, 631.2–1,895.7 mL/m,) and the median htTLV was 1,460.0 mL/m (IQR, 1,232.0–1,888.0 mL/m). The median htTKV of the typical ADPKD group (1,338.0 mL/m [IQR, 749.2–2,113.2 mL/m]) was significantly higher than that of the atypical group (651.5 mL/m [IQR, 408.0–1,013.8 mL/m]; p < 0.001). However, there was no significant difference in the median htTLV between the typical ADPKD and atypical PKD groups (886.0 mL/m [IQR, 754.4–1,164.5 mL/m] vs. 791.7 mL/m [IQR, 679.6–977.2 mL/m]; p = 0.20). The distribution of the study population based on MIC is presented in Table 1. Among the participants in the typical ADPKD group (n = 553), they were categorized into different MIC classes based on htTKV and age to predict the change in eGFR over time: 1) 1A, 55 (9.9%), 2) 1B, 149 (26.9%), 3) 1C, 198 (35.8%), 4) 1D, 90 (16.3%), and 5) 1E, 61 (11.0%). In the atypical PKD group, 83 (50.3%) participants were classified into MIC class 2 based on radiological features. The most common subtype was bilateral cystic with bilateral atrophic type (31, 37.3%), followed by lopsided (27, 32.5%), unilateral (nine, 10.8%), segmental (eight, 9.6%), bilateral cystic with unilateral atrophic (seven, 8.4%), and asymmetric (one, 1.2%). Within the atypical PKD group, 119 participants (72.1%) did not have a known family history of PKD. Seven patients with typical ADPKD and 82 patients with atypical ADPKD could not be classified into specific subtypes due to unclear imaging tests or unmeasured TKV.
Renal and extrarenal manifestations
Table 2 displays the renal and extrarenal manifestations observed in the study participants. Hypertension was the most prevalent kidney complication, observed in 73.4% of all participants. The mean age at diagnosis was 40.5 ± 11.6 years, and the mean systolic/diastolic blood pressure was 129.6 ± 14.0/80.3 ± 10.8 mmHg. The prevalence of hypertension was significantly higher in the typical ADPKD group (430, 76.8%) compared to the atypical group (102, 61.8%; p < 0.001). Proteinuria was the second most common kidney complication, observed in 187 participants (25.8%), followed by hematuria (122, 16.8%), kidney stones (68, 9.4%), kidney pain (40, 5.5%), cyst infections (21, 2.9%), urinary tract infections (15, 2.1%), and cyst hemorrhages (12, 1.7%). The most frequent extrarenal manifestation was liver cysts (461, 63.5%), followed by hyperuricemia (76, 10.5%), cerebral aneurysm (46, 6.3%), gout (35, 4.8%), hernia (eight, 1.1%), heart failure (four, 0.6%), and valvular heart disease (four, 0.6%).

Renal and extrarenal manifestations of study participants
Genetic characteristics
During the 3-year study period, a gene panel analysis was conducted on a total of 725 patients. The mutation detection rate in our cohort was 64.3% (466 out of 725). No variants were identified in 99 cases (13.7%), and variants of unknown significance were detected in 85 cases (11.7%). Damaging (DM) variants were found in 75 cases (10.3%). Fig. 2 presents the genetic profiles obtained from the gene panel analysis of the typical ADPKD and atypical PKD groups. Among clinically typical ADPKD patients (560 cases, 70.2%), the mutation detection rate was 62.3%. PKD1 was found to be the most common genotype (252, 45%), followed by PKD2 (67, 12.1%). The other genotypes responsible for the typical ADPKD phenotype were found to include COL4A5 (1.1%), TSC1 (0.5%), HNF1β (0.4%), AVP (0.4%), AHI1, ALG8, COL4A1, COL4A3, DYNC2H1, EYA1, HSPA6, LRP5, NEK8, PRKCSH, TSC2, and UMOD (all 0.2%). The clinically atypical PKD group (165 cases, 20.7%) presented a lower mutation detection rate (41.8%) based on a gene panel. In 45 cases (27.3%), no pathogenic variants were found based on a gene panel. PKD1 (36, 21.8%) and PKD2 (12, 7.3%) were the two most common genotypes, followed by HNF1β (2.4%), TSC1 (1.8%), GANAB (1.8%), COL4A3 (1.2%), COL4A5 (1.2%), UMOD (1.2%), TSC2, DYNC2H1, and PAX2 (all 0.6%). The patients with family histories of PKD but showing atypical imaging features comprised 45 cases (27.4%). Among those cases, the PKD2 genotype was predominant (15.9%) compared to those without family histories of PKD (4.2%).
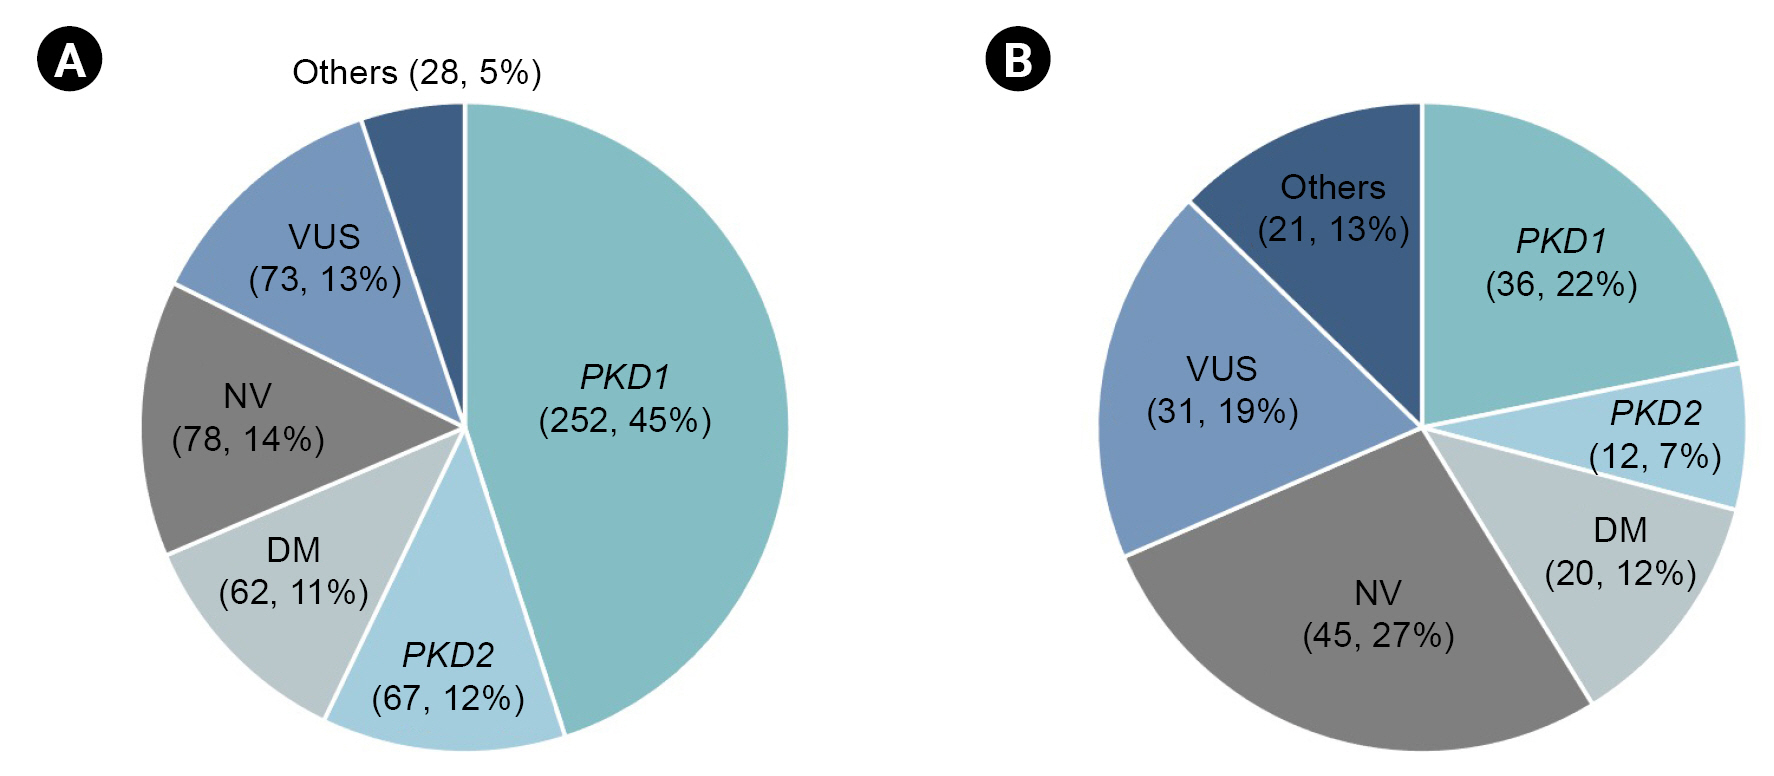
Genetic profile of typical ADPKD and atypical PKD groups using targeted gene panel.
In 725 patients, the mutation detection rate based on the gene panel was 64.3% (466 out of 725). In typical ADPKD group (A, n = 560) and atypical PKD group (B, n = 165), mutation detection rates were 62.3% and 41.8%, respectively.
ADPKD, autosomal dominant polycystic kidney disease; DM, damaging; NV, no variants; PKD, polycystic kidney disease; VUS, variants of unknown significance.
Discussion
We conducted a prospective, multicenter, nationwide cohort study on Korean cystic kidney disease in order to identify the baseline characteristics and genetic profiles of this heterogeneous disease group. Over 3 years, we enrolled a total of 725 participants who had more than three kidney cysts, regardless of their clinical diagnosis, family history, kidney function, or phenotype. We collected and analyzed various clinicodemographic data and performed a primary genetic analysis using a targeted gene panel. Our analysis revealed significant differences in the age at PKD diagnosis, htTKV, and prevalence of hypertension between patients with typical ADPKD and those with atypical PKD. Furthermore, our findings showed that the two most common genetic mutations among Korean cystic kidney disease patients were in the PKD1 and PKD2 genes.
Joint research consortia for inherited cystic kidney disease have been established in the United States, Canada, and Europe. Given that ADPKD is the most prevalent inherited kidney disease, multiple ADPKD cohorts have been formed worldwide, including the Consortium for Radiologic Imaging Studies of Polycystic Kidney Disease (CRISP) [20], the French Genkyst cohort [10], the Toronto Genetic Epidemiology Study of PKD (TGESP) [12], and the cohort for genotype-PhenotypE correlation in ADPKD (HOPE-PKD) in Korea [21]. These cohorts have contributed to identifying various classification criteria and prognostic factors for ADPKD patients, such as the Mayo classification, TKV, and PKD1 or PKD2 genotype [17]. However, there is still a lack of comprehensive understanding regarding cystic kidney diseases. Specifically, limited data on predictive markers, diagnostic criteria, or classification guidelines for atypical PKD is available. Therefore, there is a need for a cystic kidney disease cohort that encompasses both clinical and genetic information for both typical ADPKD and atypical PKD.
Understanding the clinicodemographic factors associated with severity and renal outcomes in both typical ADPKD and atypical PKD is crucial, as these factors play a significant role. Previous studies have suggested that younger age at PKD diagnosis, higher TKV [17], elevated serum uric acid levels [22], decreased HDL levels [23], and increased proteinuria [24,25] are associated with adverse outcomes in ADPKD. Our current study identified significant differences in various factors between typical ADPKD and atypical PKD patients. Since atypical PKD is mainly classified based on radiologic patterns and its clinical characteristics are not fully understood [26], these findings may provide valuable insights for differential diagnosis, prognosis, and even potential endpoints in clinical trials involving patients with atypical PKD. However, further investigation is necessary to determine whether these factors are indeed associated with adverse outcomes in cystic kidney diseases.
Genetic profiling of cystic kidney disease can be a valuable tool for dissecting and classifying these heterogeneous disease entities. In our current study, we performed genetic analysis using a targeted gene panel to detect various genotypes in both typical ADPKD and atypical PKD groups. However, the overall mutation detection rate in our cohort was lower than that of other cohorts such as HALT/CRISP (92%) [11], TGESP (84.5%) [12], and Genkyst (89.9%) [10,27], which utilized molecular analysis techniques including Sanger sequencing, multiplex ligation-dependent probe amplification, and long-range polymerase chain reaction (Supplementary Table 3, available online). One possible explanation for this discrepancy could be the composition of our study population, as HALT/CRISP, TGESP, and Genkyst included patients with typical ADPKD but not those with atypical PKD. Furthermore, the complex structure of the PKD1 gene, responsible for nearly 85% of ADPKD cases, presents challenges in its detection using a targeted gene panel, resulting in a lower mutation detection rate. The PKD1 gene consists of exons 1–33 with 97.7% identical six pseudogenes, which complicates sequencing [6,8,14]. Exon 1 of PKD1 has a guanine-cytosine nucleotide-rich content, so not all genomic regions are equally covered by next-generation sequencing [28]. The sensitivity of whole exome sequencing within exons 1–32 is only 7.14% [29]. While a targeted gene panel can be used as a potential screening method for cystic kidney disease patients, additional genetic analysis is necessary for patients who have been identified with no pathologic variants or variants of uncertain significance by the targeted gene panel.
Our study has several strengths. First, by including both typical ADPKD and atypical PKD groups in our cohort, we could identify differences in clinical and genetic characteristics between these two groups. This comprehensive approach adds to the understanding of these distinct conditions. Second, a noteworthy aspect of our cohort is the inclusion of approximately 21% of individuals with atypical PKD. Given the limited research on atypical PKD in the adult population, the substantial representation of atypical PKD cases in our study holds significant value. Third, we successfully detected genetic mutations in cystic kidney disease patients using a customized, targeted gene panel comprising 88 ciliopathy-related genes. In particular, for the challenging PKD1 gene, which is structurally complex and poses difficulties in mutation detection, we addressed technical issues by increasing read depth and coverage for PKD exon 1 (Supplementary Fig. 1, available online). Our study suggests that the targeted gene panel could be a potential screening method for cystic kidney disease patients, considering that currently used genetic analytic methods such as Sanger sequencing and whole exome sequencing are time-consuming. Lastly, our study is a nationwide cohort that includes 725 patients, representing approximately 15% of the total cystic kidney disease population in the country. This large dataset provides sufficient statistical power for robust analyses. Moreover, given that most ADPKD cohorts primarily include Western populations, our cohort is optimized to reflect the characteristics of the Korean cystic kidney disease population. The clinical and genetic profiles identified in our cohort offer valuable insights for Korean patients with cystic kidney disease.
The current study has a limitation in terms of the relatively low mutation detection rate compared to other cohorts that specifically include typical ADPKD cases. This discrepancy may be attributed to the inclusion of a heterogeneous disease entity within our cohort. Therefore, further genetic investigations are warranted for individuals who were not genetically diagnosed through the targeted gene panel tests. Another limitation is the potential underestimation of comorbidities, renal complications, and extrarenal complications due to the reliance on self-reporting from patient interviews for clinical data. For instance, the prevalence of cerebral aneurysm or valvular heart disease may have been underestimated because not all patients underwent brain imaging tests or echocardiography. Additionally, certain renal complications, such as kidney pain, were reported based on subjective patient accounts, introducing potential bias in assessing these complications.
Our study provides valuable insights into the baseline clinical and genetic characteristics of the Korean cohort with cystic kidney disease. These findings serve as a foundation for future research focused on diagnosis, prognosis, and potential therapeutic interventions for cystic kidney diseases. Furthermore, additional genetic analyses are needed for patients who presented with renal or extrarenal manifestations but did not show significant genetic mutations. These further investigations will contribute to a deeper understanding of the underlying genetic factors and expand our knowledge of cystic kidney diseases.
Supplementary Materials
Supplementary data are available at Kidney Research and Clinical Practice online (https://doi.org/10.23876/j.krcp.23.097).
Notes
Conflicts of interest
All authors have no conflicts of interest to declare.
Funding
This work was supported by the Research Program funded by the Korea Disease Control and Prevention Agency (2019-ER-7304-00, 2019-ER-7304-01, 2019-ER-7304-02).
Data sharing statement
The datasets generated during and/or analyzed during the current study are available from the corresponding author upon reasonable request.
Authors’ contributions
Conceptualization: JMC, HCP, YCK, CA, KBL, YHK, SH, YK, EHB, HGK, JC, KHO, YKO
Data curation, Formal analysis, Investigation, Methodology: JMC, HCP, JWL, YCK, CA, YK, EHB, KJ, JC, HR, EP, SK
Funding acquisition, Supervision: YCK, CA, KBL, YHK, SH, YK, EHB, HGK, JC, KHO, YKO
Project administration, Resources: KBL, YHK, SH, HGK, KHO, YKO
Writing–original draft: JMC, HCP
Writing–review & editing: HCP, KBL, YHK, SH, HGK, KHO, YKO
All authors read and approved the final manuscript.