Are there any further modalities for prediction of subclinical volume overload in advanced stages of chronic kidney disease?
Article information

Abstract
Background
Subclinical volume overload in chronic kidney disease (CKD) patient represents a debatable issue. Although many tools were used to detect volume overload in such patients, many non-specific results were due to presence of comorbidities. Bioimpedance spectroscopy is an objective fluid status assessment method, which is shown superior to classical methods in many studies. Combining some of these tools may improve their accuracy and specificity. Inferior vena cava collapsibility index (IVCCI) with brain natriuretic peptide (BNP) can be combined for more specific volume assessment. This study was performed to assess the usage of combined IVCCI and BNP levels in CKD patients to predict subclinical volume overload.
Methods
One hundred and ten patients with CKD (stages 4 and 5) not on dialysis and having normal left ventricular systolic function were included in this study. Exclusion criteria were: (1) patients with other causes of raised BNP than volume overload and (2) patients on diuretics. A complete medical history was obtained, and thorough examination and laboratory tests were performed for all included patients. IVCCI and BNP serum levels were evaluated. The patients who exhibited an overhydration (OH)/extracellular water (ECW) ratio of >15% were considered to have volume overload.
Results
Twenty-six patients (23.6%) had subclinical hypervolemia as diagnosed by OH/ECW ratio of >15%. IVCCI ≤ 38% had higher diagnostic performance than BNP ≥ 24 pg/mL. Combining both IVCCI ≤ 38% and BNP ≥ 24 pg/mL increased the specificity and positive predictive value for detection of subclinical hypervolemia.
Conclusion
Combined elevated BNP level and decreased IVCCI are more precise tools for subclinical volume overload detection in CKD patients.
Introduction
Volume overload is an essential prognostic parameter associated with compromised oxygenation, end-organ damage, prolonged hospital stays, morbidity, and mortality in chronic kidney disease (CKD) and end-stage renal disease (ESRD) patients. Volume overload manifests as left ventricular (LV) hypertrophy, hypertension, fluid shift into the third space, and increased arterial stiffness [1–6].
The use of bioimpedance spectroscopy (BIS) to detect volume overload is a novel tool that has been increasingly used due to its being simple, inexpensive, and noninvasive [7–9]. BIS is thought to be an objective fluid status assessment method more sensitive and accurate than classical methods such as BP and weight monitoring [10,11]. Whole-body BIS has now been widely used in clinical settings for the management of ESRD patients [12–14]. New research should critically evaluate the benefit of these BIS approaches in CKD patient care.
However, BIS is expensive—125 US dollars per test. This dollar value is based on the 2017 Medicare reimbursement amount [15]. Also, BIS devices are not widely available in most hemodialysis units and nephrology clinics in Egypt and other developing countries for financial reasons. Therefore, the need for the use of readily available laboratory or radiological markers to assess fluid overload (FO) in CKD patients exists.
Natriuretic peptides have been used for volume overload detection even in the absence of clinically diagnosed heart failure. Brain natriuretic peptide (BNP) levels are increased in patients with renal insufficiency [16–19]. In volume overload patients, an increase in natriuretic peptide levels was suggested to be a result of either volume expansion or LV hypertrophy or failure [20]. Although the use of natriuretic peptides for fluid status assessment is a subject of debate [16,20], numerous studies have shown a direct association between these biomarkers and hypervolemia [21,22].
Echocardiography, a widely available bedside test, is essential for assessing cardiac function in CKD patients. The inferior vena cava (IVC) acts as a reservoir for blood within the venous system, and changes in IVC collapsibility or distensibility correlate with the body’s fluid status. IVC collapsibility index (IVCCI) is the proportion of IVC collapse occurring with respiration and can be calculated by IVCCI = [IVCmax – IVCmin]/IVCmax [23]. Recent studies have demonstrated the high sensitivity and specificity of ultrasonographic evaluation of IVC collapse, and further investigations are indicated for determining the effectiveness of ultrasonography. Although many factors may affect IVC collapse measurement, ultrasonography can be used for the assessment of fluid responsiveness when bioimpedance is not available [24].
Therefore, use of the combination of IVCCI and BNP, rather than depending on a single method, is important for proper assessment of the fluid status in CKD, especially when BIS is not available or too costly. The aim of this work was to assess the combined usage of IVCCI and BNP levels as markers for concealed volume overload in patients with advanced CKD and normal LV systolic function.
Methods
A cross-sectional study was performed using data from 110 patients collected from January 2019 to October 2019 from multicenter outpatient clinics (OPCs): OPCs of Ain Shams University, Cairo Specialized Hospital, and Ain Shams University Specialized Hospital in Cairo, Egypt. The study is exempt from ethical committee approval as the authors provided full funding of the project that included only noninvasive procedures.
Inclusion criteria
Patients with CKD (stages 4 and 5) not on dialysis and having normal LV systolic function ejection fraction (> 55%) were included.
Exclusion criteria
(a) Patients with congestive heart failure (CHF) or clinical evidence of volume overload
(b) Patients with pulmonary hypertension
(c) Patients with significant structural valve lesions
(d) Patients on diuretics, angiotensin converting enzyme inhibitors, and angiotensin-receptor blockers
We collected demographic and clinical data. These data included age, sex, height, weight, body mass index (BMI), blood pressure, presence of diabetes, antihypertensive medication use, and laboratory investigations. These laboratory investigations included complete blood test; serum creatinine level; urea and uric acid level; albumin level; serum K, sodium (Na), and calcium levels; and serum BNP level.
Body composition monitor (BCM; Fresenius Medical Care D GmbH, Homburg, Germany) performed BIS for this study. BIS precisely measured the fluid status and body composition (extracellular water [ECW], overhydration [OH], fat tissue mass, and lean tissue mass [LTM]). We equated fluid to OH/ECW ratio and used this ratio to define subclinical volume overload. The patients who exhibited an OH/ECW ratio > 15% were considered to be hypervolemic [25,26].
Echocardiography
We measured LV dimensions and function and IVCCI and identified any valvular abnormalities. IVC was assessed through the subcostal window; the transducer was placed just inferior to the xiphoid process along the midline to obtain a long axis image of the IVC. The IVCCI is expressed as the difference between IVC maximum diameter (on expiration) and IVC minimum diameter (on inspiration) divided by the IVC maximum diameter; (IVCmax – IVCmin)/IVCmax × 100.
Statistical methods
Sample size justification
We used the results of Baki et al. [27] who demonstrated that the sensitivity and specificity of BNP were 71.0%% and 77.8%, respectively, and the frequency of hypervolemia was 77.5%. We assumed the null hypothesis for sensitivity and specificity as 50.0% each, a power = 0.80 and an α = 0.05. We used Power Analysis and Sample Size (PASS) system, 11th (Hintze [28]) to determine that the minimum sample size for a cross-sectional study using these parameters is 101 cases. We included 110 cases for better precision.
The collected data was coded, tabulated, and statistically analyzed using Microsoft Excel 2007 (Microsoft, Redmond, WA, USA) and IBM SPSS version 22.0 (IBM Corp., Armonk, NY, USA).
Descriptive statistics were performed on quantitative data and included range minimum and maximum and mean ± standard deviation for quantitative normally distributed data. Number and percentage are provided for qualitative data.
Inferential analyses were conducted on quantitative variables using the Shapiro-Wilk test for normality testing; an independent t test was conducted in cases of two independent groups with normally distributed data. For qualitative data, inferential analyses for independent variables was performed using the chi-square test for differences between proportions. Correlations were obtained using Pearson correlation for numerical normally distributed data. Receiver operating characteristic curve was used to evaluate the performance of different tests that differentiated between certain groups. A linear regression model was used to discover independent factors involving OH/ECW ratio. A p-value of <0.050 was considered to be significant.
Diagnostic characteristics were calculated as:
Sensitivity = (true positive test/total positive golden) × 100
Specificity = (true negative test/total negative golden) × 100
Diagnostic accuracy = ([true positive test + true negative test]/total cases) × 100
Youden’s index = sensitivity + specificity – 1
Predictive positive value = (true positive test/total positive test) × 100
Predictive negative value = (true negative test/total negative test) × 100
LR+ = sensitivity/(1 – specificity)
LR– = (1 – sensitivity/specificity)
LR = LR+/LR–
Results
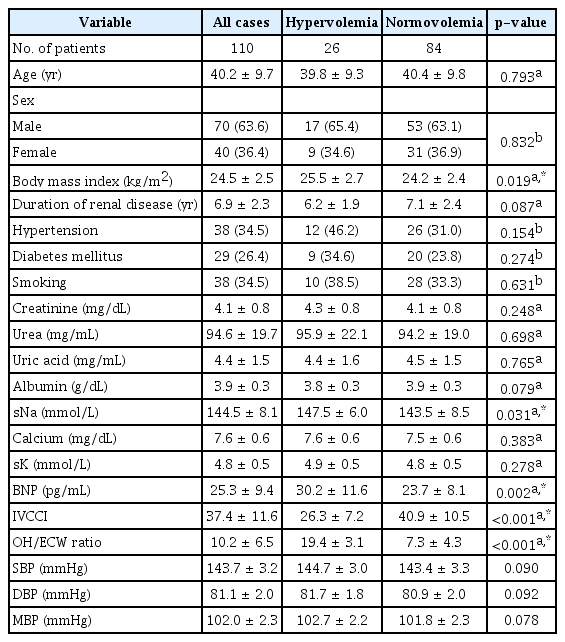
The mean age of the study group was 40.2 ± 9.7 years (Table 1). The study group’s mean BMI was 24.5 ± 2.5 kg/m2. Forty-two patients (38.2%) were diabetics and 51 (46.4%) were hypertensive. Thirty-eight patients (34.5%) were smokers. The study group’s mean glomerular filtration rate (GFR) was 23.4 ± 5.6 mL/min/1.73 m2 and mean serum creatinine level was 4.1 ± 0.8 mg/dL.
Demographic, laboratory, echocardiographic, and bioimpedance findings
Patients with hypervolemia had significantly higher BMI, serum Na, and BNP level as well as highly significantly lower IVCCI. However, there was no significant difference between hypervolemic and normovolemic patients regarding other demographic and laboratory findings in the study population (Table 1).
There were significant positive correlations between FO (OH/ECW ratio) and BMI, serum Na, BNP, systolic blood pressure, diastolic blood pressure, and mean blood pressure as well as a significant negative correlation with IVCCI. Furthermore, no significant correlations were established between OH/ECW ratio and GFR, creatinine, urea, uric acid, albumin, calcium, and potassium (Table 2).

Correlations of fluid overload as indicated by the overhydration to extracellular water ratio
The linear regression model for diagnostic factors for FO showed that, among the studied variables, only lower IVCCI and higher BNP were significantly associated with higher OH/ECW ratio (Table 3). Multivariable linear regression analysis confirmed the significant correlations between FO and both BNP and IVCCI after adjustment for confounding variables (Table 4).

Linear regression analysis between fluid overload (OH/ECW ratio) and IVCCI and BNP

Multivariable linear regression analysis for different predictors of fluid overload after adjustment for different confounders
Our data showed that, regarding diagnosis of hypervolemia, BNP (≥24 pg/mL) had a significantly low diagnostic performance while IVCCI (≤38%) had a significantly moderate diagnostic performance. Despite the correlation between fluid volume (OH/ECW ratio) and both BMI and Na, neither had a significant diagnostic performance for volume overload (Table 5, Fig. 1).

Performance of BMI, sNa, BNP, and IVCCI in diagnosing hypervolemia
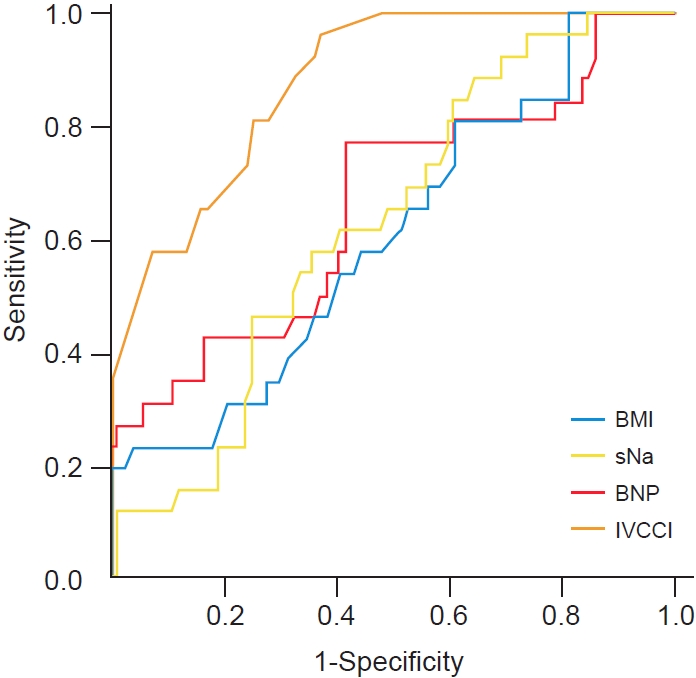
Receiver operating characteristics curves for BMI, sNa, BNP, and IVCCI in diagnosing hypervolemia.
BMI, body mass index; sNa, serum sodium; BNP, brain natriuretic peptide; IVCCI, inferior vena cava collapsibility index.
BNP had a sensitivity of 76.9% and a specificity of 58.3%; those values for IVCCI were 96.2% and 63.1%, respectively (Table 6). However, if the patient had both IVCCI ≤ 38% and BNP ≥ 24 pg/mL concurrently, the specificity and positive predictive value increased to 86.9% and 63.3%, respectively, while the sensitivity and negative predictive value decreased to 73.1% and 91.3%, respectively. If the patient had either IVCCI ≤ 38% or BNP ≥ 24 pg/mL, perfect sensitivity and negative predictive value (100%) were achieved at the expense of decreased specificity and positive predictive value (Table 6).

Diagnostic characteristics of BNP and IVCCI cutoff points in hypervolemia
Discussion
Routine evaluation of hydration includes monitoring of body weight and blood pressure changes that are not reliably determined by fluid volume. Edema is not usually detectable until interstitial fluid volume increases 30% over normal levels (4–5 kg gain in body weight), and severe dehydration can occur before appearance of clinical signs. Thus, traditional indicators of over- and under-hydration in patients with renal disease are insensitive and inadequate [15].
Volume status assessment of advanced CKD (stages 4 and 5) patients not on dialysis is crucial. Clinical sign assessments are also essential even though a significant number of patients have subclinical volume overload with no evident clinical signs. For example, dependent edema is occasionally challenging to identify, especially in nonambulatory patients. Other physical measurements, such as changes in body weight or blood pressure, are influenced by many issues other than volume load status. Early detection of this problem can prevent deleterious sequelae [24].
BIS is one of the modifications of bioimpedance analysis. Chamney et al. [29] developed a “three-compartment body model”, which differentiates between normally hydrated LTM, adipose tissue mass, and a virtual OH compartment. This model assumes a fixed hydration of LTM and adipose tissue mass that results in the calculation of a “normohydration weight.” The OH compartment is calculated as the difference between the measured and the expected ECW. “Expected” is the difference found in the normally functioning population; the 10th to 90th percentile (–1.1 L and +1.1 L) of the normal population is considered to represent a normovolemic situation. Literature definitions of FO vary between a value of >1.1 L and 2.5 L (or an OH/ECW ratio above 7% or 15%). Fluid depletion is defined as an FO level below –1.1 L [30].
The BIS method relies on the assumption that low-frequency current flows through the extracellular fluid (ECF) and high-frequency current penetrates ECF and intracellular fluid. These assumptions are open to criticism largely because of their derivation from in vitro studies of cells suspended in fluid; cell-cell interfaces that occur in tissues are ignored. These calculations are performed with software provided by the manufacturers of the different BIS instruments and are subject to change. Significant errors can occur in the estimation of total body water (TBW, 2 L) and ECW (~1 L) in individuals with increased adiposity. A proposed remedy to this limitation is the use of BMI as a proxy for adiposity. A limitation of the use of BMI as a surrogate for body fat content is the lack of sensitivity of BMI to reliably differentiate the body composition (body fat and muscle mass) of an individual, healthy or ill. A consistent observation is the wide limits of agreement between the impedance and reference methods that cautions against the use of these methods for individual assessment of fluid volumes [31].
Using BNP level to assess volume overload is relatively inexpensive; however, due to relatively low specificity, more studies are needed to clarify the effectiveness of BNP level in assessing volume overload in CKD patients [27].
IVCCI is the proportion that the IVC collapses with respiration and can be calculated by IVCCI = (IVCmax – IVCmin)/IVCmax [23]. Changes in collapsibility or distensibility correlate with the body’s fluid status. However, IVCCI’s validity is questionable since IVC diameter does not only depend on volume status and may be affected by respiration, right heart function, and intraabdominal or intrathoracic pressure changes. Also, IVC imaging can be challenging especially in patients with large body habitus, excessive bowel gas, or large amounts of intrathoracic air [32,33]. A recent study showed that, after a certain threshold, IVCCI is considerably specific and sensitive for observing volume expansion [32].
Therefore, the combination of IVCCI and BNP, rather than depending on a single method, is important for proper assessment of the fluid status in CKD. This combination improves the specificity of the individual tests and may provide a guide to optimize medical management, especially when BIS is not available or too costly. Combining these tools may improve the accuracy and specificity of both and justifies using both rather than each one individually. Therefore, in this current study we evaluated the combination of these two easy and readily accessible tools. Our study population consisted of 110 patients with CKD in whom we detected volume overload before being evident clinically by measuring both IVCCI and BNP levels.
We assessed volume overload in the 110 cases by measuring OH/ECW ratio that equated to FO. We found that 26 patients (23.6%) had subclinical hypervolemia (OH/ECW > 15%). Data on subclinical volume overload in CKD patients is scarce. A few studies evaluated subclinical volume overload only in dialysis patients. Although there was paucity of data about the percentage of subclinical volume overload in CKD patients, few studies evaluated this issue; however, they included only patients on dialysis. One study of them which evaluated 100 hemodialysis patients, showed close results to ours; with the percentage of FO (29%) using BIS despite being clinically euvolemic. FO was defined by a relative tissue hydration, i.e., OH/ECW > 15%, which was the similar parameter used in our study to define hypervolemia [25].
Concerning the demographic and laboratory data, we found no significant differences between hypervolemic and euvolemic patients regarding age, sex, and presence of hypertension or diabetes. These results agreed with Antlanger et al. [34] who reported no significant sex and age differences in cases of FO.
Hung et al.’s study [35] findings of data from 338 patients partially disagreed with our results. That group demonstrated a significant correlation between hypervolemia and diabetes mellitus. These conflicting results may be attributed to the larger sample size and a higher percentage of diabetics in that study. However, normo- and hypervolemic groups demonstrated significant differences; higher BMI, serum Na, BNP level, and lower IVCCI were present in the hypervolemic group.
Hypernatremia in subclinical hypervolemic CKD patients, although not commonly seen in patients with clinical volume overload, can be explained. Some patients, particularly those in late stages of CKD were prescribed sodium bicarbonate for treatment of metabolic acidosis leading to hypernatremia. This resulted from osmotic diuresis caused by elevated serum urea, impaired renal concentrating capacity, or nephron loss. Impaired angiotensin II production, which may contribute directly to the impaired thirst mechanism, or excessive water restriction may also be involved [36–38].
Another mechanism may be the use of loop diuretics that interfere with medullary hypertonicity with resultant electrolyte-free water loss from collecting ducts, but the use of diuretics was one of our exclusion criteria.
Similar to the Hung et al.’s study [35], we demonstrated significant correlations between hypervolemia and serum Na and BNP levels. As expected, in our study hypervolemia had an important correlation with BMI since excessive body fluids accumulate in the extracellular compartment. A study conducted by Kwan et al. [39] had results consistent with ours. In that study, BMI had a significant correlation with OH (r = 0.376, p < 0.001).
Our data showed a highly significant negative correlation between hypervolemia and IVVCI (p < 0.001). Barbier et al. [32] showed that, after a certain threshold, IVCCI was highly specific and sensitive for demonstrating volume expansion. Some other studies evaluated this and determined that its accuracy is unproven as IVC diameter is affected by factors other than volume status [33–40].
Allinovi et al. [41] performed fluid assessments on 13 children on dialysis (eight on peritoneal dialysis and five on hemodialysis) with a median age of 4.0 years (range, 0.8–14.0 years). Their results disagreed with our data. The negative correlation between IVCCI and FO was not significant in their study. These conflicting results may be related to many factors; their study consisted of a small number of young patients and had a single-center design that lacked a robust gold standard measurement of FO.
Regarding BNP as a tool for volume overload detection, our study showed that there was a significant correlation between BNP level and hypervolemia (p = 0.002). BNP is useful for the evaluation of ventricular dysfunction in patients with various cardiac diseases. However, its diagnostic value has been considered to be limited in patients with chronic renal failure (CRF) because renal dysfunction may affect BNP levels. Takami et al.’s findings [42] support that plasma BNP level is a reliable marker of LV overload, even in patients with CRF not on dialysis. Also, a high BNP level (≥150 pg/mL) may have powerful predictive potential for heart failure in these patients. These results also agreed with those of Bongartz et al. [43] who reported that high plasma BNP concentrations were associated with volume overload in CKD patients.
Our results demonstrated a cutoff value for BNP’s usefulness in diagnosing FO (≥24 pg/mL). However, no data for determination of a BNP level cutoff point for detecting subclinical volume overload in CKD patients not undergoing dialysis are available. Further studies are required to resolve this important issue. However, a study on 40 chronic dialysis patients suggested that a BNP level cutoff value of 17.65 pg/mL can be used to diagnose volume overload [31]. A cohort study of 348 consecutive patients evaluated the role of B-type natriuretic peptide in diagnosing acute decompensated heart failure in CKD patients. In the patients with heart failure and preserved EF in CKD stages 3 and 4, BNP < 155 pg/mL was sufficient to rule out acute decompensated heart failure [44].
Our results showed an IVCCI ratio cutoff value of ≤38% for diagnosing FO in CKD patients. However, there were no previous data determining the cutoff value of IVCCI, IVCCI sensitivity, and IVCCI specificity to assess concealed volume overload in CKD patients. Some studies did evaluate IVCCI values in hemodialysis patients. In a study with 22 patients in whom dry weight was determined on clinical grounds, only six had a correct dry weight according to IVC indices [44]. Another study on 40 patients on dialysis to assess volume overload in CRF determined that volume status was categorized as either hypervolemia if IVCCI was <40% or hypovolemia if IVCCI >75% [45].
Our study found a sensitivity of 76.9% and a specificity of 58.3% for BNP and values of 96.2% and 63.1%, respectively, for IVCCI in the diagnosis of OH in CKD. In a 2013 prospective study, Anderson et al. [46] explored the accuracy of IVCCI, which was more specific than sensitive in diagnosing CHF, and BNP, which was highly specific. Concerning the concept of the study that combined two modalities to detect subclinical volume overload in CKD patients, there was no previous data for comparison. Our results showed that, for diagnosing hypervolemia, BNP (≥24 pg/mL) had a significantly low diagnostic performance, and IVCCI (≤38%) had a significantly moderate diagnostic performance. Moreover, the specificity and positive predictive value increased, but the sensitivity and negative predictive value decreased, with the concurrent use of IVCCI and BNP. However, if the case had any IVCCI or BNP, perfect sensitivity and negative predictive value were achieved but at the expense of decreased specificity and positive predictive value.
One of the limitations of this study is that we used only OH /ECW as the reference value for volume overload; comparisons of BNP and IVCCI using multiple reference values including ECW/ICW and ECW/TBW may have been more informative.
While IVCCI showed high sensitivity and specificity, measuring BIS with devices such as BCM is easier for assessing FO. This is due to the limited availability of expert echocardiologists in dialysis centers.
Using BIS as reference, we proved that combining IVCCI with a cutoff value of ≤38% and BNP with cutoff value of ≥24 pg/mL provides an accurate alternative to BIS for detection of subclinical volume overload in predialysis CKD patients. Further studies with a larger sample size are needed to evaluate the clinical impact of these findings on patient outcomes and mortality.
Notes
Conflict of interest
All authors have no conflicts of interest to declare.
Authors’ contributions
Conceptualization: AHB
Data curation: AHB, HM
Formal analysis: CRK
Investigation: AHB, HM
Methodology: AHB, HM
Project administration: AHB
Visualization: AHB
Writing–original draft: AHB, HM
Writing–review & editing: AHB, CRK
All authors read and approved the final manuscript.
Acknowledgements
We acknowledge Dr. Hazem Elhariry for his statistical analysis, and Dr. Bishoy Tanagho for his help in paper submission.