Monitoring globotriaosylsphingosine in a Korean male patient with Fabry disease
Article information
Fabry disease is a lysosomal storage disease caused by α-galactosidase A (α-Gal A) deficiency, resulting in globotriaosylceramide (GL-3) accumulation within lysosomes and various clinical features, including kidney failure. GL-3 may be converted to deacylated globotriaosylceramide (globotriaosylsphingosine: lyso-GL-3) [1], but the exact source of lyso-GL-3 is under investigation. Treatment of Fabry disease consists of replacing the deficient enzyme with recombinant human α-Gal A, and experts recommend starting enzyme replacement therapy if a symptom or sign is noticed [2]. Recent studies proposed lyso-GL-3 as a better biomarker of treatment response than GL-3 [3–5]. In this study, we first report a case of Fabry disease in a Korean patient in whom lyso-GL-3 level was high and subsequently declined after enzyme replacement therapy. The present case may be helpful for physicians in clinical practice to trace plasma lyso-GL-3 before and after enzyme replacement therapy in Korean patients with Fabry disease.
A 29-year-old Korean man initially visited the rheumatology department with a complaint of chronic pain in his left lower leg. However, he was referred to the nephrology department because of decreased kidney function and proteinuria. The patient’s blood laboratory findings were as follows: blood urea nitrogen, 17 mg/dL; creatinine, 1.90 mg/dL; and estimated glomerular filtration rate (eGFR) using the Chronic Kidney Disease Epidemiology Collaboration equation [6], 47.0 mL/min/1.73 m2. His random urine protein-to-creatinine ratio was 3.1 g/g.
To determine the cause of azotemia and proteinuria, kidney biopsy was performed. Light microscopy revealed diffuse foamy changes in podocytes. Focal interstitial fibrosis, tubular atrophy with foam cell changes, and fibrointimal thickening in blood vessels were also observed (Fig. 1A, B). Electron microscopy revealed diffuse lipid deposits in all podocytes, glomerular endothelial cells, and mesangial cells. Electron-dense deposits were not present. The foot processes of podocytes were diffusely effaced (Fig. 1C, D). Immunofluorescence analysis revealed weak positivity for immunoglobulin G and M but negativity for other markers, such as immunoglobulin A, complement, and fibrinogen.

Renal and non-renal manifestations of Fabry disease
(A) Focal interstitial fibrosis (arrow) (H&E, ×400). (B) Diffuse foamy changes in podocytes (arrowheads) and fibrointimal thickening in blood vessels (arrow) (periodic acid-Schiff, ×400). (C) Zebra bodies in podocytes (electron microscopy, ×3,000). (D) Diffuse effacement in foot processes of podocytes (electron microscopy, ×8,000). (E) Angiokeratoma in the gluteal region. (F) T2-weighted fluid-attenuated inversion recovery brain magnetic resonance image: approximately 6-mm-high signal intensity in the right posterolateral putamen (arrow). (G) T1-weighted brain magnetic resonance image; approximately 6 mm slightly low signal intensity in the right posterolateral putamen (arrow). (H) Gene analysis findings.
The patient’s non-renal features of Fabry disease were further investigated. Physical examination identified clusters of deep-red to purple papules on both thighs, which was diagnosed as angiokeratoma by skin biopsy (Fig. 1E). Echocardiography revealed hypertrophy of the basal septal wall (14 mm) but no other abnormal findings, such as the ejection fraction, systolic function, and regional wall motion. Brain magnetic resonance imaging uncovered a suspected ischemic lesion in the right posterolateral putamen (6 mm lesion with high signal intensity on a T2-weighted fluid-attenuated inversion recovery image and low signal intensity on a T1-weighted brain magnetic resonance image) (Fig. 1F, G). An ophthalmic examination was performed, but there was no abnormality in either cornea. The α-Gal A activity was measured using a fluorometric assay on white blood cells, and the activity was reduced to 3.3 nmol/hr/mg protein (reference, 35–100 nmol/hr/mg protein; 3.5% of activity). The α-Gal A activities of the patient’s younger brother and mother were also low. Direct sequencing analysis confirmed a hemizygous mutation in c.275A>G (p.Asp92Gly) (Fig. 1H). Based on these results, the patient was diagnosed with classical Fabry disease.
The patient was treated with 1.0 mg/kg recombinant agalsidase-β (Fabrazyme®; Sanofi Genzyme, Cambridge, USA) every other week and losartan 50 mg per day. The patient’s plasma GL-3 and lyso-GL-3 concentrations were measured at baseline and every 3 months. The baseline plasma GL-3 level was 10.9 μg/mL (reference, 3.9–9.9 μg/mL), and it decreased to 7.9 μg/mL after 9 months of treatment (Fig. 2A). The baseline plasma lyso-GL-3 level was 108 ng/mL (reference, ≤ 1.74 ng/mL), and its level declined to 24.8 ng/mL after 9 months of treatment (Fig. 2B). The patient’s eGFR level remained static throughout the follow-up period (Fig. 2C). The random urine protein-to-creatinine ratio was not aggravated during treatment (Fig. 2D).
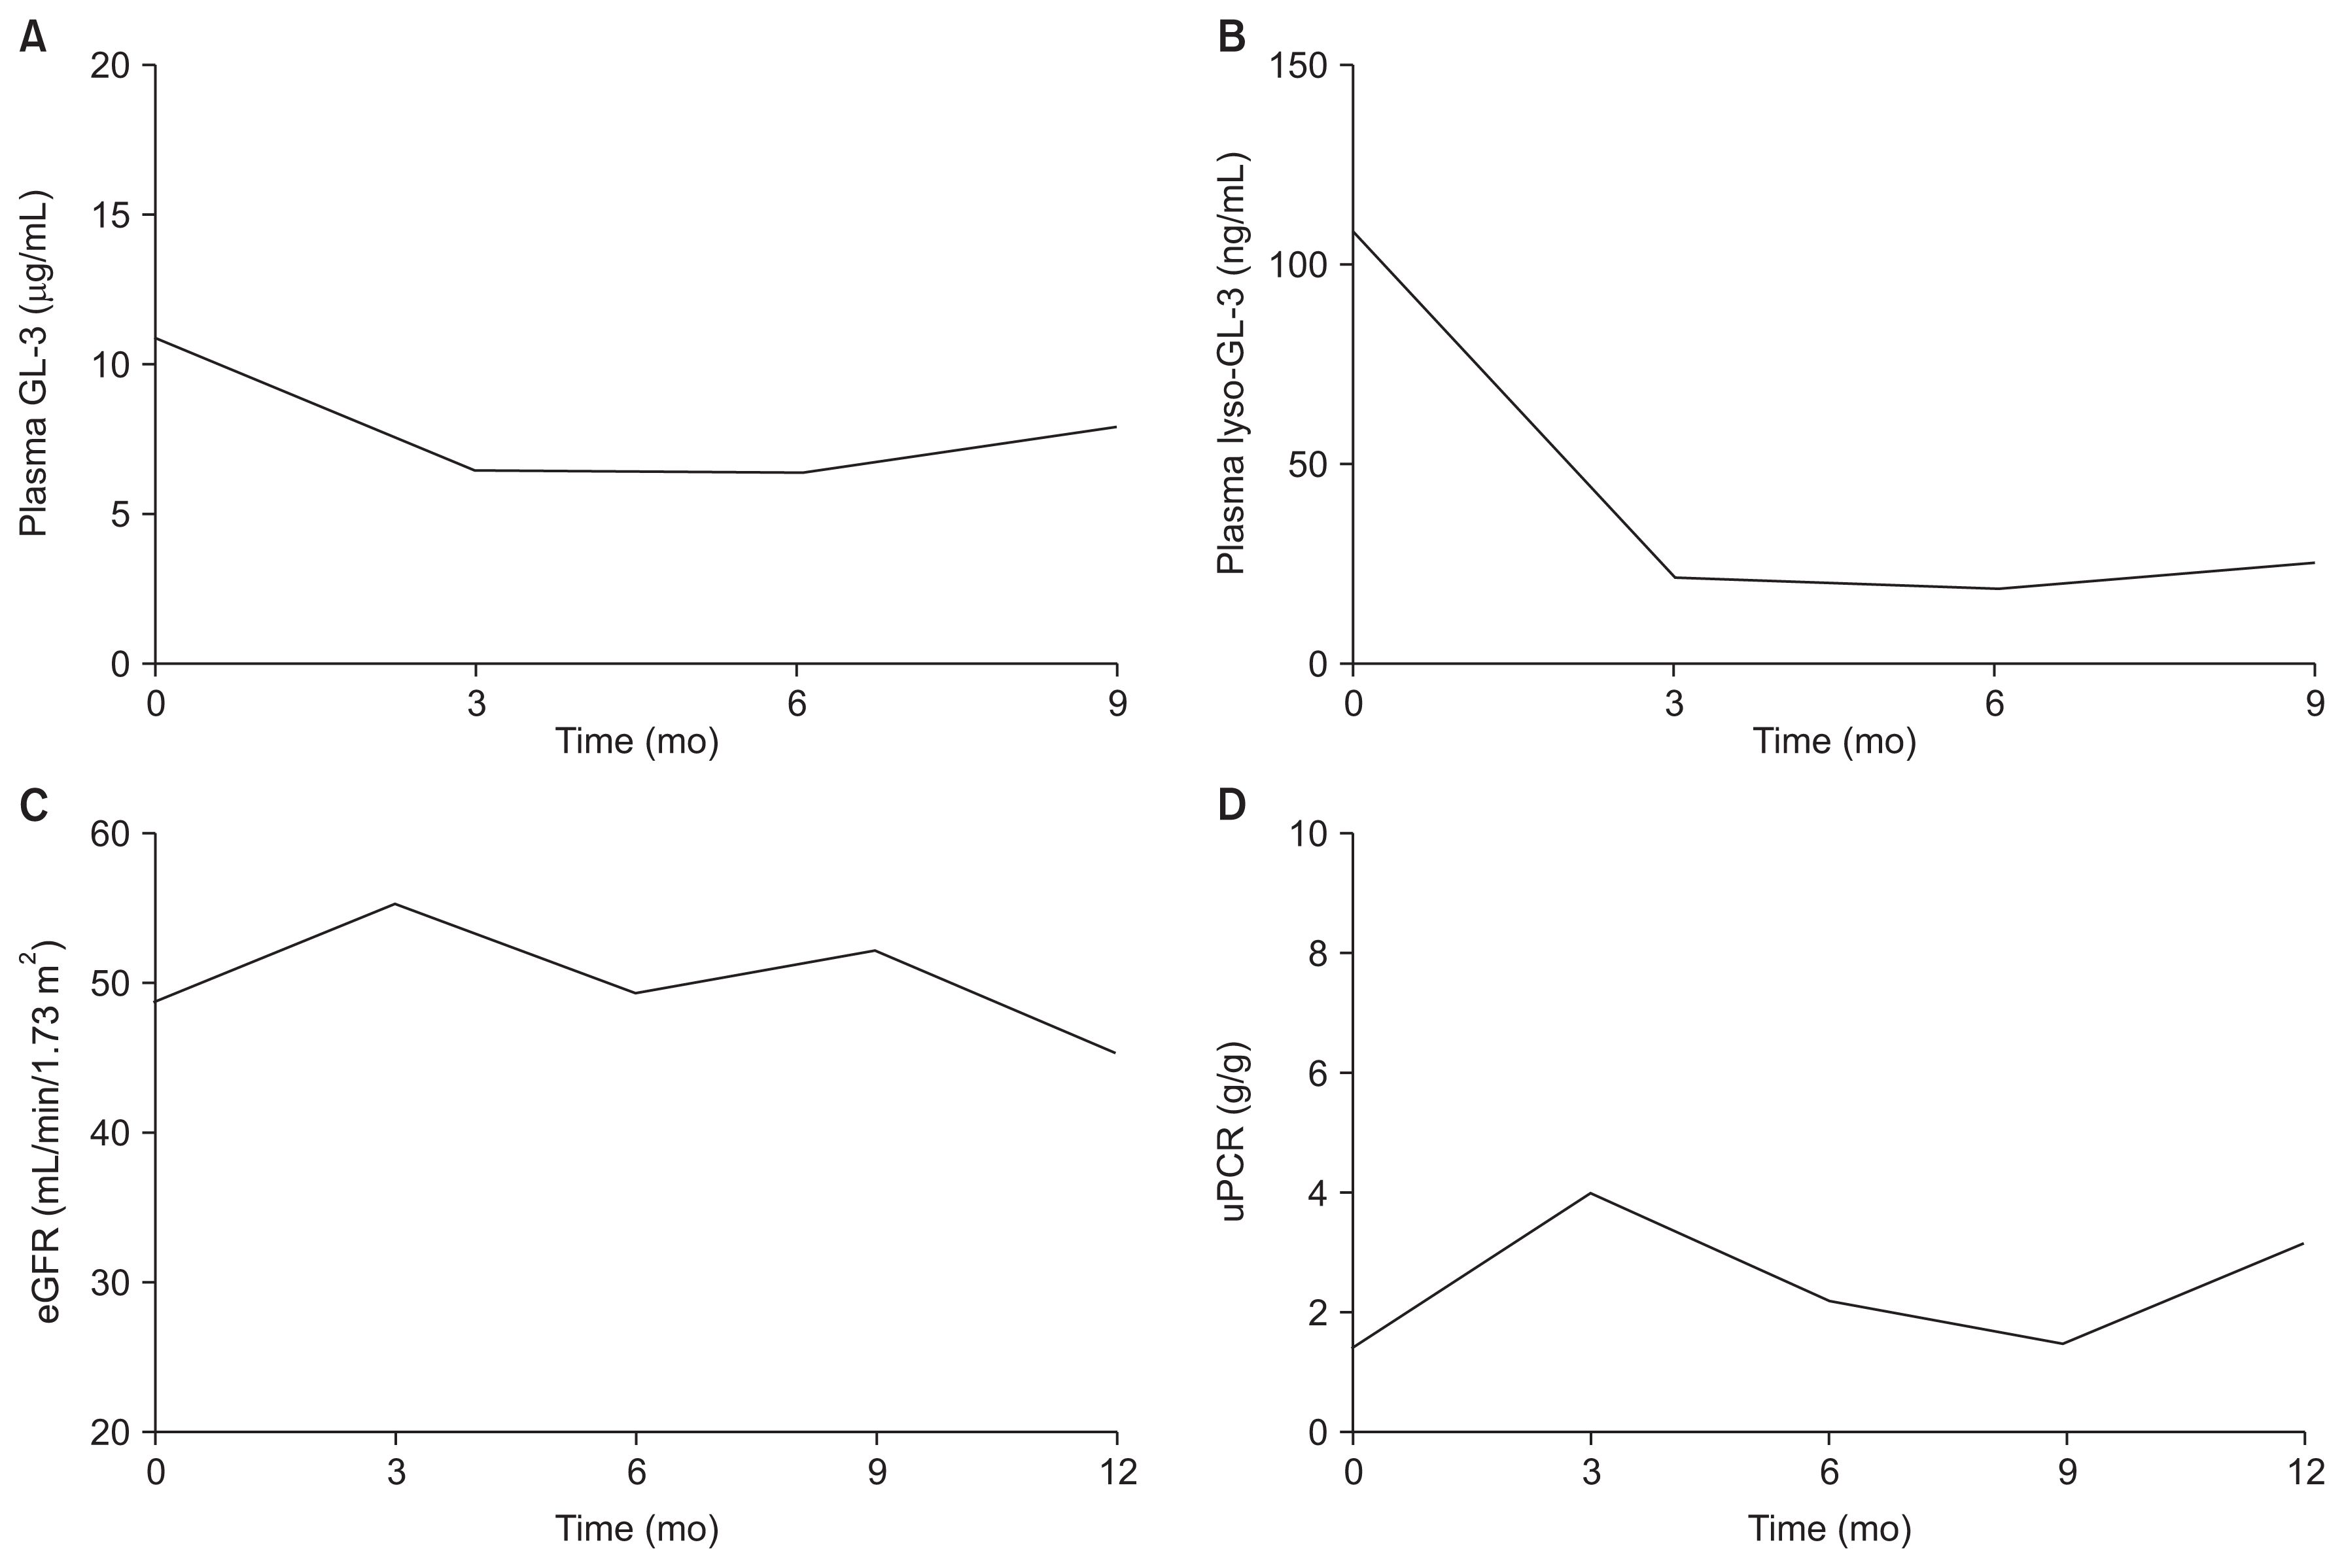
Treatment response
(A) Plasma globotriaosylceramide (GL-3). (B) Plasma deacylated globotriaosylceramide (globotriaosylsphingosine: lyso-GL-3). (C) Estimated glomerular filtration rate (eGFR). (D) Random urine protein-to-creatinine ratio (uPCR).
This study was approved by the Institutional Review Board of Seoul National University Hospital (No. H-1802-065-922) and was conducted according to the Declaration of Helsinki. The patient provided informed consent.
Notes
Conflicts of interest
All authors have no conflicts of interest to declare.