


Introduction
Sarcopenia results in decreased quality of life (QoL) and increased mortality in chronic kidney disease (CKD) and end-stage renal disease (ESRD) patients [1–3]. CKD-associated inflammation and imbalance of protein homeostasis leads to progressive loss of weight, strength, and functional capacity [4]. These changes can be aggravated in dialysis patients due to the catabolic effect of the hemodialysis (HD) itself [5,6].
Exercise and nutritional support showed effectiveness as prevention and treatment strategies for sarcopenia [7]. However, HD patients, especially elderly patients, have reported low levels of physical activity and severe malnutrition known as protein energy wasting [8,9]. These conditions make HD patients more vulnerable to sarcopenia. Therefore, several investigations demonstrated the beneficial effects of exercise intervention alone or combined with nutritional support in HD patients to improve sarcopenia [10]. However, several clinical trials of intradialytic interventions have been conducted due to the limitations of exercise interventions in clinical practice. Intradialytic exercise can enhance or replace physical exercise in frail and exercise-hesitant HD patients [11]. Recently, several studies evaluated the efficacy of intradialytic neuromuscular electrical stimulation (NMES) in sarcopenia [12–15]. Furthermore, oral nutritional supplementation including protein improved body composition, physical function, nutritional status, or QoL in HD patients [9,16–18].
However, to our knowledge, there has been no research on the effect of simultaneous nutritional support and NMES in dialysis patients. Therefore, we evaluated the differential effectiveness of NMES and protein supplementation during HD on muscle strength, muscle mass, physical function, and QoL.
Methods
This study was approved by the Institutional Review Boards of the participating hospitals (National Medical Center, No. M-1911-018-001; Hanyang University Guri Hospital, No. 2020-01-019-002; Seoul National University Hospital, No. J2009-151-1160; and Dongguk University Ilsan Hospital, No. 2019-11-031). We conducted this study in compliance with the principles of the Declaration of Helsinki. All participants provided informed consent. This study protocol was registered with the Clinical Research Information Service, Korea (KCT0005573).
Study design and population
This was a 12-week, randomized controlled, parallel-group, multicenter trial of intradialytic NMES and protein supplementation for HD patients. Participants were randomly assigned in a 1:1:1:1 ratio to the control (C), protein supplementation (P), intradialytic NMES (NMES), and NMES + P groups. This study was conducted by block randomization (block size of 4; stratified block randomization schedule for four institutions). Measurements were scheduled at baseline and at follow-up every 4 weeks.
Subjects were eligible for inclusion in this study only if all of the following criteria apply: 1) ESRD patients who have been receiving HD for 3 months or more; 2) stable ESRD patients who did not have recent acute kidney injury, uncontrolled medical conditions or catabolic states; and 3) patients who can thoroughly understand the protocol. Subjects were excluded for any of the following reasons: 1) uncontrolled hypertension, diabetes mellitus (DM), or heart failure; 2) hematologic or solid organ malignancies under treatment; 3) active infection; 4) positive for human immunodeficiency virus/AIDS; 5) history of ischemic heart disease, stroke, or deep vein thrombosis within 3 months before enrollment; 6) contraindication to electronic stimulation including implantable defibrillator; 7) skin lesions around the electrical stimulation spots; 8) allergy to protein supplements; and 9) researcher’s decision regarding inappropriateness of enrollment in the study.
Interventions
Neuromuscular electrical stimulation
NMES was conducted during each dialysis session three times per week for 12 weeks. NMES was performed as follows using a four-channel functional electrical stimulation instrument (FES-1000/5000; Stratec): impulse type, symmetrical biphasic; impulse width, 400 microseconds; impulse frequency, 60 Hz; and impulse on/off time, 4/8 seconds. The impulse intensity was individually adjusted to the maximum tolerated intensity for each session due to the pain threshold of participants (impulse intensity range of the electrical stimulation instrument, 0–100 mA; range of applied stimulation intensity, 20–94 mA) [12,13]. Adhesive electrodes were attached to a total of four areas of the bilateral vastus medialis and vastus lateralis. NMES was administered for 20 minutes during the first week and for an additional 2 minutes every week thereafter until 30 minutes.
Protein supplementation
Protein supplements were provided and consumed at the beginning of every dialysis session in the P group and immediately after the NMES in the NMES + P group. A total of 25 g (445 kcal) of renal-specific protein supplements, including whey and soy proteins (protein 15 g, 400 kcal; Mediwell) and protein isolate powder (nutria-bridge protein powder; protein 10 g, 45 kcal) from Maeil Co. Ltd., were mixed together and taken.
Assessments
Primary outcome
Muscle strength
The primary outcome was the difference in hand grip strength (HGS) and leg muscle strength (LMS) at 12 weeks among the four treatment groups. Digital hand and leg dynamometers (T.K.K. 5401 and T.K.K. 5710e/5715; Takei Scientific Instruments Co., Ltd.) were used to measure the sitting and standing HGS (on the opposite side of the fistula) and LMS of both knee joint extension muscles as directed in the manufacturer’s instructions. Measurements were repeated three times at intervals of 1 to 2 minutes, and the highest measurement results were used.
Secondary outcomes
Physical performance
A 10-m walking course comprised a 6-m measurement course and a 2-m acceleration and deceleration zone. Participants walked at their usual speed along the 2 meters before and after the measurement point (using the dynamic-start method) following the examiner’s instructions. Furthermore, the timed up and go (TUG) test was performed. Participants repeated the walking speed and TUG tests two times, and the faster results were analyzed.
Biological measures and body composition
Biological measures included vital signs; laboratory exams including hemoglobin, total protein, serum albumin, phosphorus, blood urea nitrogen (BUN), serum creatinine (SCr), total CO2, intact parathyroid hormone (iPTH), highly sensitive C-reactive protein (hs-CRP), normalized protein catabolic rate (nPCR), and Kt/V.
Muscle mass was measured by using an InBody S10 (InBody Co., Ltd), an instrument based on bioelectrical impedance analysis, within 30 minutes after dialysis. We collected data including skeletal muscle mass (SMM), SMM/body weight (Bwt, %), appendicular SMM (ASM), ASM/Bwt (%), ASM/height2, lower extremity skeletal mass (LESM), LESM/Bwt (%), and LESM/height2.
Questionnaires
The Kidney Disease Quality of Life short form version 1.3 was used to evaluate the health-related QoL. The self-administered version of the International Physical Activity Questionnaire (IPAQ) and the Korean version of the Physical Activity Scale for the Elderly (K-PASE) were used to assess the activity in the last 7 days. Geriatric depression scale (GDS) and the Korean version of the Falls Efficacy Scale (KFES) data were obtained to measure depression and the fear of falling.
Adverse events
NMES applied to the lower extremities has been reported to be relatively safe, attributed to its localized effects on the targeted muscles, and it has been used safely during dialysis or even in the intensive care units [13,14,19,20]. However, we closely monitored adverse events, vital signs, and laboratory findings during and after NMES.
Sample size
Sample size estimation was based on detecting a between-group difference in LMS at the end of the study according to the results from the previous study [13]. Assuming a two-tailed hypothesis, an alpha value of 0.0083 due to the correction for type 1 error according to multiple tests, and a desired power of 80%, 13 participants were needed per group. To allow a 25% dropout rate, we calculated the required sample size to be 18 per treatment group.
Statistical methods
We performed the primary analysis by per-protocol methods and included patients for whom all the data were completed without major protocol deviations. We conducted all statistical analyses by using IBM SPSS version 20.0 (IBM Corp.). The data are reported as the mean and standard deviation or frequency and percentage. We used the Student t test (or Mann-Whitney U tests), paired t tests (or Wilcoxon signed-rank tests), and analysis of variance (or Kruskal-Wallis test) for the continuous variables, and the chi-square test for the categorical variables. The between-group differences in the outcome measures after the intervention were assessed by using repeated measures analysis of variance. To assess the effects of NMES intensity on outcomes, we performed the subgroup analysis by dividing NMES and NMES + P groups into high- and low-intensity NMES groups based on the amount of applied NMES (sum of intensity for each dialysis session) delivered throughout the study period. We considered a p-value of <0.05 as statistically significant. The Bonferroni correction was used for multiple comparisons.
Results
Study population and baseline characteristics
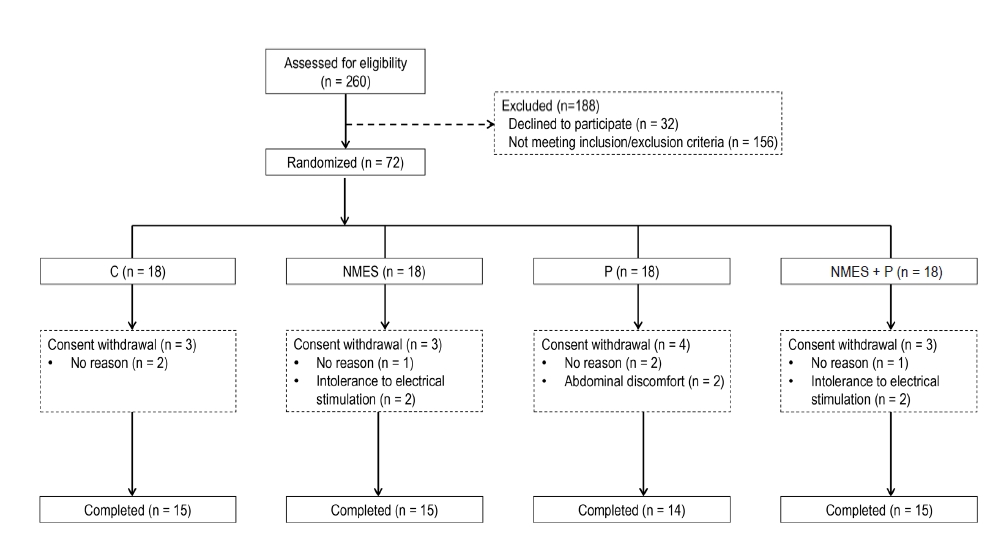
A total of 72 patients were randomly assigned to the C, P, NMES, and NMES + P groups, 13 patients withdrew from the study, and 59 patients completed all the study outcomes (Fig. 1). The baseline characteristics of the participants are summarized in Table 1. There were no significant differences in age, sex, HD vintages, or biochemical results among the four treatment groups. Four participants in the NMES and NMES + P groups withdrew from the study due to intolerance to tingling sensation caused by NMES. However, there were no severe adverse events related to NMES.
Muscle strength and physical performance
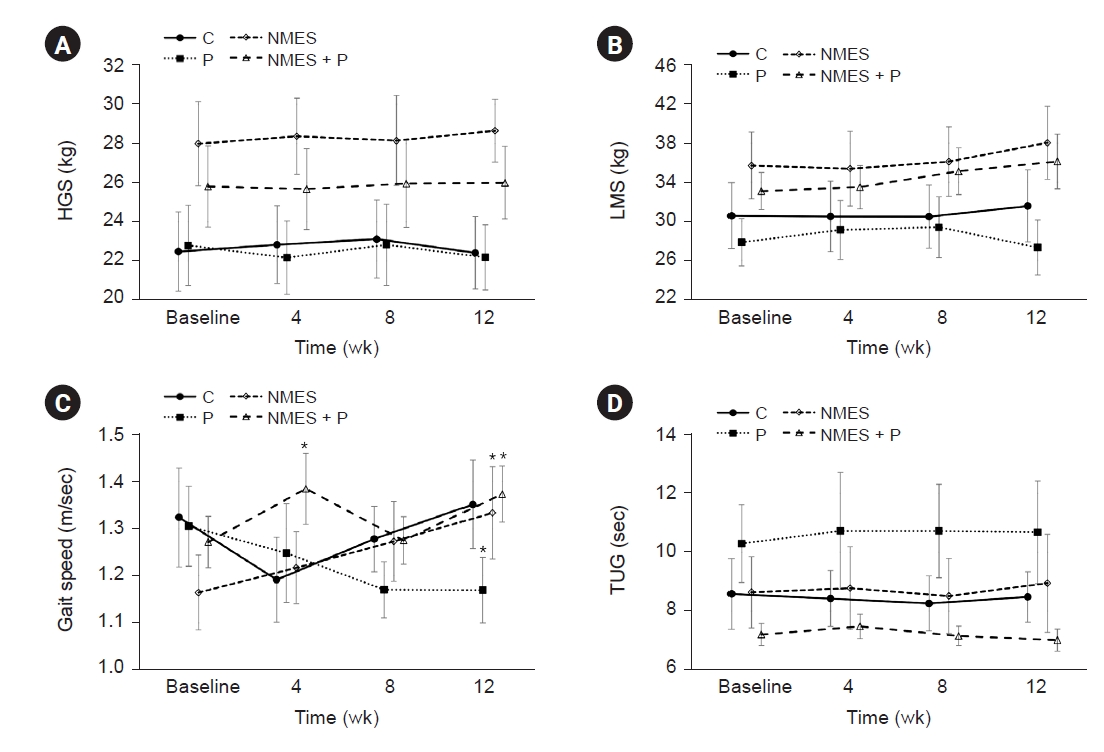
Muscle strength and physical performance at each time point are presented in Fig. 2. The HGS (Fig. 2A) and LMS (Fig. 2B) were not different among the treatment groups and were not changed during the study period. A difference in gait speed among the treatment groups was not observed during the study period (Fig. 2C). However, the gait speed in the NMES and NMES + P groups increased from baseline to 12 weeks (1.16 ± 0.31 to 1.33 ± 0.38 m/sec, p = 0.003 in the NMES group; 1.27 ± 0.21 to 1.37 ± 0.23 m/sec, p = 0.02 in the NMES + P group), while gait speed (GS) decreased in the P group (1.31 ± 0.32 to 1.17 ± 0.26 m/sec, p = 0.04). There was an interaction between time and treatment groups (Supplementary Table 1, available online). TUG test was not different among the four treatment groups throughout the study period (Fig. 2D).
Biological measures and body composition
Biological measures and body composition among groups were summarized in Supplementary Table 2 (available online). The maximal changes in systolic blood pressure and pulse rate over ultrafiltration during dialysis were not different among the four treatment groups throughout the study period. There were no significant differences in biochemical results, including serum albumin, BUN, SCr, phosphorus, total CO2, iPTH, hs-CRP, Kt/V, or nPCR throughout the study period. In addition, body composition (SMM, ASM, and LESM) showed no differences among the four treatment groups during the study period.
Questionnaires
There were no significant differences in the QoL scores at baseline among the four treatment groups, except for symptoms/problems (Table 2). The symptoms/problems scores in the C and P groups were higher than those in the NMES and NMES + P groups. The kidney disease effect and the overall health ratings improved in the NMES + P group, while bodily pain and mental health worsened in the P group from baseline to 12 weeks. Role limitations due to physical and emotional problems improved in the NMES + P group. Physical function scores in the NMES and NMES + P groups were higher than scores in the C and P groups at 12 weeks, and physical function decreased in the C group throughout the study period. There were no interactions between time and treatment groups in the scores mentioned above. There were no significant differences in physical activity (metabolic equivalent of task by IPAQ and K-PASE), depression (GDS), or the fear of falling (KFES) among the four treatment groups (Supplementary Table 3, available online).
Comparison according to the intensity of neuromuscular electrical stimulation
We divided the NMES and NMES + P groups into high- and low-NMES intensity groups based on the NMES intensity (sum of intensity for each dialysis session) delivered throughout the study period (median of 1,427.5, approximately 40 mAp per dialysis session). The proportion of participants from the NMES/NMES + P groups in the high- and low-NMES intensity groups was 7/8 (46.7%/53.3%) and 8/7 (53.3%/46.7%), respectively. There were no significant differences in age (57.3 ± 11.9 years vs. 63.7 ± 14.4 years), ESRD cause (DM; 44.4% vs. 55.6%), or HD vintages (32.3 ± 41.9 years vs. 37.3 ± 32.3 years) between the high- and low-NMES intensity groups, respectively; however, all female participants were included in the low-NMES intensity group (male:female, 10:5 in the low-NMES group; 15:0 in the high-NMES group).
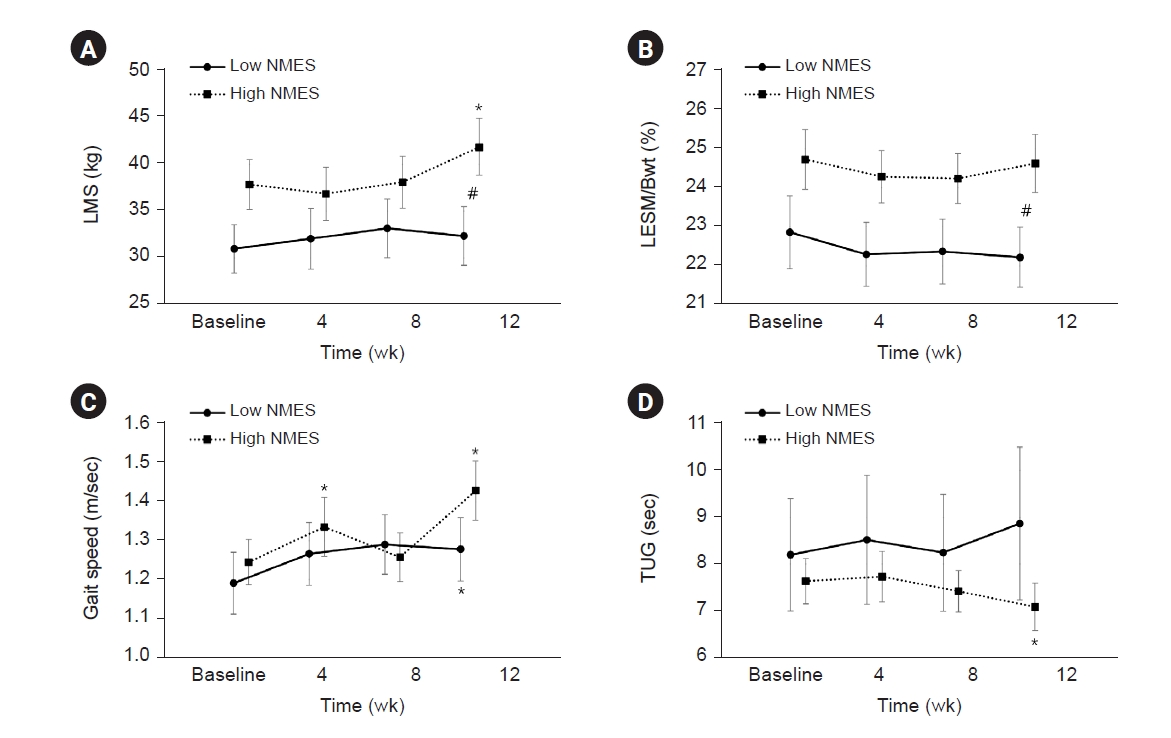
The LMS was improved only in the high-NMES intensity group (p = 0.026) (Fig. 3A). The LESM/Bwt was not significantly different at baseline between the high- and low-NMES intensity groups; however, differences between the two groups became significant thereafter (22.9±3.62 and 24.7±2.98, p = 0.13 to 22.2±2.97 and 24.6±2.89, p = 0.03) (Fig. 3B). Both high- and low-NMES intensity groups showed improvement in GS (p = 0.001 and p = 0.04 in the high- and low-NMES intensity groups, respectively) (Fig. 3C). Results from TUG test was shortened in the high-NMES intensity group (p = 0.048) (Fig. 3D). TUG test showed the interaction between time and treatment groups (Supplementary Table 4, available online). In addition, the total CO2 levels in the high-NMES intensity group were higher than those in the low-NMES intensity group throughout the study period (Supplementary Table 5, available online). Furthermore, overall health ratings, physical function, and general health significantly improved only in the high-NMES intensity group (Supplementary Table 6, available online).
Discussion
We evaluated the effect of NMES and protein supplementation on muscle strength, muscle mass, physical performance, and QoL in HD patients. There were no differences in HGS or LMS among the four treatment groups at the end of the study. GS improved in both the NMES and NMES + P groups. The kidney disease effect, role limitations due to physical or emotional problems, and overall health ratings improved in the NMES + P group, while bodily pain/mental health and physical function were aggravated in the P and C groups, respectively. In subgroup analysis, LMS, LESM, TUG test, and some subscales of QoL (overall health ratings, physical function, and general health) were improved in the high-NMES intensity group.
The typical dietary protein intake recommendation for ESRD patients is 1.2 g/kg/day [21], because hypoalbuminemia is a potent risk factor for mortality in HD patients [22]. However, several studies reported that protein intake was less than 1.0 g/kg/day in HD patients [23,24]. Fouque et al. [18] reported that mildly nourished HD patients (serum albumin <4.0 g/dL and BMI <30 kg/m2) showed an improvement in the nutritional index, provided protein supplements every day. However, protein supplementation failed to improve physical performance or nutritional markers in this study. The amount of protein supplementation (three times a week) in this study may be insufficient to improve the nutritional markers. Although consuming an adequate amount of protein (25 to 30 g of protein) at each meal was recommended [25], an additional 25 g of high-quality protein was provided for each dialysis session in this study due to the inability to strictly control the participants’ daily diet. Otherwise, additional protein supplements may not have beneficial effects in nourished HD patients considering the baseline albumin level. Based on our findings, it is imperative to evaluate the daily protein intake amount and frequency in HD patients and provide personalized protein supplementation accordingly. In addition, there was no significant difference in serum phosphorus levels throughout the study period, irrespective of protein supplementation. Protein supplements can be safely used during dialysis in HD patients without increasing the need for P binders.
KIDIGO (Kidney Disease Improving Global Outcomes) guideline recommends integrating exercise into the daily activities of CKD patients to improve cardiovascular fitness and tolerance [26]. Intradialytic exercise may be a useful option to ensure compliance and reduce uncomfortable dialysis-related symptoms [27]. Intradialytic exercise improved oxygen uptake, muscle strength, physical activity, and psychosocial functioning and also increased blood pressure in patients with intradialytic hypotension [28,29]. However, physicians often fail to encourage HD patients to perform intradialytic exercise due to patients’ poor motivation. NMES can be performed according to the programmed schedule without patient volition. Intradialytic NMES improved muscle strength, muscle atrophy, and functional capacity [12,13]. Therefore, intradialytic NMES can be a good option to enhance exercise compliance in exercise-hesitant HD patients.
There was no significant influence of NMES on muscle strength or body composition in this study. There were potential pitfalls in the design of this study. First, the intensity of NMES may be insufficient to improve muscle strength. Previous studies revealed that high maximum voluntary contraction and significant strength improvement can be attained with an impulse intensity greater than 50 mA [30]. However, the maximum tolerated intensity was less than 50 mA in some participants due to pain perception in our study. Second, the number of participants may be insufficient to make statistical significance among the four groups, although we calculated the sample size according to the previous study [13].
In subgroup analysis, high-NMES intensity improved the LMS, while there was no significant change in the low-NMES intensity group. These findings suggested that enhancement of muscular strength can be achieved by adequate intensity NMES [30]. Furthermore, all female participants were involved in the low-NMES intensity group. Female participants or participants with low LESM may be more sensitive to NMES-induced pain, although baseline LESM was not significantly different between the high- and low-NMES groups. Additionally, consistently higher level of the total CO2 in the high-NMES intensity group may reflect that efficient dialysis and appropriate control of metabolic acidosis delays or alleviates sarcopenia.
Participants in the NMES and NMES + P groups improved functional capacity (GS) in this study which was consistent with the previous study [31]. On the other hand, GS decreased in the P group while GS did not change in the control group. One possible explanation for these findings could be the effects of physical activity. Although there was no statistically significant difference, the level of physical activity in the P group, as measured by IPAQ, was the lowest among the groups throughout the study period (Supplementary Table 2, available online). Previous studies reported that daily physical activity was correlated with GS in HD patients [32,33]. Furthermore, given that the baseline level of physical activity in the NMES + P group was similar to that of the P group, it is plausible that NMES + P could influence physical performance in HD patients. In addition, there was no significant difference in TUG tests among the treatment groups throughout the study period. These findings may originate from the fact that the TUG test is not only affected by muscle strength but also cognitive function or dynamic balance [34]. However, higher NMES ultimately improved both GS and TUG tests.
A meta-analysis showed insufficient evidence of a beneficial effect of NMES on psychological outcomes such as QoL [31]. In this study, the NMES + P group showed a significant improvement in some domains of QoL. In addition, participants in the high-NMES intensity group showed better scores in some subscales of QoL. This may represent higher physical activity and tolerability to stimulation or stress, including NMES, leading to the delivery of high-intensity NMES and, in turn, to the improvement of QoL.
The strength of the present study is that this is the first randomized controlled trial to investigate the effects of intradialytic NMES combined with nutritional supplementation. Nevertheless, there were several limitations. First, the sample size may be insufficient to detect statistical differences in muscle strength between groups. Based on our results, the appropriate sample size for each group would be 74. Furthermore, subgroup analysis according to NMES intensity had statistical limitations because both the NMES and NMES + P groups were merged due to the small number of participants. However, our subgroup analysis revealed clinically meaningful findings by suggesting the potential intensity of intradialytics NMES for achieving clinically meaningful changes for the first time. Second, we cannot rule out the possibility of inter-rater variability in measuring outcomes at multicenters, although we used reliable and valid tests. Third, although randomization was conducted, participants had heterogeneous baseline characteristics, and some of these characteristics were different among them. The mean age and HD vintages were younger and shorter in the NMES+P group, although there was no significant difference. Subtle differences in age and HD vintage can affect study outcomes, if we note that age, sex, and HD vintage affected muscle strength in the previous study [35]. Additionally, there were differences in muscle strength (HGS) and physical performance (TUG) at baseline among the groups, which may have impacted the study outcomes. The small sample size could be the reason for the baseline imbalance [36]. It would have been preferable if the study had been conducted with more homogeneous participants or by stratifying the baseline characteristics. Fourth, we did not assess the habitual diet of participants or their nutritional status by the questionnaire. Consequently, we were unable to ascertain whether the participants’ typical protein intake was insufficient or not. Fifth, several factors, including comorbidities and socioeconomic status, could affect the physical activity in HD patients. However, we did not assess the socioeconomic status and comorbidities.
In conclusion, NMES with or without protein supplementation did not make a significant difference in muscle strength, although NMES, especially high-intensity NMES, showed a benefit in muscle strength, functional capacity, and QoL. We need a prospective study with a larger sample size, longer follow-up duration, and more intensive NMES in a more homogenous group in terms of age and HD vintage to establish the role of NMES and protein supplementation in HD patients.
 PDF Links
 PubReader
 ePub Link
 Full text via DOI
 Download Citation
 Supplement table 1
 Print
Print


")


