


Introduction
The survival of patients undergoing hemodialysis has been improved by advances in hemodialysis therapy, standard expert practice, and affordable national healthcare support [1]. However, hemodialysis patients still experience physical and psychosocial burdens from living with chronic kidney disease [2]. Despite the life-saving benefits of adequate dialysis, the uremic milieu continues to impair bodily functions and structures, leading to exercise intolerance, impaired mobility, and disability among hemodialysis patients [3]. Those burdens predispose hemodialysis patients to adverse behaviors, such as a lack of motivation, sedentary lifestyle, and reduced physical activity, which can translate into frailty, which is known to affect approximately one-half of hemodialysis patients [2‚Äď4]. Frailty is a geriatric syndrome characterized as a multidimensional construct (slow gait speed, muscle weakness, exhaustion, weight loss, and low physical activity) [5].
Intradialytic aerobic exercise for hemodialysis patients improves aerobic capacity, muscular functioning, cardiovascular function, walking capacity, dialysis adequacy, and quality of life (QoL) without any adverse effects in clinical practice, although the structure of the intradialytic exercise varied widely in intensity, frequency, and duration [6‚Äď8]. Therefore, intradialytic aerobic exercise is recommended as a safe, feasible, and appropriate way to enhance physical functioning and QoL [9] that is associated with a low dropout rate, no need to find extra time for exercise, good compliance, and supervision by dialysis experts. However, it does have the drawbacks of adding to the workload of dialysis care providers, and its adoption into routine care has been slow [4,6,7]. The coexistence of frailty and dialysis markedly aggravates functional declines and health in all age groups [2]. Low physical activity contributes directly and indirectly to the development of frailty, and increased physical activity can prevent or reverse frailty, a non-permanent progressive condition that reflects physical performance and QoL [10,11]. However, few controlled trials have rigorously explored the effects of an intradialytic aerobic exercise program on the multidimensional nature of frailty among hemodialysis patients in Korea. Therefore, in this study, we evaluated the effects of an intradialytic aerobic exercise program on frailty, dialysis adequacy, and QoL among Korean hemodialysis patients.
Methods
Participants and setting
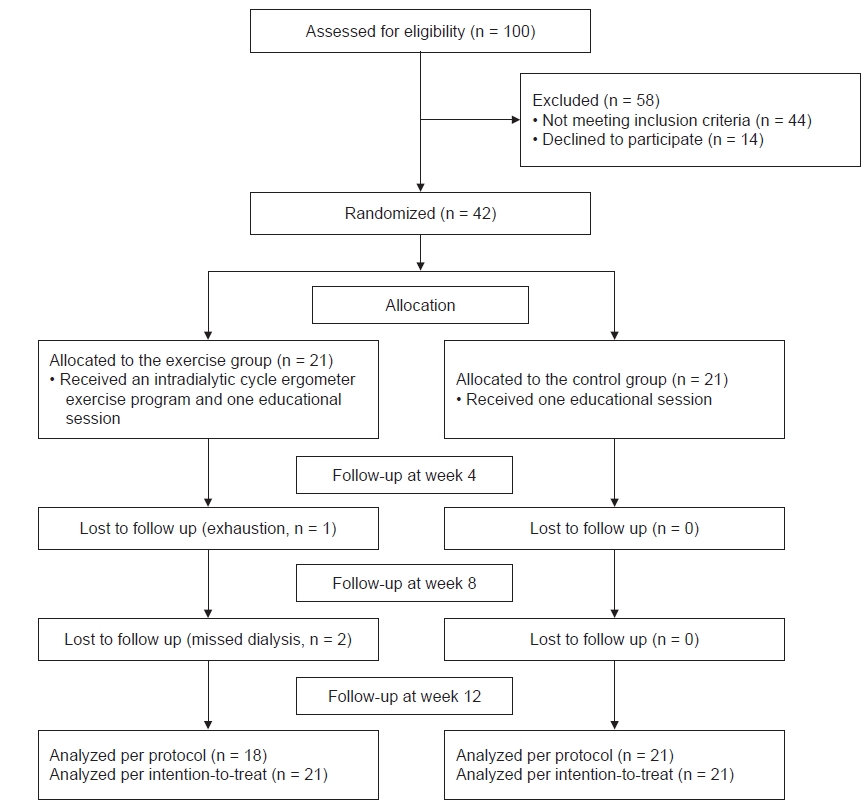
A sample of 42 hemodialysis patients was enrolled at a university hospital-affiliated hemodialysis center. All participants were undergoing regular hemodialysis (3 times/wk for 3‚Äď4 hours per session) with bicarbonate dialysate. The eligibility criteria were the age of ‚Č•18 years, hemodialysis duration of ‚Č•3 months for dialysis adjustment, no perfusion problems through an arteriovenous fistula to maintain adequate blood flow (250 mL/min), no severe hemodialysis-related complications, no history of completing an intradialytic aerobic exercise program (3 times/wk), the ability to use a cycle ergometer while lying in the dialysis bed, and the cognitive ability to read and comprehend the questionnaire. To minimize exercise-related risks, participants were excluded if they had a history of mental illness, any cardiac risk factors (myocardial infarction, angina pain, or uncontrolled hypertension), musculoskeletal risk factors, or a diagnosis of glaucoma during the previous 6 months. The required sample size was 18 patients/group using a repeated-measures within‚Äďbetween interaction model (őĪ = 0.05, 1 ‚Äď ő≤ = 0.8, effect size = 0.35, correlation among repeated measures = 0.5, non-sphericity correction őĶ = 0.5). To account for dropouts, 42 eligible hemodialysis patients from six sequentially numbered coupled dialysis shifts were enrolled and randomly assigned to either the exercise group (n = 21) or the control group (n = 21). Given the design of the exercise program, the participants, researchers, and dialysis care providers were not blinded. The exercise group completed a 12-week program of intradialytic aerobic exercise and a single education session (n = 18), while the control group completed only the education session (n = 21). In the exercise group, one patient dropped out because of exhaustion after week 4, and two patients missed their dialysis appointments after week 8 (Fig. 1).
Ethical considerations
The study protocol was approved by the Institutional Review Board of Bundang CHA Medical Center (No. BD2015-095) and registered at a primary national clinical trial registration site (https://cris.nih.go.kr/cris/index.jsp; registration No., KCT0006774). All participants provided written informed consent before being enrolled. The researchers provided the participants with information regarding the study’s aims and methods, the right to withdraw at any time without reprisal, and their right to privacy.
Intradialytic aerobic exercise program
An intradialytic aerobic exercise program was developed based on the literature and previous studies [4,11‚Äď14]. The content of the exercise program was validated by a group of experts: three nephrologists, two dialysis nursing specialists, and a nursing professor with 10-year experience in nephrology nursing (content validity index = 0.95). The researchers performed an initial feasibility study with three hemodialysis patients to standardize the intradialytic cycle ergometer exercise program and ensure its safety; those patients also provided informed consent. The preliminary findings indicated that the intradialytic exercise program, which consisted of warm-up, cycle ergometer exercise, and cool-down stages, was feasible, safe, and tolerable.
The exercise program began with a 50-minute education session called ‚ÄúExercise guide for patients undergoing hemodialysis,‚ÄĚ with sections titled ‚ÄúExercise and its effects on health,‚ÄĚ ‚ÄúHemodialysis patients can do exercise,‚ÄĚ ‚ÄúTypes of exercise for people undergoing hemodialysis,‚ÄĚ ‚ÄúPrinciples of exercise,‚ÄĚ ‚ÄúMaking exercise part of your life,‚ÄĚ and ‚ÄúBehavioral change‚ÄĚ to boost participant understanding of the intervention [12]. The 12-week aerobic exercise program involved 40 to 70 minutes of ergometer cycling 3 times/wk. Each exercise session comprised a stretching warm-up phase (5 minutes), the main exercise phase (30‚Äď60 minutes), and a cool-down phase (5 minutes). During the warm-up phase, the participants completed 10 cycles of neck/arm/hand stretches, shoulder shrugs and rotations, chest and upper back stretching exercises, single knee pulls, front and back leg stretches, and calf stretches [12,13]. During the main phase, the cycle ergometer exercise was safely performed during the first 1 to 1.5 hours of each dialysis session without cardiac decompensation. The leg ergometer (Mbike; Hong Jin Company, Shanghai, China) was fixed at the foot of the patients‚Äô beds to allow them to pedal while remaining in the supine position during dialysis [4]. Exercise intensity was individually determined based on the rate of perceived exertion from the Borg scale, with a gradual increase from very light/light intensity (score of 7‚Äď9 for 5 minutes) to somewhat hard/hard intensity (score of 12‚Äď15 for 20‚Äď50 minutes) and then a decrease again to very light/light intensity (score of 7‚Äď9 for 5 minutes) [12,13,15]. Intermittent breaks were permitted during the exercise to prevent exhaustion and blood pressure elevation. The cool-down phase involved 10 cycles of arm, shoulder, and leg stretches in a 5-minute period. The control group completed only the education session after the baseline measurements.
All participants’ exercise durations and intensities during each session were supervised by nephrologists, dialysis nurses, and researchers to ensure that all hemodialysis-related and exercise-related parameters remained stable and safe (blood pressure, heart rate, pulse oxygen saturation, and the overexertion symptoms of fainting, chest pain, dyspnea, abdominal pain, nausea, vomiting, muscle pain, joint pain, etc.), based on the protocols of previous studies [4,14].
Measurements of study outcomes
Demographic, dialytic, and clinical assessments
Data regarding the participants’ demographic characteristics were collected using a self-administered questionnaire. Hemodialysis-related and clinical data were collected from the patients’ electronic medical records at the time of enrollment. Each participant’s Charlson’s comorbidity index was calculated (http://touchcalc.com/calculators/cci_js). Body composition parameters (skeletal muscle mass, body fat, and lower leg muscle) were measured with a body composition analyzer (Inbody S10; InBody Corp., Ltd., Seoul, Korea) using the direct segmental measurement bioelectrical impedance method at the time of enrollment and week 12 of the exercise program.
Frailty stage based on the Fried phenotype and the short physical performance battery measurements
Frailty was assessed using Fried‚Äôs frailty phenotype (gait speed, grip strength, vitality, body mass index, and physical activity) [5]. Each factor is scored as 1 (present) or 0 (absent): gait speed of <0.8 m/sec [16], grip strength of <30 kg for men or <20 kg for women [17], vitality score of <55 from the Short Form-36 (SF-36) tool, body mass index of ‚ȧ18.5 kg/m2 [5], and light physical activity for <30 minutes on 5 days of the week or moderate physical activity for <150 min/wk [18]. Patients with a score of ‚Č•3 (i.e., three or more factors present) are considered frail [4]. A stopwatch was used to measure the participants‚Äô 4-m gait speeds at a comfortable pace on a flat and straight surface. Maximum handgrip strength was evaluated in kilograms using a handheld dynamometer (JAMAR Hydraulic Hand Dynamometer; Patterson Medical Ltd., Chicago, IL, USA). All measurements were performed 1 hour after the hemodialysis session at the time of enrollment and at weeks 4, 8, and 12.
The validated short physical performance battery (SPPB) is based on scores of 0 to 4 points in three sections (balance, gait speed, and chair stand test), with a maximum score of 12, a minimum score of 0, and scores classified as normal mobility function (‚Č•10 points) and frail mobility function (<10 points) [18]. Cronbach‚Äôs alpha value for the SPPB in this study was 0.83. The SPPB values were determined 1 hour after the hemodialysis session at the time of enrollment and at weeks 4, 8, and 12.
Dialysis adequacy
Hemodialysis adequacy was evaluated using Kt/V urea at the time of enrollment and at weeks 4, 8, and 12 of the exercise program.
Quality of life-based on the Short Form-36 questionnaire
Quality Metrics (https://www.qualitymetric.com) provided the validated Korean edition (version 2) of the SF-36 questionnaire (license No. QM027199), which contains eight multi-item scales that generate a physical component summary (PCS) score and a mental component summary (MCS) score. Those scores are transformed linearly into a 0 to 100-point scale, with higher scores indicating better health [19]. The Cronbach’s alpha value was 0.82. The QoL values were evaluated at the time of enrollment and at weeks 4, 8, and 12.
Data analysis
All data were analyzed using IBM SPSS version 23 (IBM Corp., Armonk, NY, USA). Data normality was determined using the Shapiro-Wilk test. The baseline characteristics of the two groups were compared using the chi-square test, Fisher exact test, or unpaired t test. Outcome data were analyzed using the chi-square test, analysis of covariance, and repeated-measures analysis of covariance with Bonferroni correction. If the data failed Mauchly’s sphericity assumption, the results are presented using Greenhouse-Geisser correction method. The Mann-Whitney U test was used for the intention-to-treat analysis with multiple imputations (regression method).
Results
Participant homogeneity
The exercise and control group participants were homogenous except for the significantly lower dialysis vintage in the exercise group (p = 0.004) (Table 1).
Changes in the incidence of frailty and body composition parameters
At baseline, the exercise and control groups had similar incidences of frailty. After 12 weeks, the exercise group had less frailty as reflected by Fried’s frailty score (p < 0.001), gait speed (p < 0.001), physical activity (p < 0.001), exhaustion (p = 0.002), and SPPB score (p = 0.002) (Table 2). The body composition parameters showed no significant improvements (Table 2).
Within- and between-group interaction effects on frailty, dialysis adequacy, and quality of life
At baseline, the exercise and control groups had similar frailty scores, SPPB scores, and QoL scores. There was a significant interaction in the overall frailty score (p < 0.001), gait speed (p < 0.001), and SPPB score (p < 0.001). The exercise group had a significant interaction in the overall MCS score (p = 0.03) (Table 3).
Differences in frailty, dialysis adequacy, and quality of life according to the intention-to-treat and per-protocol analyses
The intention-to-treat and per-protocol analyses revealed that the exercise group exhibited significant improvements in the overall frailty score (p < 0.001, p < 0.001), gait speed (p < 0.001, p < 0.001), grip strength (p < 0.001, p < 0.001), exhaustion (p = 0.02, p = 0.02), SPPB score (p = 0.04, p = 0.01), dialysis adequacy (p = 0.01, p = 0.01), and PCS score (p = 0.005, p = 0.003) (Table 4).
Discussion
This study determined whether an intradialytic aerobic exercise program could improve frailty, dialysis adequacy, and QoL for hemodialysis patients.
Education and counseling are required to increase physical activity and drive behavioral change in hemodialysis patients [4]. However, a single 50-minute education session about physical activity did not reduce the incidence of frailty in the control group. In contrast, the exercise group had fewer cases of frailty after the program, as shown by Fried’s frailty score (0% vs. 66.7%), as well as its parameters of gait speed (5.6% vs. 66.7%) and exhaustion (38.9% vs. 90.5%) and the SPPB score (0.0% vs. 41.9%). Although this intradialytic aerobic exercise program did not entirely reverse the frailty phenotype, physical exercise could be essential for reducing frailty in hemodialysis patients.
Estimates of body composition can be more informative than the body mass index in hemodialysis patients, especially when considering physical performance rather than nutritional status [20]. We found no significant changes in skeletal muscle, leg muscle, or fat mass values in the exercise or control group. This result is consistent with that of another study, wherein appendicular muscle mass and other body composition parameters did not improve after a 4-month program of cycle ergometer exercise [21]. Additional research is needed to determine whether prolonged exercise or aerobic exercise with various sessions, durations, and intensities might be useful for increasing body muscle in hemodialysis patients.
The only noticeable baseline difference between the exercise and control groups was their baseline dialysis vintage, which influences functioning, frailty, and QoL [3,11]. Because we did not achieve selection balance, dialysis vintage should be considered a confounding variable to determine the within‚Äďbetween interaction effects. The exercise group experienced significant improvements in the average frailty score (f = 0.78), average gait speed (f = 0.93), and SPPB score (f = 0.45) during the 12-week program. These results agree with those of a previous report that a 6-week predialysis exercise training program (20 min/session) improved normal gait speed, fast gait speed, and sit-to-stand performance [22]. Another intradialytic program combining cardiovascular exercise (supine cycle ergometer) and resistance exercise also improved physical capacity in terms of the timed up-and-go, sit-to-stand, and gait speed outcomes [23]. A 4-month intradialytic cycle ergometer exercise program facilitated an increase in walking distance [21]. Gait speed is a sensitive health indicator that has been called the 6th vital sign among hemodialysis patients [16,24]. In the present study, both the exercise and control groups had limited gait speeds at baseline [3,24]. A change of 0.1 m/sec in gait speed reflects a meaningful change [25], and our exercise group exhibited an increase from 0.89 m/sec to 1.21 m/sec, which is sufficient for independent daily living, community ambulation, and crossing the street [3,16,26]. However, although handgrip strength had a significant within‚Äďbetween interaction, there was no significant difference in grip strength at any follow-up time after Bonferroni correction method was applied. In contrast, the previous 4-month intradialytic cycle ergometer program showed an improvement in handgrip strength [21], which could suggest that a longer period of intradialytic aerobic exercise (>12 weeks) is needed to improve handgrip strength and reach a non-frail state. The exercise group in the present study also experienced improvements in the average MCS score during the first 8 weeks (f = 0.29), although the small effect size might indicate a risk of bias. Therefore, large randomized controlled trials are needed to identify the optimal duration and timing of intradialytic cycle ergometer exercise and evaluate the effect on handgrip strength and mental QoL.
Data were missing for 3.6% of all variables in three patients (7.1%) in the exercise group. The intention-to-treat and per-protocol analyses revealed that the exercise group exhibited significant increments in Kt/V urea (0.12), grip strength (2.03 kg), exhaustion score (5.36), and PCS score (6.29), as well as improvements in Fried‚Äôs frailty score (‚Äď1.28), gait speed (0.31 m/sec), and SPPB score (1.17). During dialysis, exercise increases blood uremic solute removal by increasing blood flood to low perfusion tissue beds [8]. In the present study, the exercise group had a significant increase in Kt/V urea (+7.37%), and the control group had a decrease in Kt/V urea (‚Äď1.32%). This result is consistent with the previous finding that among hemodialysis patients, a 15-minute intradialytic aerobic exercise program safely and effectively improved Kt/V urea by 38% after 8 weeks [14]. Moreover, different types of intradialytic training might improve dialysis adequacy (based on Kt/V urea), cardiorespiratory fitness, and prognosis [6,22,23]. Profound and relentless exhaustion in hemodialysis patients leads to weakness, decreased vitality, and reduced ability to perform daily activities [27]. Furthermore, a 10-point increase in the vital score is associated with a 10% increase in mean survival time [28]. Our exercise group exhibited an increase of 5.36 in vitality score, which is consistent with the finding of a previous report [21]. Therefore, it could be prudent to incorporate exercise programs into the routine care of frail patients who are undergoing hemodialysis.
To determine the participants‚Äô ability to engage in exercise, our nephrologists and dialysis nurses evaluated symptoms such as systolic blood pressure of ‚Č•200 mmHg, diastolic blood pressure of ‚Č•100 mmHg, and Borg score of ‚Č•15, including subjective symptoms such as dizziness, chest tightness, dyspnea, nausea, vomiting, muscle pain, and joint pain [4]. Participants were encouraged to report any issues that they experienced to help identify the support required during or after the intradialytic exercise. Because we observed several episodes of elevated systolic blood pressure during the intradialytic exercise, careful screening and monitoring by nephrologists and dialysis nurses were essential to maintain the participants‚Äô safety, which means that ongoing exercise programs would add to healthcare providers‚Äô work burden. Two participants missed two sessions of the exercise program due to elevation of their systolic blood pressure of ‚Č•190 mmHg during the stretching warm-up phase. Additionally, two participants had an episode of systolic blood pressure elevation to 170 mmHg (from 140 mmHg) during the main exercise phase. After 10 minutes of rest, the high blood pressure had normalized, and the participants safely completed their exercise sessions. In addition, one 48-year-old female participant with intradialytic hypotension experienced improvement in her dialysis-induced hypotension.
The present study has several limitations that warrant consideration. First, we included only patients undergoing treatment at a single hemodialysis center, and the results might not be generalizable to other centers and patient populations. Second, the small effect size for the MCS score improvement (f < 0.35) could indicate a risk of bias. Third, the small sample size precluded the use of factorial statistics for exercise and frailty factors. Fourth, the different statistical measures produced variable efficacies in terms of Kt/V. Because the effects of intradialytic aerobic exercise on Kt/V have been controversial [6], this discrepancy should be checked through further research by modifying the duration, time, and intensity of the intradialytic aerobic exercise program in a larger, multicenter population.
Although the 12-week intradialytic exercise program did not entirely reverse the frailty phenotype, and different statistical measures produced various results, our findings imply that an intradialytic cycle ergometer exercise program could reduce frailty and improve dialysis adequacy and QoL. Intradialytic exercise programs have not been incorporated into routine care due to the practical burden on dialysis health care professionals. A government health policy should be established to correct the lack of trained dialysis health care professionals available to supervise exercise programs and the lack of financial support for ongoing exercise programs.
 PDF Links
 PubReader
 ePub Link
 Full text via DOI
 Download Citation
 Print
Print


")


