


Insulin resistance is associated with new-onset cardiovascular events in nondiabetic patients undergoing peritoneal dialysis
- Chang-Yun Yoon1, Mi Jung Lee1, Youn Kyung Kee1, Eunyoung Lee1, Young Su Joo1, In Mee Han1, Seung Gyu Han1, Hyung Jung Oh1, Jung Tak Park1, Seung Hyeok Han1, Shin-Wook Kang1,2, Tae-Hyun Yoo1,⁎
- Received September 1, 2014 Revised September 18, 2014 Accepted October 3, 2014
- ABSTRACT
-
- Background
- Chronic exposure to high glucose-containing peritoneal dialysis solution and consequent abdominal obesity are potential sources of insulin resistance in patients requiring prevalent peritoneal dialysis. The aim of this study was to elucidate the prognostic values of insulin resistance on new-onset cardiovascular events in nondiabetic patients undergoing prevalent peritoneal dialysis.
- Methods
- A total of 201 nondiabetic patients undergoing prevalent peritoneal dialysis were recruited. Insulin resistance was assessed by homeostatic model assessment of insulin resistance (HOMA-IR). The primary outcome was new-onset cardiovascular events during the follow-up period. Cox proportional hazard analysis was performed to ascertain the independent prognostic value of HOMA-IR for the primary outcome.
- Results
- The mean age was 53.1 years and male was 49.3% (n=99). The mean HOMA-IR was 2.6±2.1. In multivariate linear regression, body mass index (β=0.169, P=0.011), triglyceride level (β=0.331, P<0.001), and previous cardiovascular diseases (β=0.137, P=0.029) were still significantly associated with HOMA-IR. During a mean follow-up duration of 36.8±16.2 months, the primary outcome was observed in 36 patients (17.9%). When patients were divided into tertiles according to HOMA-IR, the highest tertile group showed a significantly higher incidence rate for new-onset cardiovascular events compared to the lower two tertile groups (P=0.029). Furthermore, multivariate Cox analysis revealed that HOMA-IR was an independent predictor of the primary outcome (hazard ratio=1.18, 95% confidence interval=1.03–1.35, P=0.014).
- Conclusion
- Insulin resistance measured by HOMA-IR was an independent risk factor for new-onset cardiovascular events in nondiabetic patients undergoing prevalent peritoneal dialysis.
Keywords
Cardiovascular event, Insulin resistance, Peritoneal dialysis
- Introduction
- Introduction
Cardiovascular disease (CVD) is the most important and leading cause of death in those with end-stage renal disease (ESRD) [1], [2]. In the general population, insulin resistance is related to several risk factors for CVD, including hypertension, dyslipidemia, diabetes, and central obesity [3]. Furthermore, hyperinsulinemia itself and related-insulin resistance are directly associated with development of CVD [4], [5].In patients with ESRD, many factors including uremia, chronic inflammation, and abnormal adipokines are involved in the development of insulin resistance. Previous studies revealed that insulin resistance was prevalent and was an independent predictor of cardiovascular mortality in nondiabetic patients with ESRD and on hemodialysis (HD) [6]. In particular, in patients on peritoneal dialysis (PD), chronic exposure to high glucose-containing PD solution causes several hazard events including hypertriglyceridemia, poor glycemic control, new-onset diabetes, and central obesity [7]. It is likely that these abnormalities aggravate insulin resistance in patients on PD [7]. Furthermore, a recent study also showed a relationship between insulin resistance, as assessed by homeostatic model assessment of insulin resistance (HOMA-IR), and CVD in patients on PD [8], [9], [10]. However, due to the relatively small sample size and the very low incidence rate of CVD seen in a previous study, earlier results would benefit from validation of the predictive role of insulin resistance in a larger population. Therefore, we investigated whether insulin resistance determined by HOMA-IR was an independent predictor of cardiovascular outcome in nondiabetic patients with ESRD and on PD.
- Methods
- Methods
- Ethics statement
- Ethics statement
The study was carried out in accordance with the Declaration of Helsinki and approved by the Institutional Review Board of Yonsei University Health System (YUHS) Clinical Trial Center, Seoul, Korea. We obtained informed written consent from all participants involved in the current study.- Patients
- Patients
All consecutive nondiabetic patients with ESRD older than 18 years of age who underwent PD for>3 months at YUHS were initially screened for enrollment between January 2009 and December 2009 in this prospective observational study. Patients were considered eligible if they had no history of malignancy or chronic inflammatory disease such as systemic lupus erythematosus or rheumatoid arthritis, and had no overt infection during the 3 months prior to study entry. We also excluded patients with a history of kidney transplantation, a history of HD for>3 months prior to PD, or a history of CVD within 3 months prior to study entry (Fig. 1).- Clinical and biochemical data collection
- Clinical and biochemical data collection
Demographic and clinical data recorded at study entry included: age, sex, PD duration, primary renal disease, smoking status, and medication use. Body mass index (BMI) and biochemical data were measured at study enrollment. Patients were weighed in light clothing, and height was measured with shoes off. BMI was calculated as weight/height (kg/m2). Diabetes mellitus was defined as previously described [11]. Blood was taken after a 12-hour overnight fast, and the following laboratory data were measured: hemoglobin, glucose, blood urea nitrogen, creatinine, albumin, iron profile, triglyceride (TG), total cholesterol, low-density lipoprotein cholesterol, high-density lipoprotein cholesterol (HDL-C), calcium, phosphorus, and intact parathyroid hormone (iPTH) concentrations. Insulin resistance was assessed using the HOMA-IR equation as follows:In addition, high-sensitivity C-reactive protein (hs-CRP) concentrations were determined by a latex-enhanced immunonephelometric method using a BNII analyzer (Dade Behring, Newark, DE, USA). Kt/V urea was determined from the total loss of urea nitrogen in spent dialysate using PD Adequest 2.0 for Windows software (Baxter Healthcare, Deerfield, IL, USA).- Follow-up and end points
- Follow-up and end points
Patients were followed up at 3-month intervals through January 1, 2014. All deaths and hospitalizations were noted in a serious adverse event database. All events were retrieved from the database and carefully reviewed to determine incident CVD. Primary outcomes were major cardiovascular events, which were defined as death or hospitalization from an acute coronary syndrome and stable angina requiring coronary revascularization or coronary artery bypass surgery. Cerebrovascular events were defined as transient ischemic attack, stroke, or carotid endarterectomy and peripheral vascular disease defined as ischemic limb loss and/or ulceration or peripheral revascularization procedure that also included major cardiovascular events. When a patient died within 60 days after transfer to HD, the death was regarded as a mortality event. Loss to follow-up, kidney transplantation, and transfer to HD were censored in the final analysis.- Statistical analysis
- Statistical analysis
Continuous variables were expressed as mean±standard deviation, or median (interquartile range), whereas categorical variables were expressed as a number (percentage). Normality of distribution was ascertained by the Kolmogorov-Smirnov test. Patients were divided into three groups according to the tertile value of their HOMA-IR. To compare the baseline characteristics, analysis of variance or Kruskal-Wallis test and Chi-square tests were used for continuous variables and categorical variables, respectively. Univariate and multivariate linear regression analyses were performed to determine significant factors associated with HOMA-IR. Comparisons for major cardiovascular events were performed by the Kaplan-Meier analysis and a log-rank test. The independent predictive value of HOMA-IR for primary outcome was confirmed by Cox proportional hazards regression models, which included significant variables in univariate analysis. Statistical analysis was performed with SPSS for Windows version 18.0 (SPSS Inc., Chicago, IL, USA). A P value<0.05 was considered significant.
- Results
- Results
- Demographic characteristics of patients
- Demographic characteristics of patients
Baseline demographic and laboratory characteristics of patients are detailed in Table 1. The mean age was 53.1±8.3 years and 99 patients (49.3%) were male. The mean value of HOMA-IR was 2.6±2.1. Patients were divided into three groups according to the tertile values of HOMA-IR. The three groups showed no significant differences in age, sex, previous history of CVD, proportion of smokers, dialysis adequacy, icodextrin user, total cholesterol, low-density lipoprotein cholesterol, log hs-CRP, or medication including renin-angiotensin-aldosterone system blockers or statin. However, BMI, impaired fasting glucose, and TG were significantly higher in the group with high HOMA-IR compared to the middle and low HOMA-IR groups (P=0.002, P=0.001, and P<0.001, respectively). Meanwhile, HDL-C was significantly lower in the high HOMA-IR group (P=0.041).- Association between HOMA-IR and clinical and biochemical parameters
- Association between HOMA-IR and clinical and biochemical parameters
In univariate analysis, HOMA-IR was positively associated with BMI, previous history of CVD, TG, and serum calcium level, but it was negatively associated with HDL-C (Table 2). Multivariate linear regression analysis revealed that BMI, previous CVD, and TG had independent associations with HOMA-IR in patients on PD (Table 3).- HOMA-IR as an independent predictor of major cardiovascular events
- HOMA-IR as an independent predictor of major cardiovascular events
During a mean follow-up duration of 36.8±16.2 months, the primary outcome was observed in 36 patients (17.9%), and 12 patients (6.0%) died from a new-onset cardiovascular event. The patients with cardiovascular events were significantly older and had a much more prevalent history of previous CVD. The log hs-CRP and HOMA-IR were significantly higher, whereas % lean body mass (%LBM) was significantly lower in patients with new-onset cardiovascular events (Table 4). A Kaplan-Meier plot showed that CVD event-free survival rates were significantly lower in the highest HOMA-IR tertile group than in the lower two HOMA-IR groups (log-rank test; P=0.029; Fig. 2). However, there was no difference in CVD event-free survival according to new onset diabetes (data not shown). In univariate Cox proportional hazard analysis, age, previous history of CVD, and log hs-CRP as well as HOMA-IR levels were significant risk factors for a primary outcome (Table 5). In multivariate Cox analysis, HOMA-IR was a significant independent predictor of new-onset major cardiovascular events (hazard ratio: 1.18, 95% confidence interval: 1.03–1.35; P=0.014) after adjustment for age, sex, %LBM, previous CVD, and log hs-CRP (Table 6).
- Discussion
- Discussion
In this observational study, we demonstrated that HOMA-IR was closely correlated with the parameters of metabolic syndrome such as BMI, impaired fasting glucose, and serum TG level. In addition, increased HOMA-IR was significantly associated with new-onset cardiovascular events as well as history of previous CVD. The current study showed that insulin resistance, as assessed by HOMA-IR, might be a risk factor for CVD in nondiabetic patients with prevalent PD.Insulin resistance is a physiological circumstance in which cells are not able to react with normal responses to the hormonal effects of insulin. In the general population, several factors including obesity, increased TG level, sedentary lifestyle, and high-fat diet can induce insulin resistance [12], [13]. Adipose tissue in obese patients secreted proinflammatory cytokines and reduced insulin sensitivity [14]. In addition, hyperleptinemia and decreased adiponectin levels induced impairment of insulin signaling [15]. A previous study reported that high leptin and low adiponectin was prevalent and significantly associated with clinical outcomes in patients with prevalent PD [16]. Decreased renal function is also associated with insulin resistance in nondialysis chronic kidney disease and ESRD patients. Kobayashi et al [17] revealed that insulin resistance was linearly correlated with the decline of renal function in patients with chronic kidney disease. In addition to classic risk factors, chronic exposure to high-glucose-containing dialysate and its degradation products in patients with long-standing PD might exacerbate a series of metabolic influences such as dyslipidemia, hyperglycemia, visceral obesity, and subsequently cause increases in insulin resistance [7], [8], [18]. Furthermore, impaired fasting glucose is associated with mortality in nondiabetic patients on PD [19]. The current study also showed that HOMA-IR was significantly associated with components of metabolic syndrome, such as BMI, impaired fasting glucose, and serum TG level. Moreover, most of the study patients were anuric and were patients on prevalent PD of relatively long duration. Chronic exposure of high-glucose solution and the absence of residual renal might have aggravated insulin resistance in these study patients. Indeed, study patients have been maintained on PD with relatively long-standing duration, and we did not collect the exact data on high glucose containing dialysate including 2.5% or 4.25% solution. However, there were no significant differences in HOMA-IR according to use of non-glucose-based PD solution.The connection between CVD and insulin resistance is well known, as they have been shown to be closely interrelated [20], [21], [22]. Insulin resistance-related systemic inflammation and oxidative stress also frequently accompanies cardiovascular risk factors [23], [24]. The combined effect of insulin resistance and coexisting metabolic abnormality enhanced risks of cardiovascular events. In the current study, we confirmed that insulin resistance was principally associated with BMI and serum TG level as well as previous CVD. These markers are basically associated with metabolic disarrangement, or so-called “metabolic syndrome”, and thus, insulin resistance is considered to be part of a “metabolic syndrome”. Especially in patients with ESRD, metabolic disarrangement is more prominent and causes more severe adverse events such as cardiovascular disorder [25]. Our study showed that HOMA-IR remained a significant variable even after adjustment for confounding variables, including hs-CRP. Based on this analysis, insulin resistance is associated with CVD, independent of systemic inflammation in patients on PD.Chronic inflammation and protein-energy wasting play an important role in the development of CVD in patients with ESRD. Inflammation and malnutrition complex are closely associated with atherosclerosis and poor clinical outcomes in dialysis patients [26]. The paradoxical inverse association between mortality and nutritional status in dialysis patients is referred to as “reverse epidemiology” [27]. However, recent studies demonstrated that not only malnutrition but also obesity is associated with increased mortality in dialysis patients undergoing PD [28]. Another study also reported that obesity including visceral adiposity is associated with insulin resistance and enhanced atherosclerosis in this population [29]. Our study showed that insulin resistance is closely associated with BMI and new-onset cardiovascular events. Taken together with previous and current results, metabolic derangements, such as insulin resistance in patients undergoing PD, are closely affected atherosclerotic complications.Malnutrition-inflammation complex syndrome is a nontraditional risk factor for CVD in ESRD. Serum albumin and %LMB is a classic marker for malnutrition and is a strong risk factor of mortality in dialysis patients [30], [31], [32]. We evaluated the clinical significance of serum albumin and %LBM for new-onset cardiovascular events. The significance of these parameters was marginally valuable, although %LBM was a significant risk factor for CVD on univariate analysis. We had already excluded patients with chronic inflammatory status and active infection episodes and enrolled only relatively stable patients undergoing PD. Moreover, serum albumin is associated not only with inflammation but also fluid status and peritoneal transport status [33]. Based on the results of the current study, insulin resistance, rather than malnutrition, was the primary contributor to the higher incidence of cardiovascular events in relatively well-nourished patients on PD.There are several limitations to this study. First, the study patients were all Korean and undergoing prevalent PD at a single center, and the duration of PD in the study population was relatively diverse. Thus, selection bias is possible and there could be some limitation in the euglycemic clamp for practical reasons. Even though the accuracy of the euglycemic clamp is superior to other methods, its invasiveness may cause it to be difficult to use for a large study population. The HOMA-IR method is easy to use and results from HOMA-IR are usually consistent with results acquired by the euglycemic clamp technique [34], [35]. Finally, the absence of sequential follow-up measurements of HOMA-IR was another limitation in this study. A patient`s insulin resistance might have changed during the follow-up period and time-averaged levels are much more reliable. Although we did not check HOMA-IR serially, however, we did enroll only patients on PD who were relatively stable. In the future, measurement of serial changes in insulin resistance would be helpful to improve the quality of significance in predicting prognosis.
- Conflict of interest
- Conflict of interest
The authors declare no conflict of interest.
- References
- References
- 1. Foley RN, Parfrey PS, Sarnak MJ. Clinical epidemiology of cardiovascular disease in chronic renal disease. Am J Kidney Dis 32:1998;S112–S119. PMID: 9820470.
[Article] [PubMed]2. Parfrey PS, Foley RN. The clinical epidemiology of cardiac disease in chronic renal failure. J Am Soc Nephrol 10:1999;1606–1615. PMID: 10405218.
[Article] [PubMed]3. DeFronzo RA, Ferrannini E. Insulin resistance. A multifaceted syndrome responsible for NIDDM, obesity, hypertension, dyslipidemia, and atherosclerotic cardiovascular disease. Diabetes Care 14:1991;173–194. PMID: 2044434.
[Article] [PubMed]4. Despres JP, Lamarche B, Mauriege P, Cantin B, Dagenais GR, Moorjani S, Lupien PJ. Hyperinsulinemia as an independent risk factor for ischemic heart disease. N Engl J Med 334:1996;952–957. PMID: 8596596.
[Article] [PubMed]5. Pyorala M, Miettinen H, Laakso M, Pyorala K. Hyperinsulinemia predicts coronary heart disease risk in healthy middle-aged men: the 22-year follow-up results of the Helsinki Policemen Study. Circulation 98:1998;398–404. PMID: 9714089.
[Article] [PubMed]6. Shinohara K, Shoji T, Emoto M, Tahara H, Koyama H, Ishimura E, Miki T, Tabata T, Nishizawa Y. Insulin resistance as an independent predictor of cardiovascular mortality in patients with end-stage renal disease. J Am Soc Nephrol 13:2002;1894–1900. PMID: 12089386.
[Article] [PubMed]7. Fortes PC, de Moraes TP, Mendes JG, Stinghen AE, Ribeiro SC, Pecoits-Filho R. Insulin resistance and glucose homeostasis in peritoneal dialysis. Perit Dial Int 29(Suppl 2):2009;S145–S148. PMID: 19270204.
[Article] [PubMed]8. Sevinc Ok E, Asci G, Kircelli F, Duman S, Dheir H, Sezis Demirci M, Ozkahya M, Toz H, Ok E. Relationship between glucose exposure via peritoneal dialysis solutions and coronary artery calcification in non-diabetic peritoneal dialysis patients. Int Urol Nephrol 44:2012;1847–1853. PMID: 22350838.
[Article] [PubMed]9. Tatar E, Demirci MS, Kircelli F, Gungor O, Turan MN, Sevinc Ok E, Asci G, Ozkahya M, Ok E. Association of insulin resistance with arterial stiffness in nondiabetic peritoneal dialysis patients. Int Urol Nephrol 44:2012;255–262. PMID: 21643643.
[Article] [PubMed]10. Li Y, Zhang L, Gu Y, Hao C, Zhu T. Insulin resistance as a predictor of cardiovascular disease in patients on peritoneal dialysis. Perit Dial Int 33:2013;411–418. PMID: 23455976.
[Article] [PubMed] [PMC]11. Diabetes Care.12. Kraegen EW, Clark PW, Jenkins AB, Daley EA, Chisholm DJ, Storlien LH. Development of muscle insulin resistance after liver insulin resistance in high-fat-fed rats. Diabetes 40:1991;1397–1403. PMID: 1936601.
[Article] [PubMed]13. Lovejoy J, DiGirolamo M. Habitual dietary intake and insulin sensitivity in lean and obese adults. Am J Clin Nutr 55:1992;1174–1179. PMID: 1317665.
[Article] [PubMed]14. Weisberg SP, McCann D, Desai M, Rosenbaum M, Leibel RL, Ferrante AW Jr. Obesity is associated with macrophage accumulation in adipose tissue. J Clin Invest 112:2003;1796–1808. PMID: 14679176.
[Article] [PubMed] [PMC]15. Stenvinkel P, Heimburger O, Lonnqvist F. Serum leptin concentrations correlate to plasma insulin concentrations independent of body fat content in chronic renal failure. Nephrol Dial Transplant 12:1997;1321–1325. PMID: 9249764.
[Article] [PubMed]16. Park JT, Yoo TH, Kim JK, Oh HJ, Kim SJ, Yoo DE, Lee MJ, Shin DH, Han SH, Han DS, Kang SW. Leptin/adiponectin ratio is an independent predictor of mortality in nondiabetic peritoneal dialysis patients. Perit Dial Int 33:2013;67–74. PMID: 22855891.
[Article] [PubMed] [PMC]17. Kobayashi S, Maesato K, Moriya H, Ohtake T, Ikeda T. Insulin resistance in patients with chronic kidney disease. Am J Kidney Dis 45:2005;275–280. PMID: 15685504.
[Article] [PubMed]18. de Moraes TP, Pecoits-Filho R. Metabolic impact of peritoneal dialysis. Contrib Nephrol 163:2009;117–123. PMID: 19494604.
[Article] [PubMed]19. Chen KH, Lin JL, Hung CC, Lin-Tan DT, Weng SM, Yen TH, Hsu CW, Yang CW. Impaired fasting glucose association with mortality in nondiabetic patients on maintenance peritoneal dialysis. Am J Med Sci 341:2011;312–317. PMID: 21289510.
[Article] [PubMed]20. Welborn TA, Wearne K. Coronary heart disease incidence and cardiovascular mortality in Busselton with reference to glucose and insulin concentrations. Diabetes Care 2:1979;154–160. PMID: 520119.
[Article] [PubMed]21. Eschwege E, Richard JL, Thibult N, Ducimetiere P, Warnet JM, Claude JR, Rosselin GE. Coronary heart disease mortality in relation with diabetes, blood glucose and plasma insulin levels. The Paris Prospective Study, ten years later. Horm Metab Res Suppl 15:1985;41–46. PMID: 3908280.
[PubMed]22. Ginsberg HN. Insulin resistance and cardiovascular disease. J Clin Invest 106:2000;453–458. PMID: 10953019.
[Article] [PubMed] [PMC]23. Bornfeldt KE, Tabas I. Insulin resistance, hyperglycemia, and atherosclerosis. Cell Metab 14:2011;575–585. PMID: 22055501.
[Article] [PubMed] [PMC]24. Bansilal S, Farkouh ME, Fuster V. Role of insulin resistance and hyperglycemia in the development of atherosclerosis. Am J Cardiol 99:2007;6B–14B.
[Article] [PubMed]25. Zoccali C, Mallamaci F, Tripepi G, Benedetto FA, Cutrupi S, Parlongo S, Malatino LS, Bonanno G, Seminara G, Rapisarda F, Fatuzzo P, Buemi M, Nicocia G, Tanaka S, Ouchi N, Kihara S, Funahashi T, Matsuzawa Y. Adiponectin, metabolic risk factors, and cardiovascular events among patients with end-stage renal disease. J Am Soc Nephrol 13:2002;134–141. PMID: 11752030.
[Article] [PubMed]26. Pecoits-Filho R, Lindholm B, Stenvinkel P. The malnutrition, inflammation, and atherosclerosis (MIA) syndrome -- the heart of the matter. Nephrol Dial Transplant 17(Suppl 11):2002;28–31. PMID: 12386254.
[Article]27. Kalantar-Zadeh K, Kopple JD, Kilpatrick RD, McAllister CJ, Shinaberger CS, Gjertson DW, Greenland S. Association of morbid obesity and weight change over time with cardiovascular survival in hemodialysis population. Am J Kidney Dis 46:2005;489–500. PMID: 16129211.
[Article] [PubMed]28. McDonald SP, Collins JF, Johnson DW. Obesity is associated with worse peritoneal dialysis outcomes in the Australia and New Zealand patient populations. J Am Soc Nephrol 14:2003;2894–2901. PMID: 14569099.
[Article] [PubMed]29. Lee MJ, Shin DH, Kim SJ, Oh HJ, Yoo DE, Kim JK, Park JT, Han SH, Kang SW, Choi KH, Yoo TH. Visceral fat thickness is associated with carotid atherosclerosis in peritoneal dialysis patients. Obesity (Silver Spring) 20:2012;1301–1307. PMID: 21818151.
[Article] [PubMed]30. Friedman AN, Fadem SZ. Reassessment of albumin as a nutritional marker in kidney disease. J Am Soc Nephrol 21:2010;223–230. PMID: 20075063.
[Article] [PubMed]31. Iseki K, Kawazoe N, Fukiyama K. Serum albumin is a strong predictor of death in chronic dialysis patients. Kidney Int 44:1993;115–119. PMID: 8355451.
[Article] [PubMed]32. Dong J, Li YJ, Lu XH, Gan HP, Zuo L, Wang HY. Correlations of lean body mass with nutritional indicators and mortality in patients on peritoneal dialysis. Kidney Int 73:2008;334–340. PMID: 18033246.
[Article] [PubMed]33. John B, Tan BK, Dainty S, Spanel P, Smith D, Davies SJ. Plasma volume, albumin, and fluid status in peritoneal dialysis patients. Clin J Am Soc Nephrol 5:2010;1463–1470. PMID: 20538836.
[Article] [PubMed] [PMC]
Figure 1

Figure 2
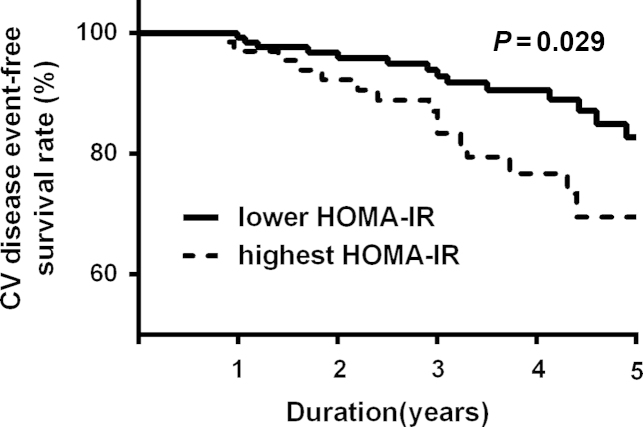
Table 1
| Variables | All (n=201) | 1st tertile (n=67) | 2nd tertile (n=67) | 3rd tertile (n=67) | P |
|---|---|---|---|---|---|
| Age (y) | 53.1±8.3 | 52.2±8.8 | 52.3±8.0 | 54.6±7.9 | 0.16 |
| Male | 99 (49.3) | 34 (50.8) | 35 (52.2) | 30 (44.8) | 0.67 |
| BMI (kg/m2) | 23.4±3.0 | 22.6±2.3 | 23.3±3.0 | 24.4±3.5 | 0.002 |
| % Lean body mass | 72.5±10.3 | 73.1±10.7 | 72.6±10.3 | 71.7±9.9 | 0.74 |
| PD duration (mo) | 83±54.3 | 96.3±54.5 | 71.2±48.3 | 81.5±57.6 | 0.027 |
| Kt/V | 2.0±0.4 | 2.0±0.5 | 2.0±0.4 | 2.0±0.3 | 0.93 |
| Icodextrin use | 90 (44.8) | 31 (46.3) | 30 (44.8) | 29 (43.3) | 0.94 |
| Previous CVD* | 34 (16.9) | 8 (4.0) | 12 (6.0) | 14 (7.0) | 0.37 |
| IFG | 32 (15.9) | 4 (6.0) | 9 (13.4) | 19 (28.4) | 0.001 |
| New-onset DM | 12 (6.0) | 3 (1.5) | 3 (1.5) | 6 (3.0) | 0.28 |
| Smoker | 49 (24.4) | 16 (8.0) | 20 (10.0) | 13 (6.5) | 0.37 |
| Hemoglobin (g/dL) | 10.5±1.5 | 10.3±1.6 | 10.8±1.6 | 10.6±1.3 | 0.12 |
| BUN (mg/dL) | 60.7±19.0 | 61.6±19.0 | 62.4±19.4 | 58.2±18.5 | 0.39 |
| Creatinine (mg/dL) | 11.9±3.4 | 12.4±3.7 | 11.6±3.4 | 11.7±3.2 | 0.35 |
| Albumin (g/dL) | 3.6±0.4 | 3.5±0.4 | 3.7±0.4 | 3.7±0.5 | 0.017 |
| Total cholesterol (mg/dL) | 182.1±36.1 | 176.8±36.9 | 183.8±37.2 | 185.8±34.1 | 0.32 |
| Triglyceride (mg/dL) | 140.6±106.8 | 100.3±52.1 | 137.2±80.1 | 184.2±147.9 | < 0.001 |
| HDL-C (mg/dL) | 46.8±13.5 | 47.9±13.0 | 49.0±14.1 | 43.5±12.9 | 0.041 |
| LDL-C (mg/dL) | 108.5±31.9 | 103.8±29.2 | 111.5±34.5 | 110.1±31.7 | 0.34 |
| Calcium (mg/dL) | 9.0±0.8 | 8.9±0.7 | 9.0±0.7 | 9.1±1.0 | 0.41 |
| Phosphate (mg/dL) | 4.8±1.1 | 4.8±1.2 | 4.8±1.2 | 5.0±1.0 | 0.85 |
| iPTH (pg/mL) (IQR) | 262.5 (71.5–322.8) | 254 (80.6–343.0) | 281.3 (71.0–212.7) | 252 (41.0–313.0) | 0.91 |
| log hs-CRP (mg/L) | 0.2±0.8 | 0.2±0.8 | 0.2±0.7 | 0.3±0.8 | 0.67 |
| Fasting glucose (mg/dL) | 91.7±15.3 | 86.8±10.2 | 91.1±9.1 | 97.1±21.6 | < 0.001 |
| Fasting insulin (µU/mL) | 11.1±8.5 | 4.4±1.2 | 9.2±2.0 | 19.7±9.4 | < 0.001 |
| HOMA-IR | 2.6±2.1 | 0.9±0.3 | 2.1±0.4 | 4.7±2.2 | < 0.001 |
| Medication | |||||
| ACEi or ARB | 178 (88.6) | 62 (92.5) | 58 (86.6) | 58 (86.6) | 0.46 |
| Ca-based P-binder | 163 (81.1) | 56 (83.6) | 53 (79.1) | 53 (79.1) | 0.42 |
| Non Ca-based P-binder | 40 (19.9) | 13 (19.4) | 12 (17.9) | 15 (22.4) | 0.34 |
| Statin | 25 (12.4) | 7 (10.5) | 7 (10.5) | 11 (16.4) | 0.48 |
ACEi, angiotensin-converting enzyme inhibitor; ARB, angiotensin receptor blocker; BMI, body mass index; BUN, blood urea nitrogen; Ca, calcium; CVD, cardiovascular disease; DM, diabetes mellitus; HDL-C, high-density lipoprotein cholesterol; HOMA-IR, homeostasis model assessment-insulin resistance; hs-CRP, high-sensitivity c-reactive protein; IFG, impaired fasting glucose; iPTH, intact parathyroid hormone; IQR, interquartile range; LDL-C, low-density lipoprotein cholesterol; P, phosphorus; PD, peritoneal dialysis; SD, standard deviation.
Table 2
Table 3
| Variables | β | P |
|---|---|---|
| Age | 0.055 | 0.41 |
| Female | −0.037 | 0.58 |
| Body mass index | 0.169 | 0.011 |
| Previous cardiovascular disease | 0.137 | 0.029 |
| Triglyceride | 0.331 | < 0.001 |
| HDL-C | 0.017 | 0.81 |
| Calcium | 0.121 | 0.07 |
Table 4
| Variables | New-onset CV event | Without CV event | P |
|---|---|---|---|
| (n=36) | (n=165) | ||
| Age (y) | 57.9±7.5 | 52.0±8.1 | < 0.001 |
| Male | 16 (44.4) | 83 (50.3) | 0.52 |
| Body mass index (kg/m2) | 24±3.4 | 23.3±3.0 | 0.29 |
| % Lean body mass | 67.8±10.1 | 73.5±10.1 | 0.003 |
| Peritoneal dialysis duration (mo) | 87.7±52.1 | 81.9±54.9 | 0.56 |
| Kt/V | 2.0±0.3 | 2.0±0.4 | 0.83 |
| Previous CVD* | 11 (30.6) | 23 (13.9) | 0.016 |
| New-onset DM | 2 (1.0) | 10 (5.0) | 0.63 |
| Smoker | 6 (16.7) | 43 (26.1) | 0.23 |
| Hemoglobin (g/dL) | 10.4±1.5 | 10.6±1.5 | 0.42 |
| BUN (mg/dL) | 56.4±17.0 | 61.7±19.3 | 0.13 |
| Creatinine (mg/dL) | 11.3±3.3 | 12.0±3.4 | 0.27 |
| Albumin (g/dL) | 3.5±0.4 | 3.6±0.5 | 0.31 |
| Total cholesterol (mg/dL) | 181.0±36.1 | 182.4±36.2 | 0.84 |
| Triglyceride (mg/dL) | 136.4±78.7 | 141.5±112.2 | 0.8 |
| HDL-C (mg/dL) | 44.4±12.5 | 47.3±13.6 | 0.25 |
| LDL-C (mg/dL) | 113.6±28.5 | 107.3±32.6 | 0.29 |
| Calcium (mg/dL) | 9.0±1.0 | 9.0±0.8 | 0.91 |
| Phosphate (mg/dL) | 4.7±1.2 | 4.9±1.1 | 0.31 |
| iPTH (pg/mL) | 173.9 (71.5–32.9) | 153.5 (53.4–454.1) | 0.57 |
| log hs-CRP (mg/L) | 0.6±1.0 | 0.1±0.7 | 0.012 |
| HOMA-IR | 3.3±2.4 | 2.4±1.9 | 0.044 |
BUN, blood urea nitrogen; CVD, cardiovascular disease; DM, diabetes mellitus; HDL-C, high-density lipoprotein cholesterol; HOMA-IR, homeostasis model assessment-insulin resistance; hs-CRP, high-sensitivity c-reactive protein; iPTH, intact parathyroid hormone; LDL-C, low-density lipoprotein cholesterol; SD, standard deviation.
Table 5
Table 6
| Variables | Hazard ratio (95% CI) | P |
|---|---|---|
| Age (per 1 y) | 1.092 (1.035–1.152) | 0.001 |
| Female | 0.685 (0.310–1.511) | 0.35 |
| % Lean body mass (per 1%) | 0.978 (0.931–1.027) | 0.37 |
| Previous CVD* | 1.534 (0.690–3.410) | 0.29 |
| log hs-CRP (per 1 mg/L) | 2.286 (0.907–2.127) | 0.13 |
| HOMA-IR (per 1) | 1.180 (1.034–1.348) | 0.014 |