Elderly kidney transplant recipients have favorable outcomes but increased infection-related mortality
Article information

Abstract
Background
The number of elderly patients with end-stage kidney disease has been increasing, but the outcomes of kidney transplants (KT) remain poorly understood in elderly patients. Therefore, we evaluated the clinical outcomes of elderly KT recipients and analyzed the impact of elderly donors.
Methods
This retrospective cohort study included patients who underwent KT between 2000 and 2019. KT recipients were divided into four groups according to a combination of recipient and donor age (≥60 or <60 years); elderly recipients: old-to-old (n = 46) and young-to-old (n = 83); young recipients: old-to-young (n = 98) and young-to-young (n = 796). We compared the risks of mortality, graft failure, and acute rejection between groups using Cox regression analysis.
Results
The incidence of delayed graft function, graft failure, and acute rejection was not different among groups. Annual mean tacrolimus trough level was not lower in elderly recipients than young recipients during 10-year follow-up. Mortality was significantly higher in elderly recipients (p = 0.001), particularly infection-related mortality (p < 0.001). In multivariable Cox regression analysis, old-to-old and young-to-old groups had increased risk of mortality (adjusted hazard ratio [aHR], 2.89; 95% confidence interval [CI], 1.14–7.32; p = 0.03; aHR, 3.06; 95% CI, 1.51–6.20; p = 0.002). However, graft failure and acute rejection risks were not increased in elderly recipients.
Conclusion
In elderly recipients, graft survival and acute rejection-free survival were not inferior to those of young recipients. However, mortality, especially risk of infection-related death, was increased in elderly recipients. Thus, low immunosuppression intensity might help decrease mortality in elderly recipients.
Introduction
The prevalence and related burden of end-stage kidney disease (ESKD) is rapidly increasing globally [1]. South Korea is a developed country with a rapidly aging population [2,3]. Moreover, the number of patients with ESKD is increasing rapidly due to the increased burden of metabolic diseases, such as diabetes and hypertension, and economic development that improves the accessibility of renal replacement therapy (RRT) [1,4]. According to the United States Renal Data System report, South Korea has the fourth-highest incidence and the third-highest prevalence of ESKD in the world [5]. Furthermore, among ESKD patients in South Korea, the proportion of elderly patients has steadily increased from 36.0% in 2010 to 51.9% in 2019 [6].
Kidney transplant (KT) is the treatment of choice with the best prognosis for patients with ESKD [7,8]. Previous studies have demonstrated that the prognosis of KT is better than that of dialysis in elderly patients with ESKD [9–11]. Moreover, KT from elderly living donors to elderly recipients showed better graft survival than standard criteria deceased donor or expanded criteria deceased donor KT [12]. However, few studies have analyzed prognosis considering the ages of donors and recipients together, particularly Asians. Thus, this study investigated patient and graft outcomes of KT in elderly patients based on the combination of ages of the recipient and donor.
Methods
Patients
Patients aged >18 years who underwent KT at Kyungpook National University Hospital in Daegu, Korea between January 2000 and December 2019 were retrospectively analyzed. Retransplantation patients were also included. Old patients were defined as those 60 years or older, and we divided KT recipients into four groups according to combination of ages of recipient and donor, as follows (Fig. 1):
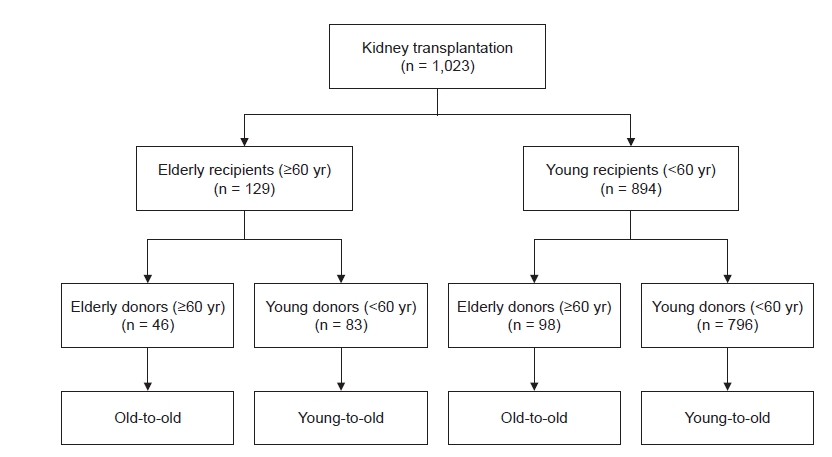
Flow diagram of the study.
(1) Elderly recipients: old-to-old, defined as both donor and recipient aged ≥60 years; young-to-old, defined as donor aged <60 years and recipient aged ≥60 years.
(2) Young recipients: old-to-young, defined as donors aged ≥60 years and recipients aged <60 years; young-to-young, defined as both donor and recipient aged <60 years.
Data collection
Patient data were retrospectively collected from electronic medical records. The demographics of the recipients include age, sex, body mass index (BMI), primary renal diseases, comorbid diseases, pretransplant dialysis vintage, pretransplant desensitization, number of human leukocyte antigen (HLA) mismatches, and type of immunosuppressants. Serial follow-up serum creatinine and tacrolimus trough levels were also collected, as well as demographic characteristics of donors, including age, sex, and BMI. The estimated glomerular filtration rate (eGFR) was calculated using the MDRD equation (derived from the Modification of Diet in Renal Disease study) [13]. Delayed graft function was diagnosed in KT recipients who underwent dialysis during the first week after transplant because of poor graft function [8]. Finally, annual mean tacrolimus trough level was calculated as the average value of all measured tacrolimus trough levels yearly after transplant.
Immunosuppressive treatment
Induction and maintenance immunosuppressive agents were used according to our center’s protocol. The detailed protocol is described in our previous studies [8,14]. Briefly, intravenous basiliximab was used as induction immunosuppression in normal-risk patients, and anti-thymocyte globulin was used for high-risk patients. For maintenance immunosuppression, standard triple immunosuppressive therapy (calcineurin inhibitor, mycophenolate, and corticosteroid) was applied. The target tacrolimus trough level was 5–10 ng/mL until 3 months after transplant, then it was tapered to 3–7 ng/mL. The target cyclosporine trough level was 200–300 ng/mL during the 3 months after transplant, after which it was tapered to 50–150 ng/mL for the maintenance period. Mycophenolate mofetil was administered daily at a fixed dose of 1.0 to 2.0 g. For corticosteroid treatment, 500 mg intravenous methylprednisolone was administered at the time of transplant and was tapered to 5 mg per day oral prednisolone within six months after transplant.
Outcomes
The study outcomes were patient survival, death-censored graft survival, and biopsy-proven acute rejection (BPAR)-free survival. Patient survival was defined as the time from KT to death from all causes. Death-censored graft survival was defined as the time from transplant to the restart of RRT. In cases of patient death with a functioning graft, graft survival was censored at the time of death. BPAR was diagnosed based on the Banff 07 classification [15] and was subdivided according to the time of diagnosis after transplant (early, 1 year or less after transplant; late, more than 1 year after transplant) and type of rejection.
Statistical analysis
Continuous variables were expressed as mean ± standard deviation, and categorical variables were expressed as number (percentage). Analysis of variance or Student t test was used to determine differences between continuous variables. Pearson chi-square test or Fisher exact test was used to determine differences among categorical variables. Patient survival, death-censored graft survival, and BPAR-free survival were analyzed using Kaplan-Meier analysis with log-rank tests. Multivariable Cox proportional hazard regression analyses were conducted for survival analyses. The results of Cox regression analysis were presented as hazard ratio (HR) with 95% confidence interval (CI). To avoid confounding effects, variables that were significantly different at baseline (p < 0.05; comorbid diabetes, BMI of recipient and donor, tacrolimus use, and number of HLA mismatches) or were associated with clinical outcomes of transplant (sex, transplant type, immunosuppressants given) were entered in the multivariable Cox regression analysis. Here, Model 1 was adjusted for sex and diabetes; Model 2 for Model 1 variables plus recipient BMI, donor BMI, and transplant type; Model 3 was adjusted for Model 2 variables as well as tacrolimus use, number of HLA mismatches, anti-thymocyte globulin induction, and maintenance mycophenolate use. Statistical analyses were conducted using IBM SPSS version 22.0 (IBM Corp., Armonk, NY, USA) and R (version 3.6.2; The R Foundation for Statistical Computing, Vienna, Austria). The p-values of <0.05 were considered statistically significant.
Ethics statement
The Institutional Review Board of Kyungpook National University Hospital reviewed and approved the study protocol (No. 2021-07-069). The requirement for informed consent was waived because the study was conducted as a retrospective review of electronic medical records. All patient information was anonymized and deidentified before analyses. This study was conducted according to the 2000 Declaration of Helsinki and the Declaration of Istanbul, 2008.
Results
Baseline characteristics
Of the total 1,023 KT recipients examined during the study period, 129 (12.6%) were ≥60-years-old at the time of transplant. Among these elderly recipients, 46 (4.5% of the total) received KT from old donors (age, ≥60 years), which is defined as the old-to-old group; 83 elderly recipients (8.1% of the total) were included in the young-to-old group. There were 893 KT recipients (87.4%) aged <60 years at the time of transplant; of them, 98 (9.6% of the total) received KT from old donors (age, ≥60 years) and were defined as the old-to-young group. There were 796 cases (77.8% of the total) in which both donor and recipient were aged <60 years, defined as the young-to-young group and set as the reference. The median follow-up duration for all patients was 69.2 months (interquartile range [IQR], 39.8–115.9 months); that for old-to-old was 52.0 months (IQR, 38.0–77.0 months), that for young-to-old was 57.7 months (IQR, 32.9–86.2 months), that for old-to-young was 55.8 months (IQR, 29.8–81.9 months), and that of the young-to-young groups was 73.4 months (IQR, 44.8–131.6 months). Baseline characteristics of each patient group are shown in Table 1. The mean age was 64.8 ± 3.5 years in the old-to-old group, 63.8 ± 3.2 years in the young-to-old group, 45.1 ± 3.2 years in the old-to-young group, and 43.6 ± 10.2 years in the young-to-young group. The proportion of males was higher among elderly recipients (old-to-old and young-to-old) compared with young recipients (old-to-young and young-to-young) (p = 0.007). More than half of the elderly recipients had ESKD due to diabetes, while more than half of the young recipients had ESKD due to glomerulonephritis (p < 0.001). Comorbid diabetes was more frequent in the elderly recipients compared with the young recipients (p < 0.001). Pretransplant dialysis vintage and pretransplant desensitization rates did not differ among groups. The mean ages of donors were 66.7 ± 4.9 years in old-to-old, 43.7 ± 12.0 years in young-to-old, 64.2 ± 3.7 years in old-to-young, and 41.9 ± 12.3 years in young-to-young (p < 0.001). Pretransplant donor serum creatinine levels were not different among groups. The proportion of living or deceased donors and type of induction immunosuppression did not differ among groups.
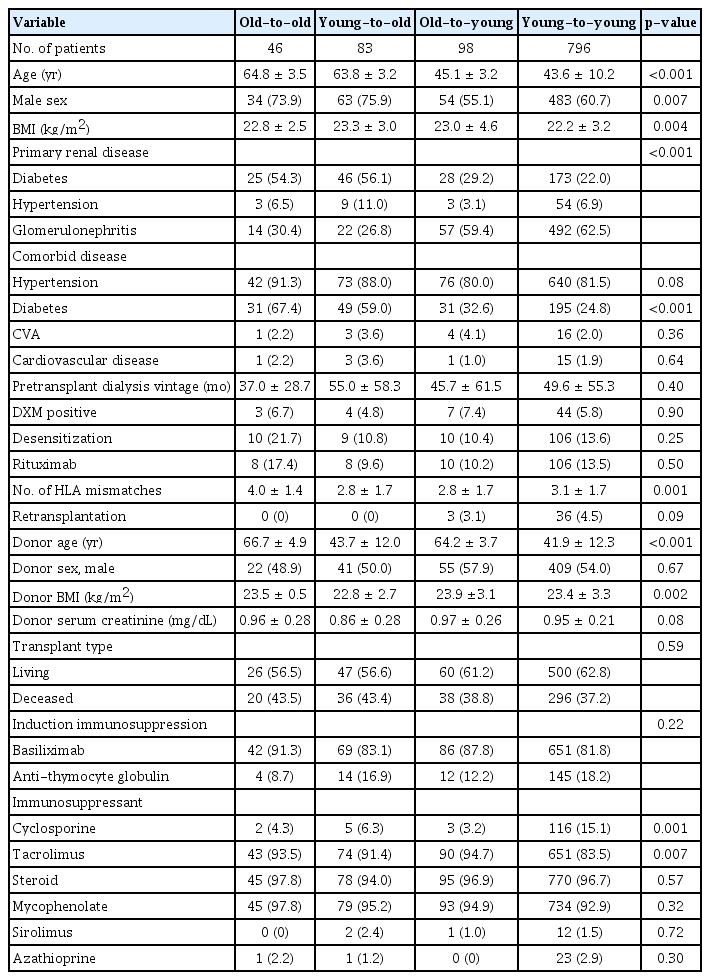
Baseline characteristics of patients
Tacrolimus immunosuppression after transplant
The majority of KT recipients (83.9%, 858 of 1,023) were on immunosuppressive therapy, including tacrolimus. Therefore, we compared mean tacrolimus trough levels to identify degree of immunosuppression after transplant (Fig. 2). The mean tacrolimus trough level was significantly lower for the old-to-old group than the young-to-young group at one year after transplant. However, there were no differences in annual mean tacrolimus trough level among groups at 2, 3, 4, 5, and 10 years after transplant.
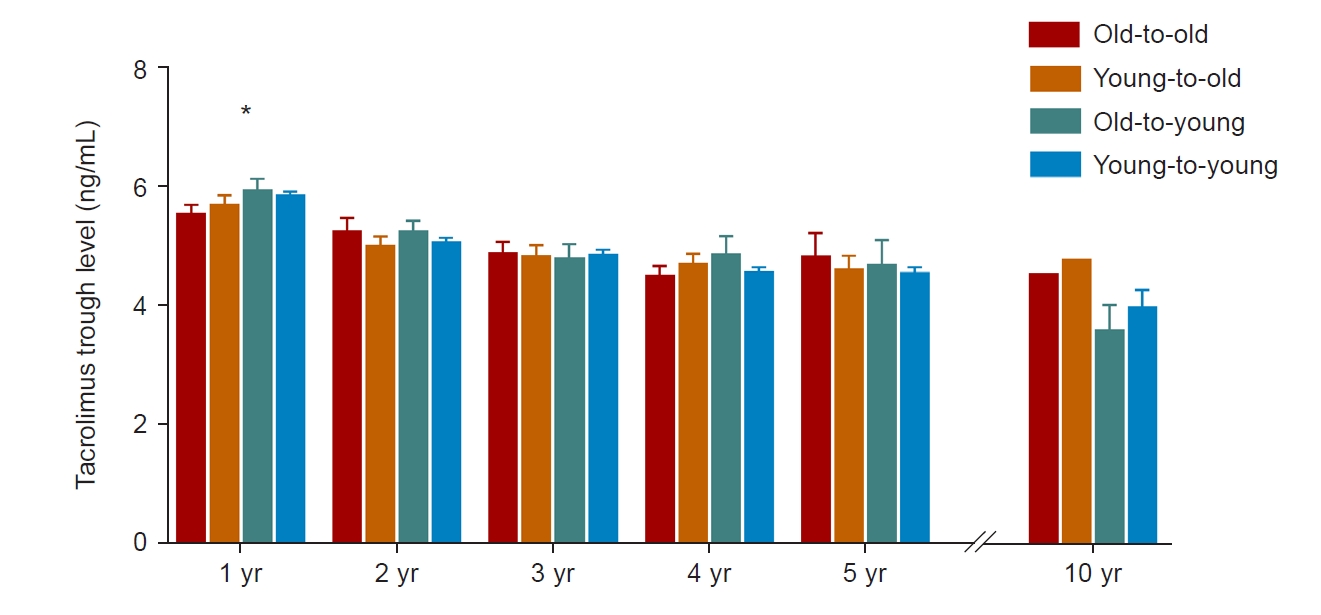
Comparison of annual mean tacrolimus trough levels.
*Old-to-old vs. young-to-young; p < 0.05.
Outcomes and graft function
Patient and graft outcomes are summarized in Table 2. The incidence of delayed graft function, graft failure, and BPAR including early and late events was not different among groups. The proportion of KT recipients whose serum creatinine level was higher than 1.5 mg/dL at 1 year after transplant was higher in the old-to-old and old-to-young groups. The proportions of patients who were hospitalized to treat infection did not differ among groups. The incidence of patient death was 13.0% (6 of 46) in the old-to-old group and 16.9% (14 of 83) in the young-to-old group. However, young recipients showed lower mortality (5.1% [5 of 98; old-to-young] and 6.0% [48 of 796; young-to-young]) (p = 0.001). Infection-related mortality was higher among elderly recipients (p < 0.001). The incidence of cardiovascular and cancer-related deaths was not different among the four groups. Supplementary Table 1 (available online) shows detailed information about infection-related death, the most common cause of which is pneumonia.
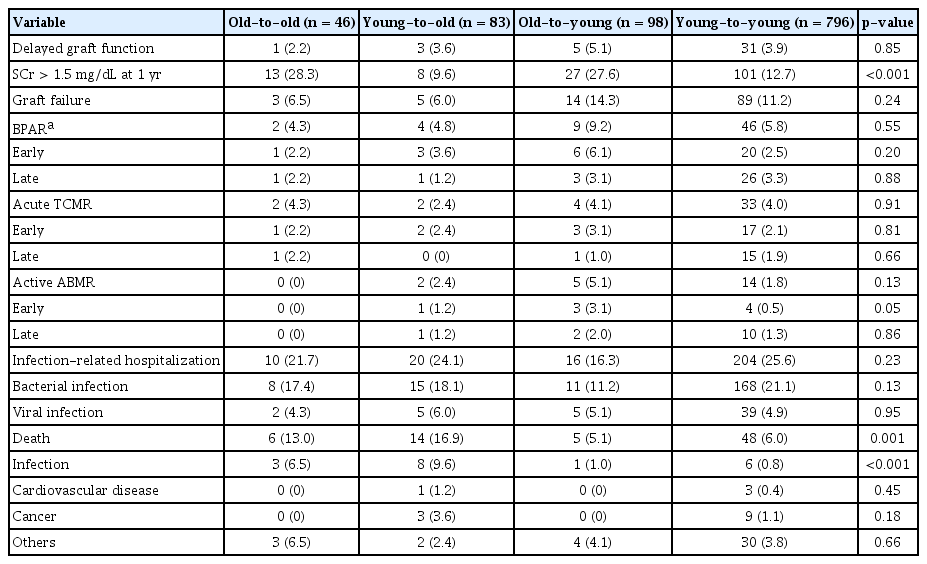
Comparison of graft and patient outcomes
In subgroup analysis according to donor type, elderly recipients showed higher all-cause mortality and infection-related mortality than young recipients in both living donor KT and deceased donor KT groups (all ps < 0.05; Supplementary Table 2, available online).
We increased the cutoff age of the elderly group to 65 years and compared outcomes among the four groups (Supplementary Table 3, available online). The number of patients in the old-to-old group was 16, in the young-to-old group was 33, and in the old-to-young group was 48. The results were similar to those of the analysis with an elderly cutoff age of 60 years. Both all-cause mortality and infection-related mortality were higher in the elderly recipient groups. When patients were divided into two groups based on the recipient or donor age of 70 years (age of ≥70 and <70 years), neither extremely elderly recipient nor donor KT groups showed higher incidence of graft failure and death of patients than the young recipient or donor KT groups as follows. 1) Extremely elderly recipients (n = 7) vs. young recipients (n = 1,016): graft failure, 0 vs. 111 (10.9%) (p > 0.99); death, 1 (14.3%) vs. 72 (7.1%) (p = 0.41). 2) Extremely elderly donors (n = 21) vs. young donors (n = 1,002): graft failure, 1 (4.8%) vs. 110 (11.0%) (p = 0.37); death, 1 (4.8%) vs. 72 (7.2%) (p = 0.67).
Serial changes in eGFR after transplant are shown in Fig. 3. The old-to-old group had significantly lower eGFR than groups with young donors (young-to-old and young-to-young) at 14 days and 1, 2, 3, and 5 years after transplant (p < 0.05).
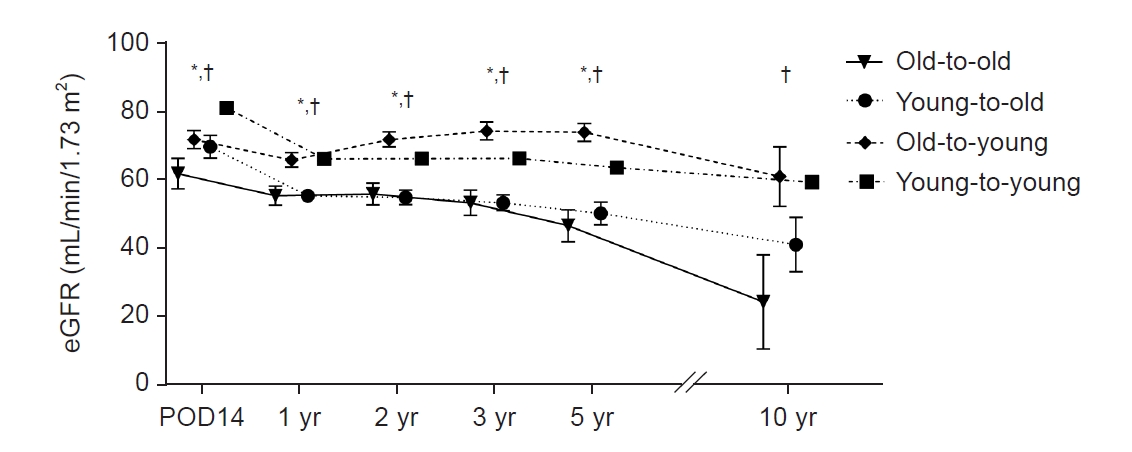
Serial changes in eGFR during 10-year follow-up.
eGFR, estimated glomerular filtration rate; POD, postoperative day.
*Old-to-old vs. young-to-old; p < 0.05. §Old-to-old vs. young-to-young; p < 0.05.
Patient survival
In the Kaplan-Meier curve for patient survival, elderly recipients showed significantly shorter survival times compared with young recipient groups (log-rank p < 0.001) (Fig. 4). In univariable Cox proportional hazard regression analysis, both elderly recipient groups showed a significantly higher risk of patient death than the young-to-young group (Table 3). In multivariable analysis to adjust for confounding effects of baseline characteristics, elderly recipients were consistently at significantly higher risk of patient death than was the young-to-young group (Model 3; old-to-old: aHR, 2.89; 95% CI, 1.14–7.32; p = 0.03; young-to-old: aHR, 3.06; 95% CI, 1.51–6.20; p = 0.002).
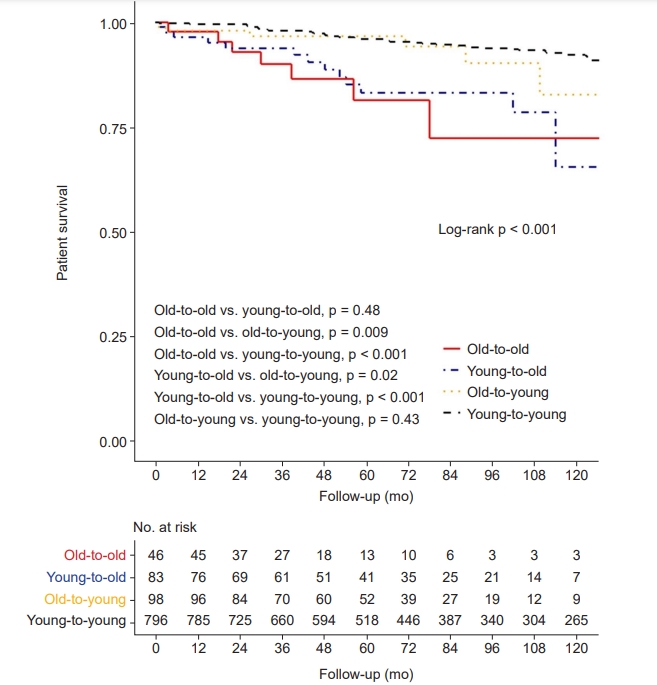
Kaplan-Meier curve for patient survival.
A p-value less than 0.008 indicates significant difference in post hoc Bonferroni correction.
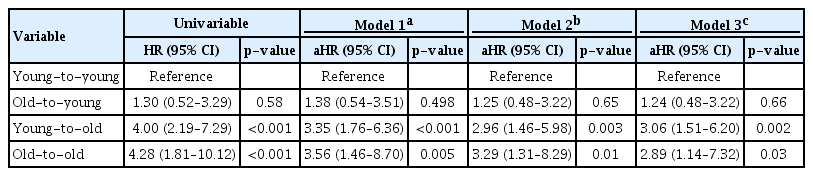
Cox regression analysis of patient death
Graft survival and biopsy-proven acute rejection-free survival
Death-censored graft survival was significantly different among the four groups in the Kaplan-Meier survival curve (log-rank p = 0.02) (Fig. 5A). In univariable and multivariable Cox proportional hazard regression analyses, there was no significant difference in graft failure in elderly recipients compared with the young-to-young group (p > 0.05) (Table 4). However, the old-to-young group showed a consistently increased risk of death-censored graft failure compared with the young-to-young group (Model 3: aHR, 2.41; 95% CI, 1.30–4.46; p = 0.005).

Kaplan-Meier curves for graft outcomes.
(A) Death-censored graft survival. (B) Biopsy-proven acute rejection (BPAR)-free survival. A p-value less than 0.008 indicates significant difference in post hoc Bonferroni correction.
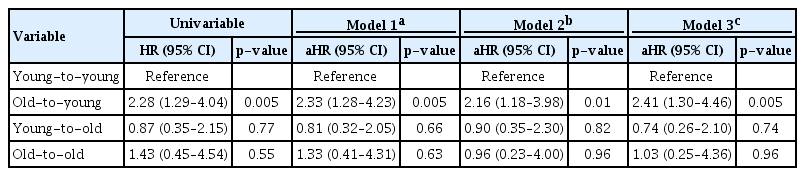
Cox regression analysis of death-censored graft failure
BPAR-free survival did not differ among the four groups as per the Kaplan-Meier survival curve (log-rank p = 0.389) (Fig. 5B). Table 5 shows a risk of BPAR among groups in univariable and multivariable Cox proportional hazard regression analyses. There were no significant differences in BPAR risk in groups other than the young-to-young group (p > 0.05).

Cox regression analysis of biopsy-proven acute rejection
Discussion
We demonstrated that graft survival is not inferior in elderly recipients regardless of donor age compared to young recipients with young donors. However, patient survival was lower in elderly recipients from both young and elderly donors. In particular, as infection-related mortality was higher in elderly recipients, special attention is needed in this area. This is the first Asian cohort study to evaluate patient and graft prognosis considering the combined effects of elderly recipients and donors. Our findings will assist physicians of elderly patients with ESKD in selecting appropriate RRT modality and to help decrease mortality in elderly recipients.
The prognosis of KT in generally better in Asian samples than in those of patients of other ethnicities [8,16,17]. Although the rate of KT in patients with ESKD has been steadily increasing, it is still low in elderly patients with ESKD in Korea [3,6,18]. KT improves the quality of life in patients with ESKD and has a better prognosis than dialysis [19], but elderly ESKD patients are often reluctant to receive KT, especially from elderly donors. Moreover, due to a shortage of donated organs, the waiting time for deceased donor KT is longer, making it more difficult for elderly ESKD patients to receive KT, especially from young donors [20]. However, survival benefit has been demonstrated in elderly KT recipients compared to dialysis patients on the waiting list for transplantation in several studies [7,9,10,21]. In addition, we showed that graft prognosis was not inferior in elderly recipients receiving kidneys from elderly donors compared to that of young recipients from young donors. Therefore, elderly patients with ESKD should be positively considered for KT from elderly donors.
In this study, recipient age had a significant impact on patient survival regardless of donor age. Even after adjusting for various confounding factors, elderly recipients consistently showed increased risk of death. Patients with ESKD on dialysis have the highest mortality from cardiovascular disease [6], but elderly recipients have increased mortality primarily due to infection. Although the overall incidence of infection was not higher than that in young recipients, many severe/critical infection cases lead to death of elderly patients. This suggests vulnerability to immunosuppressive therapy and the need for tailored immunosuppression in elderly recipients. The aging of the immune system, or immunosenescence, causes immune system alterations in that macrophages, neutrophil granulocytes, and dendritic cells have reduced capability to react to mediators and cytokines [22,23]. Therefore, theoretically, the intensity of immunosuppressive therapy in elderly recipients can be lowered during the maintenance period [22,24]. Our results showed that the mean tacrolimus trough level kept low during the first year after transplant for the old-to-old group, but the level was not low compared with the other groups thereafter. Therefore, it is recommended that clinicians maintain steady low immunosuppression after transplant, considering the risk of severe infection in elderly recipients.
The risk of graft failure was not increased in elderly recipients compared with young recipients receiving kidneys from young donors. This agrees with previous studies that examined the impact of donor age on graft survival in young recipients rather than elderly recipients [18,25,26]. Although elderly recipients have higher mortality than young recipients receiving kidneys from young donors, death-censored graft survival was not inferior in these elderly recipients regardless of donor age. Therefore, elderly recipients do not need to hesitate to receive a transplant from elderly donors because donor age has a minor effect on long-term function of the graft. In contrast, young recipients from elderly donors did not show increased mortality. However, the risk of death-censored graft failure was increased compared with that of young recipients receiving kidneys from young donors, so long-term graft survival will be the major issue when determining the prognosis of such young recipients.
Neither early nor late BPAR incidence was increased in elderly recipients compared with young recipients, and all groups showed a low incidence of BPAR in the range of 3% to 5%. BPAR episodes are a risk factor for patient death and graft failure in KT recipients [18]. BPAR has a greater association with mortality than does underlying diseases in elderly recipients [24,27,28]. Some previous studies have shown similar incidence of BPAR in elderly recipients to that of young recipients [29], whereas others showed a lower risk of BPAR [18,30,31]. We found that donor or recipient age had a neutral impact on BPAR, which might be due to the low overall incidence of BPAR in our study patients. Thus, it would be reasonable to maintain a low intensity of immunosuppression, especially for elderly recipients with high risk of infection-related death.
The strength of this study is that it demonstrates high infection-related mortality in elderly KT recipients, but not low immunosuppression intensity compared to young KT recipients. However, there are some limitations to this study. First, this is a retrospective observational study, so factors that affect patient or graft outcomes cannot be fully controlled, limiting the interpretation of the results. However, we analyzed the impact of donor or recipient age using multiple multivariable analysis models to minimize possible confounding variables. Second, the sample of elderly recipients was small, and results were based on a single transplant center, so the results of this study might not represent overall national results for Korea. However, this study observed prognosis over long periods for the entire cohort of a single transplant center and minimized variation based on differences between transplant centers or clinicians. Third, postoperative complications after transplant are higher in elderly recipients [32], but postoperative complications could not be examined based on the available data in this study. Therefore, prospective studies using a large-scale national cohort with various clinical information are warranted to overcome these limitations.
In conclusion, elderly recipients had increased risk of mortality compared with young recipients. Notably, infection-related mortality was higher in elderly recipients. However, graft survival and BPAR-free survival of elderly recipients were comparable with those of young recipients, and donor age did not significantly impact long-term graft function in elderly recipients. Thus, low immunosuppression intensity might help decrease mortality in elderly KT recipients.
Supplementary Materials
Notes
Conflicts of interest
All authors have no conflicts of interest to declare.
Funding
This study was supported by the Young Investigator Research Grant from the Korean Society of Nephrology (2021) and supported by a grant from the Korea Health Technology R&D Project through the Korea Health Industry Development Institute (KHIDI), funded by the Ministry of Health & Welfare, South Korea (grant number: HI15C0001).
Authors’ contributions
Conceptualization: JHL, GYL, CDK
Formal analysis: JHL, GYL, YJ
Funding acquisition: JHL, JHC
Investigation: JHL, GYL, HYJ, JYC, JHC, YLK, HKK, SH, ESY, DIW, CDK
Supervision: CDK
Writing–original draft: JHL, GYL, CDK
Writing–review & editing: All authors
All authors read and approved the final manuscript.