The effect of probiotic supplementation on systemic inflammation in dialysis patients
Article information

Abstract
Background
Emerging evidence suggests that intestinal dysbiosis contributes to systemic inflammation and cardiovascular diseases in dialysis patients. The purpose of this study was to evaluate the effects of probiotic supplementation on various inflammatory parameters in hemodialysis (HD) patients.
Methods
Twenty-two patients with maintenance HD were enrolled. These patients were treated twice a day with 2.0 ×10¹⁰ colony forming units of a combination of Bifidobacterium bifidum BGN4 and Bifidobacterium longum BORI for 3 months. The microbiome and fecal short-chain fatty acids (SCFAs) were analyzed. The percentages of CD14+ CD16+ proinflammatory monocytes and CD4+ CD25+ regulatory T-cells (Tregs) before and after probiotic supplementation were determined by flow cytometry. Serum levels of calprotectin and cytokine responses upon lipopolysaccharide (LPS) challenge were compared before and after probiotic supplementation.
Results
Fecal SCFAs increased significantly after probiotic supplementation. Serum levels of calprotectin and interleukin 6 upon LPS stimulation significantly decreased. The anti-inflammatory effects of probiotics were associated with a significant increase in the percentage of CD4+ CD25+ Tregs (3.5% vs. 8.6%, p < 0.05) and also with a decrease of CD14+ CD16+ proinflammatory monocytes (310/mm2 vs. 194/mm2, p < 0.05).
Conclusion
Probiotic supplementation reduced systemic inflammatory responses in HD patients and this effect was associated with an increase in Tregs and a decrease in proinflammatory monocytes. Hence, targeting intestinal dysbiosis might be a novel strategy for decreasing inflammation and cardiovascular risks in HD patients.
Introduction
Maladaptive and persistent inflammation has been recognized as an important player in the development of cardiovascular diseases and also as a predictor of mortality in patients with chronic kidney disease (CKD) [1,2]. Although not completely understood, retention of uremic solutes, oxidative stress, immune dysfunction, or dialysis-related factors including repeated exposure to dialysis membranes, contaminated dialysis water, and, recently, intestinal dysbiosis, have been implicated as important culprits in the development of chronic inflammation [3].
Significant alterations in the diversity and number of operational taxonomic units (OTUs) associated with increased intestinal permeability have been demonstrated in preclinical and clinical studies. Uremic milieu, slower colonic transit time, bowel edema due to volume overload, restrictions of fiber-rich diets, medications including phosphate binders, and frequent use of antibiotics might be factors contributing to the generation and maintenance of dysbiosis [3–5].
Probiotics are “live microorganisms that, when administered in adequate amounts, confer a health benefit to the host” [6]. Probiotics have been shown to partially restore normal intestinal microbiota and reduce the level of uremic toxins and systemic inflammation. A recent study by Soleiman et al. [7] showed improvement of glycemic control and reduction in C-reactive protein (CRP) in diabetic patients undergoing hemodialysis (HD). One of the mechanisms of probiotic-induced anti-inflammatory effects might be mediated via immune modulation.
CD4+ CD25+ regulatory T-cells (Tregs) are a subpopulation of T-cells with regulatory function and have been demonstrated to be effective in reducing inflammation [8]. CD14+ CD16+ nonclassical monocytes are a subset of proinflammatory monocytes which are increased in advanced CKD patients [9]. Lee et al. [10] previously demonstrated a positive correlation between these cells and vascular stiffness, suggesting the possible important role of this monocyte subset in increased cardiovascular risks in CKD patients.
The purpose of this study was to assess the effect of probiotic supplementation on inflammation in maintenance HD patients. We analyzed the microbiome, fecal short-chain fatty acids (SCFAs), and inflammatory responses before and 3 months after probiotic supplementation. The percentage of circulating Tregs and the number of CD14+ CD16+ monocytes were also measured by flow cytometry. The effect of probiotic supplementation on these parameters was also examined 4 months after the discontinuation of probiotics.
Methods
Study design
Enrolled patients included those aged ≥18 years undergoing maintenance dialysis for more than 3 months at Korea University Anam Hospital, a tertiary hospital in Seoul, South Korea, from November to December 2018. Exclusion criteria were patients who: (a) were on HD for acute kidney injury; (b) were on HD less than twice per week; (c) had uncontrolled diarrhea or gastrointestinal infection; (d) were currently taking or had taken probiotics within 3 months; (e) were treated with oral or intravenous antibiotics within 4 weeks of enrollment; and (f) were actively being treated for cancer, or with immunosuppressive drugs except for low dose steroid. The enrolled patients were treated with sachets (2-g mixtures of probiotics containing 7.0 × 10⁹ colony-forming units [CFU]/g of Bifidobacterium bifidum BGN4 and 2.0 × 10⁹ CFU/g of Bifidobacterium longum BORI) twice per day for 3 months. Compliance was checked by asking patients whether they took probiotics on schedule before every HD session. Blood and fecal samples were obtained at baseline and 3 and 7 months.
The study protocol was approved by the Institutional Review Board of Korea University Medical Center (No. 2018AN0346). Written informed consent was provided by all participants. The study was retrospectively registered in Clinical Research Information Service (CRIS) (KCT0005417; 09/09/2020).
Laboratory measurements
Routine laboratory measurements including complete blood counts with white blood cell differentials, CRP, albumin, blood urea nitrogen, creatinine, and electrolytes were obtained before the dialysis session. Patients’ demographic factors and current medications were also recorded.
Blood samples were centrifuged at 2,500 ×g for 15 minutes and stored at –80℃ for calprotectin measurements. Samples were analyzed using an enzyme-linked immunosorbent assay (LS-F9275; LSBio, Seattle, WA, USA) according to the manufacturer’s instructions.
Flow cytometric detection of regulatory T-cells and proinflammatory monocyte subsets
Blood samples were collected before the dialysis session. Whole blood (2.5 mL) was collected in a heparinized tube and 200 µL aliquots of heparinized blood were stained for 15 minutes at room temperature with either anti-human CD4 conjugated with allophycocyanin (CD4-APC), anti-human CD25 conjugated with phycoerythrin (CD25-PE) antibodies for detection of Tregs, anti-human CD14 conjugated with fluorescein isothiocyanate (CD14-FITC), or anti-human CD16 conjugated with allophycocyanin (CD16-APC) antibodies for the detection of monocytes (BD Biosciences, San Jose, CA, USA). After red blood cell lysis and washing, flow cytometric detection of Tregs and the CD14+ CD16+ proinflammatory monocyte subset from among 106 cells was performed (FACSCalibur; BD Biosciences) and analyzed by FlowJo version. 8.5.2 (BD Biosciences). The percentage of cells or the actual number of cells at baseline were compared to the values 3 months after initiation of probiotic supplementation as well as 4 months after the discontinuation of probiotic treatment.
Quantification of cytokines before and after lipopolysaccharide challenge
Fold changes of cytokine production upon lipopolysaccharide (LPS) challenge were compared before and after 3 months of probiotic supplementation. Right after collecting whole blood in a heparinized tube, 2 mL of blood was treated with or without 1 µg/mL of LPS (L2630; Sigma-Aldrich, St. Louis, MO, USA) for 24 hours in a 5% CO2 incubator at 37℃. The plasma was separated and stored at –20℃ until measurement. Quantification of plasma cytokines was performed using human inflammation cytometric bead array kits (BD Biosciences) and cytometric bead arrays (human inflammation kit; BD Biosciences) according to the manufacturer’s instructions to simultaneously detect levels of interleukin (IL)-1β, IL-6, IL-8, IL-10, IL-12p70, and tumor necrosis factor-α.
Measurement of fecal short-chain fatty acids
The concentrations of SCFAs in fecal samples were analyzed using high-performance liquid chromatography in the National Instrumentation Center for Environmental Management at Seoul National University (Seoul, South Korea). Feces were prepared in normal saline (300 µL per 1 g of feces). The fecal slurry supernatants were obtained through centrifugation (2,100 ×g for 10 minutes). SCFAs, including acetic, butyric, propionic, isovaleric, and valeric acids, were measured before and 3 months after probiotic supplementation.
Microbiome analysis
Sample DNA extraction and next generation sequencing
Bacterial genomic DNA was extracted from stool samples using a QIAamp Fast DNA Stool Mini Kit (Qiagen, Hilden, Germany). DNA extraction was performed after homogenization at 30 s for 1 minute using a TissueLyser system (Qiagen) and quantified using a QUBIT 3.0 Fluorometer (Thermo Fisher Scientific, Waltham, MA, USA). For next generation sequencing (NGS), 16S ribosomal RNA (rRNA) gene amplifications and index polymerase chain reactions (PCRs) were performed following the Illumina 16S metagenomic Sequencing Library preparation guide (Illumina, San Diego, CA, USA). The V3 and V4 regions of 16S rRNA were amplified using the following primer pair (forward 5’–TCGTCGGCAGCGTCAGATGTGTATAAGAGACAGCCTACGGGNGGCWGCAG–3’, reverse 5’–TCTCGTGGGCTCGGAGATGTGTATAAGAGACAGGACTACHVGGGTATCTAATCC–3’).
Nextera XT index kits (Illumina), using eight cycles, were then used to fragment DNA and add adapter sequences onto the DNA template. Each PCR product was purified using AMPure XP beads (Beckman Coulter, Pasadena, CA, USA). The amplicon library was sequenced by the 2 × 300 bp paired-end method on a Miseq instrument (Illumina) according to the Illumina protocol.
Bioinformatics analysis
Raw sequencing data were analyzed via QIIME2 (https://docs.qiime2.org/2019.7/) [11]. The fastq files were imported to QIIME2 using the ‘Casava 1.8 paired-end demultiplexed method’ and merged by DADA2 [12]. Filter parameters for trimming and truncating using the DADA2 plugin were 0 and 140 to remove low-quality regions of sequences. Feature tables and data generation (‘qiime feature-table summarized’ and ‘qiime feature-table tabulate-seqs’), and phylogenetic tree construction (‘qiime phylogeny-align-to-tree-mafft-fasttree’) were then performed. QIIME 2’s statistical analyses were also performed using the diversity plugin (“core-metrics-phylogenetic,” “alpha-group-significance,” and “beta-group-significance”). To perform taxonomic classification, ‘Greengenes 13_8 99% OTUs full-length sequences’ were used as 16S rRNA gene databases [13,14].
Statistical analysis
All analyses were performed using IBM SPSS version 25.0 (IBM Corp., Armonk, NY, USA). Data are expressed as medians (interquartile ranges) according to the distribution. Continuous variables (baseline, after 3 months) were compared using the Wilcoxon signed-rank test. A p-value of <0.05 was considered significant.
Results
Baseline patient characteristics
Of the 22 patients enrolled, 18 completed the study (two withdrew consent and two were hospitalized). The mean age was 68.1 years, and 16 patients (72.7%) were male. All patients received dialysis three times per week. The average time for receiving HD was 8 years (interquartile range, 4.3–11.8 years) and the prevalences of diabetes, hypertension, or histories of gastrointestinal surgeries were 18%, 81.5%, and 22%, respectively (Table 1). The percentages of patients on various medications, including phosphate binders, antacids, iron, and stool softeners, are reported in Table 1.
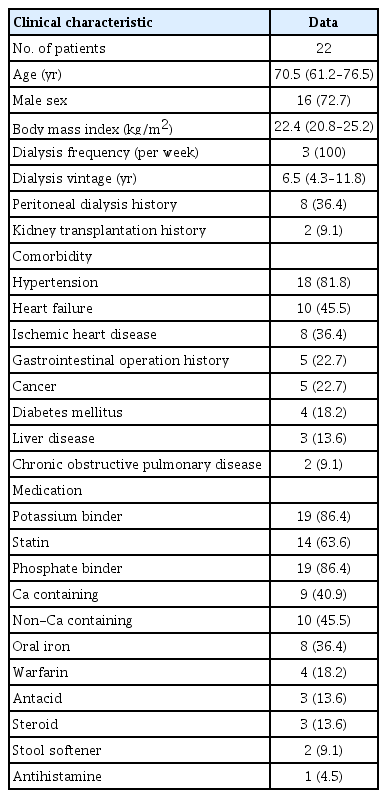
Patient demographic characteristics
The effect of probiotic supplementation on the microbiome and microbial metabolites
The richness expressed as Faith phylogenetic diversity, a sum of the branch lengths of a phylogenetic tree, was not different before and after probiotic supplementation (Fig. 1A). The evenness of the microbiome, which represents a relative abundance of the different species (Pielou’s evenness), was also comparable (Fig. 1B).
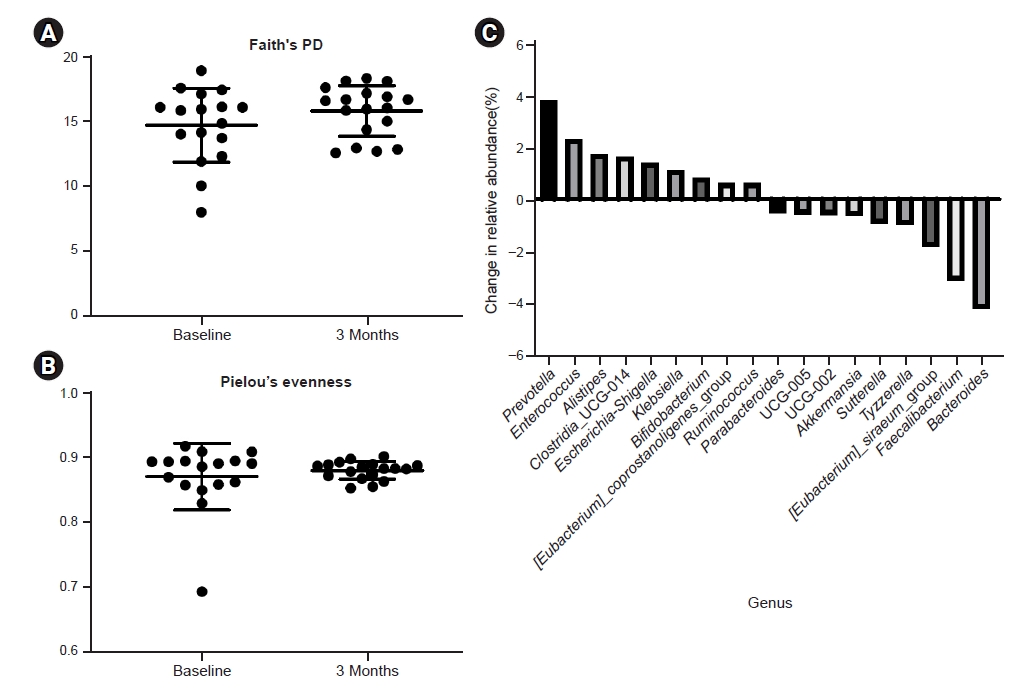
Microbiome analysis.
(A) Richness using Faith’s phylogenetic diversity (PD). (B) Community’s Pielou’s evenness. (C) Microbiome composition alteration at the genus level.
We observed that the relative abundance of Prevotella, Enterococcus, Alistipes, Clostridia, Escherichia-Shigella, Klebsiella, and Bifidobacterium increased whereas Bacteroides, Faecalibacterium, Eubacterium siraeum, Tyzzerella, Sutterella, and Akkermansia decreased after probiotic supplementation (Fig. 1C).
However, despite lack of change in species richness or evenness, we found probiotic supplementation for 3 months resulted in a significant increase of SCFAs such as acetic, butyric, propionic, and valeric acids in feces (Fig. 2).
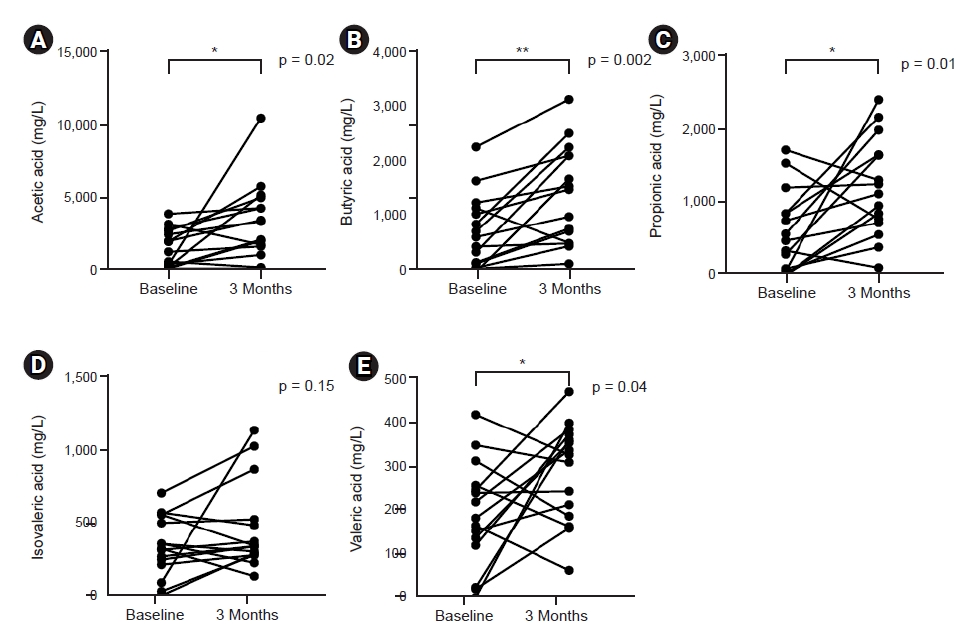
Effect of probiotic supplementation on fecal short-chain fatty acids level.
(A) Acetic acid, (B) butyric acid, (C) propionic acid, (D) isovaleric acid, and (E) valeric acid.
*p < 0.05, **p < 0.01 compared to baseline.
Effect of probiotic supplementation on inflammatory responses
Serum levels of CRP, albumin, calcium, phosphate, and intact parathyroid hormone were comparable before and after 3 months of probiotic supplementation. Hemoglobin, total white blood cell, and monocyte counts were also comparable (Table 2). Serum calprotectin, a marker of acute inflammation, decreased significantly after 3 months of probiotic supplementation (7,030 ng/mL vs. 1,831 ng/mL, p = 0.004) (Fig. 3A).

Comparison of baseline and postprobiotics supplement for clinical parameters

Effect of probiotic supplementation on inflammatory markers.
(A) Serum calprotectin level. (B) Fold increase of cytokines after lipopolysaccharide stimulation.
IL, interleukin; TNF, tumor necrosis factor.
*p < 0.05, **p < 0.01, ***p < 0.001 compared to baseline.
We also compared cytokine production upon LPS stimulation and found that the fold increase of IL-6 after LPS stimulation significantly decreased 3 months after probiotic supplementation (Fig. 3B).
Effect of probiotic supplementation on CD14+ CD16+ proinflammatory monocyte subset
We assessed the impact of probiotic supplementation on circulating proinflammatory monocytes. Using flow cytometry, monocyte subpopulations were divided into three different subsets: classical, intermediate, and nonclassical monocytes according to CD14 or CD16 positivity (Fig. 4A). Although the percent monocytes did not change in complete blood count, the actual number of CD14+ CD16+ proinflammatory, nonclassical monocytes decreased significantly after 3 months of probiotic supplementation (310/mm2 vs. 194/mm2, p < 0.05) (Fig. 4B).
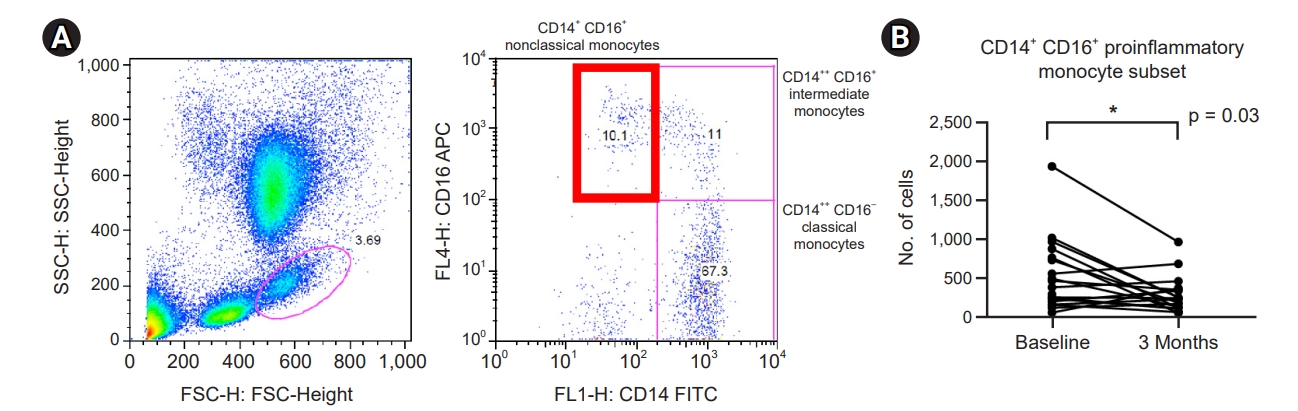
Effect of probiotic supplementation on proinflammatory, nonclassical monocyte subset.
(A) Identification of monocyte subset according to CD14 and CD16 by flow cytometry. (B) Number of CD14+ CD16+ nonclassical monocytes.
*p < 0.05 compared to baseline.
FSC, forward scatter; SSC, side scatter; FL, fluorescence; FITC, fluorescein isothyocianate; APC, allophycocyanin.
Effect of probiotic supplementation on regulatory T-cells
Circulating CD4+ CD25+ regulatory T-cells were identified by flow cytometry (Fig. 5A). The percentage of circulating CD4+ CD25+ Tregs increased from 3.5% at baseline to 8.6% 3 months after initiating probiotic supplementation (Fig. 5B).
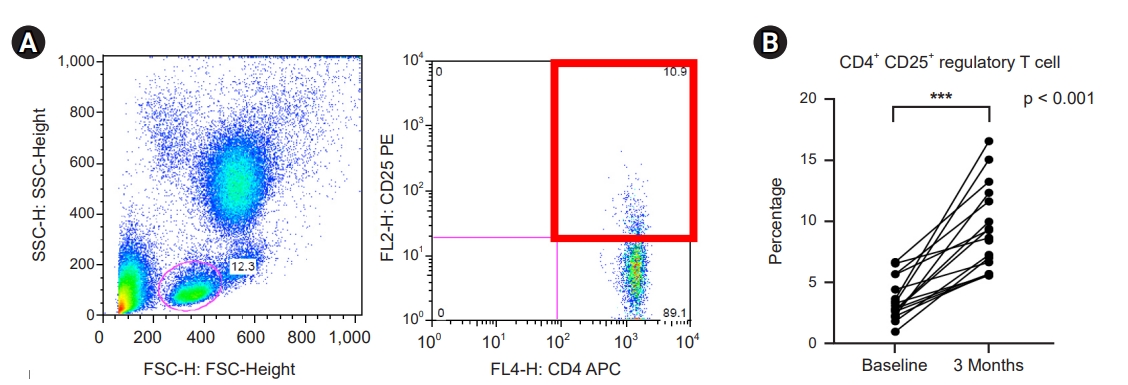
Effect of probiotic supplementation on CD4+ CD25+ regulatory T-cells.
(A) Identification of circulating CD4+ CD25+ regulatory T-cells. (B) Percentage of regulatory T-cells.
***p < 0.001 compared to baseline.
FSC, forward scatter; SSC, side scatter; FL, fluorescence; APC, allophycocyanin; PE, phycoerythrin.
Regulatory T-cells and proinflammatory monocytes after discontinuation of probiotic supplementation
The increased percentage of Tregs at 3 months after initiation of probiotic supplementation showed a complete return to baseline levels 4 months after the discontinuation of probiotics (Fig. 6A). The number of proinflammatory monocytes that decreased after probiotic supplementation also showed a trend to return to baseline after discontinuation of probiotic supplementation (p = 0.061) (Fig. 6B). However, the decreased serum calprotectin level was maintained after discontinuation of probiotics (Fig. 6C).

Effect of discontinuation of probiotics on immune cells and calprotectin level.
(A) Percentage of CD4+ CD25+ regulatory T-cells. (B) Number of CD14+ CD16+ nonclassical monocytes. (C) Serum calprotectin level.
NS, not significant.
*p < 0.05, **p < 0.01, ***p < 0.001 compared to baseline.
Adverse effects
Two patients were hospitalized during the study period, one for community-acquired pneumonia and the other for calculous cholecystitis. They were dropped in the final analysis. A causal relationship between probiotic use and infections was not clear.
Discussion
In this study, we demonstrated that the probiotic combination of B. bifidum BGN4 and B. longum BORI had anti-inflammatory and immunomodulatory effects in patients undergoing maintenance HD. Supplementation of probiotics for 3 months resulted in increased SCFA levels in feces. Serum calprotectin levels, as well as IL-6 response upon LPS challenge, decreased significantly 3 months after initiation of probiotic supplementation, and this anti-inflammatory effect was associated with a decreased number of circulating proinflammatory, nonclassical monocytes and an increased percentage of immunomodulatory Tregs. However, this effect on circulating immune cells was transient and returned to baseline after discontinuation of the probiotics.
Emerging evidence shows that intestinal microbiota plays an important role in both normal physiology as well as in acute or chronic inflammatory conditions. Both qualitative and quantitative changes in microbiomes have been reported in uremic animals as well as in patients. Chen et al. [15] reported the increase of relative abundance of Enterobacteriaceae, Ruminococcaceae, and Lachnospiraceae families in CKD patients and Sampaio-Maia et al. [16] showed the decrease of butyrate-producing bacteria such as Roseburia, Faecalibacterium, Clostridium, Coprococcus, and Prevotella in end-stage kidney disease. Although we observed that the relative abundance of Prevotella, Enterococcus, and Bifidobacterium increased whereas Bacteriodes and Faecalibacterium decreased after probiotic supplementation, the exact role of this change remains uncertain. However, a recent meta-analysis of eight studies with 261 patients suggested the potential beneficial effects of probiotics on inflammation, uremic toxins, and gastrointestinal symptoms [17].
B. bifidum BGN4 and B. longum BORI were isolated from the feces of healthy breast-fed infants and have been used as probiotics since 2000 [18–20]. Their complete genomic sequences were reported to GenBank [21]. B. longum BORI has been shown to shorten the duration of diarrhea in a clinical study of infants infected with rotavirus [18]. A safety assessment of B. bifidum BGN4 and B. longum BORI concerning ammonia production, hemolysis of blood cells, biogenic amine production, antimicrobial susceptibility patterns, antibiotic resistance gene transferability, PCR data on antibiotic resistance genes, mucin degradation, genome stability, and the presence of virulence factors has been recently reported [22]. Both strains have been considered “generally recognized as safe” by the U.S. Food and Drug Administration (GRN813 for B. longum BORI and GRN814 for B. bifidum BGN4; https://www.accessdata.fda.gov/scripts/fdcc/?set=GRASNotices).
CKD has emerged as a major cardiovascular risk factor and chronic inflammation is recognized as an important player [23]. The intestine is the single largest organ of the immune system, harboring the largest number of T-cells and macrophages in our body and thus considered to be a potent regulator of systemic immunity [24]. Therefore, it can be hypothesized that a pre- or probiotic-induced beneficial effect might be mediated by effects on immune cells.
In our previous study, we demonstrated that probiotics directly expanded CD11c+ CD103+ regulatory dendritic cells in vitro and percentages of regulatory dendritic cells increased significantly in probiotic-fed CKD mice, showing the possible direct effect of probiotics on immune cells [5]. In this study, we first observed that probiotic supplementation resulted in decreased numbers of proinflammatory monocytes. Monocytes are cells of the innate immune system and have heterogeneous phenotypes according to surface expression of CD14 or CD16 proteins [25]. Among them, CD14+ CD16+ are nonclassical monocytes that have been known to invade the endothelium and cause plaque formation in the general population and in patients with CKD [9]. We also demonstrated the expansion of these subsets and their associations with CRP and vascular stiffness in patients with advanced CKD [10]. A significant decrease in the actual number of CD14+ CD16+ nonclassical monocytes after probiotic supplementation suggests that the anti-inflammatory effect of probiotics could be partially mediated by inhibitory effects on the proinflammatory monocyte subset.
In addition to monocytes, we compared the percentage and number of circulating Tregs before and after probiotic supplementation and observed that the percentage of CD4+ CD25+ cells in blood showed a significant increase after 3 months of probiotic supplementation. Mahajan et al. [26] showed that Tregs protect against constant macrophage inflammation and reduce proinflammatory cytokine production in murine CKD models. Impaired Treg function was also observed in CKD patients, leading to chronic inflammation and subsequent atherosclerosis and cardiovascular diseases [27]. Wang et al. [28] also demonstrated that CKD patients with cognitive dysfunction who had increased percentages of Tregs showed significantly higher mini-mental state examination scores than those with reduced percentages of Tregs.
Given this potent immune suppressive function, expansion of circulating Tregs after probiotic supplementation is likely contribute to anti-inflammatory effect in our patients despite the possibility that CD25 positivity does not exclusively represent Tregs. However, we observed that the increased percentage of Tregs returned to baseline in all patients 4 months after the discontinuation of probiotics, suggesting the effect was only transient. There was no difference in the number of nonclassical monocytes 4 months after the discontinuation of probiotics.
We observed that serum calprotectin levels, as well as fold increases of IL-6 after the LPS challenge, decreased significantly after probiotic supplementation. Calprotectin is a heterodimeric complex of two S100 calcium-binding proteins; myeloid-related protein (MRP)-8 and MRP-14, which are mainly expressed in neutrophils and monocytes. Although calprotectin was originally known as a novel biomarker of disease activity in patients with inflammatory bowel disease when measured in feces, recent data suggest that serum calprotectin levels can be a useful biomarker of disease activity in several acute and chronic inflammatory conditions [29,30]. Serum and urine calprotectin have been demonstrated to be associated with the severity of renal injuries and endothelial dysfunction in Henoch-Schönlein purpura as well as anti-neutrophil cytoplasmic antibody-associated vasculitis even if CRP levels are not elevated [31,32]. As calprotectin is mainly produced by activated monocytes and neutrophils, decrease of calprotectin after probiotic supplementation is likely to be associated with decrease of CD14+ CD16+ proinflammatory monocytes. Although we observed that calprotectin levels decreased significantly after 3 months of probiotic supplementation, the usefulness of serum calprotectin levels as a sensitive marker of inflammation in patients with CKD or HD requires further examination.
IL-6 has been demonstrated to be an important player in the progression of CKD [33]. It exacerbates inflammation as well as endothelial injury by reducing endothelial nitric oxide synthase and injection of recombinant IL-6 exacerbates atherosclerosis in mice [34]. Our data showing that the fold increase of IL-6 upon LPS challenge significantly decreased after 3 months of probiotic supplementation also support its anti-inflammatory effect. This is also in line with previous studies showing decreased levels of IL-6 after 6-month supplementation of probiotics in peritoneal dialysis patients [35].
Various metabolites produced by intestinal microbiota are important in both normal physiology and in pathological conditions. SCFAs are bacterial fermentation products with pleiotropic functions including lipid regulation, energy metabolism, and immune regulation via interaction with G protein-coupled receptors (GPCR), histone deacetylases, or direct humoral effects [36]. They are known to be important in colonocyte survival, maintaining barrier integrity and immune modulation [37]. In contrast, excessive production of trimethylamine due to the consumption of an animal protein-rich diet has been shown to be associated with atherosclerosis and cardiovascular diseases [38]. In our study, we observed that the levels of acetic, butyric, propionic, and valeric acids increased significantly after 3 months of probiotic supplementation. Relative increase of Bifidobacterium, Ruminococcaceae, and Prevotella, well known as butyrate producers, might be responsible for this result [39]. Given that SCFAs have immunomodulatory effects, it is possible that significantly elevated levels of SCFAs during the probiotic supplementation might be responsible for decreased proinflammatory monocytes and expansion of Tregs. SCFAs such as butyrate have been demonstrated to induce Treg expansion directly or via IL-10 upon binding to GPCR [40]. This would have caused increased levels of Tregs in this study.
Even though our data show that probiotics elicited a very potent anti-inflammatory effect, two of the patients in our study required hospitalization. One patient was diagnosed with calculous cholecystitis, underwent a laparoscopic cholecystectomy, and was administered systemic antibiotics. The second patient was diagnosed with community-acquired pneumonia after 1 month of probiotic supplementation and was discharged after 5 days of systemic antibiotic therapy. Although a causal relationship between probiotic use and serious infections in this study was not clear, one should always be aware that excessive suppression of inflammatory responses might increase the risk of infections.
This study has several limitations. First, only a small number of patients participated, and it was not a randomized-controlled or crossover study. A low prevalence of diabetes was probably due to the small sample size and selection bias. Second, no control group was available to compare the results of probiotics supplementation. Also, defining Tregs by only CD25 positivity is another limitation. Additional markers such as Foxp3 would have helped further isolate functional Tregs.
In conclusion, probiotic combinations of B. bifidum BGN4 and B. longum BORI reduced systemic inflammatory responses and this effect was partially mediated by an increase of Tregs and a decrease of the nonclassical proinflammatory monocyte subset. Larger-scale clinical studies testing the components of microbiota or their metabolites and assessing the effects on long-term outcomes in dialysis patients are needed.
Notes
Conflicts of interest
All authors have no conflicts of interest to declare.
Funding
This study was supported by the Basic Science Research Program through the National Research Foundation of Korea funded by the Ministry of Education (2017AR1A2B2734).
Authors’ contributions
Conceptualization, Methodology: EC, JY, SKJ
Data curation, Formal analysis: EC, JY, SKJ, MSP, YS
Funding acquisition: SKJ
Investigation: GEJ, SWO, MGK, WYC
Writing–original draft: EC, JY, SKJ
Writing–review & editing: MSP, YS
All authors read and approved the final manuscript.