Urinary exosomal microRNA profiling in type 2 diabetes patients taking dipeptidyl peptidase-4 inhibitor compared with sulfonylurea
Article information

Abstract
Background
Dipeptidyl peptidase-4 (DPP-4) inhibitor has been reported to have kidney-protective benefits. To elucidate how antidiabetic agents prevent diabetic kidney disease progression, it is important to investigate their effect on the kidney environment in type 2 diabetes mellitus (DM) patients. Herein, we investigated the expression pattern of urinary exosome-derived microRNA (miRNA) in patients taking a combination of DPP-4 inhibitor and metformin (DPP-4 inhibitor group) and compared them with patients taking a combination of sulfonylurea and metformin (sulfonylurea group).
Methods
This was a prospective study involving 57 patients with type 2 DM (DPP-4 inhibitor group, n = 34; sulfonylurea group, n = 23) and healthy volunteers (n = 7). We measured urinary exosomal miRNA using the NanoString nCounter miRNA array (NanoString Technologies) across the three groups (n = 4 per each group) and validated findings using real-time polymerase chain reaction.
Results
Twenty-one differentially expressed candidate miRNAs were identified, and six (let-7c-5p, miR-23a-3p, miR-26a-3p, miR-30d, miR-205, and miR-200a) were selected for validation. Validation showed no significant difference in miRNA expression between the DPP-4 inhibitor and sulfonylurea groups. Only miR-23a-3p was significantly overexpressed in the diabetes group compared with the control group (DPP-4 inhibitor vs. control, p = 0.013; sulfonylurea vs. control, p = 0.007). This trend was consistent even after adjusting for age, sex, and body mass index.
Conclusion
There was no significant difference in urine exosome miRNA expression between diabetic participants taking DPP-4 inhibitor and those taking sulfonylurea. The miR-23a levels were higher in diabetic participants than in nondiabetic controls.
Introduction
Type 2 diabetes mellitus (DM) has reached endemic levels and is a major public health concern [1]. Chronic exposure to hyperglycemia due to long-standing DM and poor glycemic control damages the microvasculature eventually leading to a number of complications including kidney disease, retinopathy, and peripheral neuropathy. Therefore, strict control of blood glucose is essential to prevent microvascular complications in type 2 DM as well as type 1 DM [2,3]. There are currently several antidiabetic drugs on the market for maintaining proper glycemic targets and reducing complications.
Metformin monotherapy has been the preferred first-line treatment for type 2 DM [4]. In cases where metformin monotherapy is inadequate for glycemic control, and the patient does not have atherosclerotic cardiovascular disease or chronic kidney disease, a combination of metformin with an antihyperglycemic drug from any one of the following six antidiabetic drugs classes is recommended; sulfonylurea, thiazolidinedione, dipeptidyl peptidase-4 (DPP-4) inhibitor, sodium-glucose cotransporter 2 inhibitor, glucagon-like peptide-1 receptor agonist, or basal insulin. The choice of combination therapy is based on drug-specific effects and patient factors [4]. Sulfonylurea and DPP-4 inhibitors are currently the most widely prescribed second-line oral antidiabetic agents [5]. DPP-4 inhibitor provides renoprotection in addition to lowering blood glucose levels by ameliorating kidney fibrosis, reducing renal oxidative stress, and attenuating filtration barrier injury [6–10]. While DPP-4 inhibitor represents a major milestone in DM management, there are limited clinical data to support the claim that these drugs are renoprotective [11–13].
MicroRNAs (miRNAs) are small, noncoding RNAs involved in negative posttranscriptional regulation. miRNA are critical for normal animal development and are involved in various biological processes [14,15]. Previous studies reported that miRNA plays a pivotal role in DM development by affecting pancreatic β-cell function and insulin resistance [16]. MiRNA is thought to influence diabetic complications and can thus serve as potential biomarkers and therapeutic targets [17]. DPP-4 inhibitor has been reported to regulate miRNAs by suppressing the transforming growth factor-β signaling pathway, which induces miR-29 and miR-let-7; these two miRNAs comprise positive feedback loops of anti-endothelial mesenchymal transition [6,18,19]. Another study reported that treatment with linagliptin, a DPP-4 inhibitor, restored miR-29c levels while suppressing profibrotic miRNA induction such as miR-199-3p [20].
While the majority of miRNAs are located within the cell microenvironment, some miRNAs known as circulating miRNAs or extracellular miRNAs are found in the extracellular environment [21]. Extracellular miRNAs are bound to proteins or wrapped with small membranous particles such as exosomes, microvesicles, and apoptotic bodies to shield them from degradation [21]. Exosome-mediated miRNA transfer, mediates cell-cell communications, and has been associated with several human diseases including kidney diseases [22–24].
In this study, we evaluated DPP-4 inhibitor effects on the kidney microenvironment and their kidney-protective effect in type 2 DM patients. We hypothesized that DPP-4 inhibition will change the kidney microenvironment, and this will affect miRNA expression of urinary exosome. Considering the urinary exosome as a reflection of the renal microenvironment [25], we investigated and compared the expression pattern of urinary exosome-derived miRNAs in patients taking a DPP-4 inhibitor with patients taking sulfonylurea as second-line antihyperglycemic treatments.
Methods
Study subjects
This was a prospective observational study of patients who received outpatient treatment at the endocrinology department of Soonchunhyang University Cheonan Hospital in Cheonan, Republic of Korea. The study complied with the Declaration of Helsinki and the study protocol was approved by the Institutional Review Board of Soonchunhyang University Cheonan Hospital (No. 2017-11-031). All patients provided written informed consent before enrollment.
We recruited type 2 DM patients who were on a combination of sulfonylurea (glimepiride or gliclazide) or DPP-4 inhibitor (gemigliptin) and metformin for at least 3 months and had not taken other diabetic medications. Inclusion criteria included being 20 to 60 years old, glycated hemoglobin level between 6% and 10%, and eGFR of >60 mL/min/1.73 m2. Exclusion criteria included patients who had pancreas, heart, liver, or blood diseases, had a history of cancer, suffered from an infection or inflammatory disease, had been treated for an acute diabetic complication recently, or who had a history of hospitalization within the last 3 months. Nondiabetic patients who did not have DM, hypertension, and cardiovascular disease were also enrolled as controls for comparison. We categorized patients who took metformin and sulfonylurea as the sulfonylurea group and patients that took metformin and DPP-4 inhibitor as the DPP-4 inhibitor group. The nondiabetic participants were the control group.
Isolation of exosomal microRNA from urine
Fasting urine samples (10 mL) were collected in sterile containers and centrifuged at 10,000 ×g for 10 minutes to remove large particles (apoptotic bodies, microparticles), cell debris, organelles, and protein aggregates. Extracellular vesicles were then precipitated from 15 mL of urine using miRCURYTM Exosome Isolation Kits (Exiqon A/S, Vedbaek, Denmark), according to the manufacturer’s protocol. RNA was extracted from the exosomes using the miRNeasy Mini Kit (Qiagen, Hilden, Germany). Exosome suspensions (200 μL) were mixed with QIAzol lysis buffer (1 mL; Qiagen), and the mixtures were processed according to the manufacturer’s guidelines. RNA was eluted in RNase‐free water (20 μL; Qiagen). Noncoding RNAs were isolated from exosomes using the miRNeasy Micro Kit (Qiagen, Valencia, CA, USA).
miRNA profiling using NanoString technology
To profile miRNA expression from urinary exosomes, the NanoString nCounter system assay was performed using the NanoString platform and nCounter Human v3 miRNA Expression Assay Kits (NanoString Technologies, Seattle, WA, USA), according to the manufacturer’s instructions. MiRNA profiling was performed on four samples each from the sulfonylurea, DPP-4 inhibitor, and control groups, starting from 3 μL of isolated RNA (~150 ng). Samples were processed using the automated nCounter Prep Station; following hybridization, they were purified and immobilized on a sample cartridge for quantification and data collection using the nCounter Digital Analyzer.
Comparing miRNA expression levels between groups
To compare miRNA expression between the groups, we used the open-source statistical platform NanoStringDiff [26]. Briefly, this method assumes a negative binomial-based model to fit the discrete nature of the nCounter data and corrects for platform variation, sample content variation, and background noise. Data normalization was incorporated into the model framework using data normalization parameters, which were estimated from positive controls, negative controls, and housekeeping genes embedded in the nCounter system. Additionally, false discovery rate adjusted p-values were based on a significance level of p < 0.05 for every comparison per gene.
Quantitative real-time polymerase chain reaction
miRNAs were isolated from urinary exosomes. To synthesize complementary DNA (cDNA), we used the TaqMan Advanced miRNA cDNA Synthesis Kit (Applied Biosystems, Franklin Lakes, NJ, USA). We followed the guidelines for preparing cDNA templates, using 2 µL of exosomal RNA sample, all mature miRNAs in the sample were reverse transcribed to cDNA. To evaluate miRNA expression levels, we used TaqMan Advanced miRNA assays (Applied Biosystems) with synthesized cDNA. Gene expression levels were quantified using the StepOneTM real-time (RT) polymerase chain reaction (PCR) System (Applied Biosystems). The same amount of miRNA was used for validation [27]. Comparative RT-PCR including the no-template controls was performed using specific primers for let-7c-5p, miR-23a-3p, miR-26a-3p, miR-30d, miR-205, and miR-200a, with reagents from TaqMan reagents (Applied Biosystems). The PCR was carried out with the following conditions: 95℃ for 20 seconds (polymerase activation step), denaturation at 95℃ for 1 second, and anneal/extend at 60℃ for 20 seconds (40 cycles). PCR results were calculated using the comparative threshold method.
Statistical analysis
Statistical tests and data representation were performed using R version 4.0.0 (The R Foundation for Statistical Computing, Vienna, Austria). Categorical variables are expressed as count (percentage). Normally distributed continuous variables are expressed as mean ± standard deviation and non-normally distributed continuous variables are expressed as medians with interquartile ranges. Groups were compared with Student two-tailed unpaired t test or one-way analysis of variance, followed by post hoc test using a pairwise t test with Bonferroni correction. Data are represented as mean values with 95% confidence intervals in error bar plot. Multiple linear regression models were used to compare miRNA expression between groups after adjusting for confounders. A p-value of <0.05 was considered statistically significant.
Results
Patient characteristics
A total of 64 participants were enrolled in this study; 34 participants in the DPP-4 inhibitor group, 23 participants in the sulfonylurea group, and seven participants in the control group. The mean age of diabetic participants was 53.4 ± 11.6 years, with a mean body mass index (BMI) of 26.1 ± 3.3 kg/m2; 36 diabetic patients (63.2%) were men. The mean age of the nondiabetic participants was 42.3 ± 11.5 years, with a mean BMI of 21.5 ± 1.7 kg/m2, and four nondiabetic patients (57.1%) were men. Baseline characteristics of the study participants are presented in Table 1. There was no significant difference in baseline clinical parameters between the DPP-4 inhibitor group and the sulfonylurea group. In the DPP-4 inhibitor and sulfonylurea groups, 14 patients (41.2%) and 11 patients (47.8%) took angiotensin converting enzyme inhibitors or angiotensin receptor blocker, respectively, and this difference was not significant. Four representatives from each group (DPP-4, sulfonylurea, control) were selected to undergo NanoString analysis by matching age, gender, and BMI. Their baseline characteristics are presented in Supplementary Table 1 (available online). There were no significant differences in baseline characteristics between all patients and the four representative patients included in the NanoString analysis.
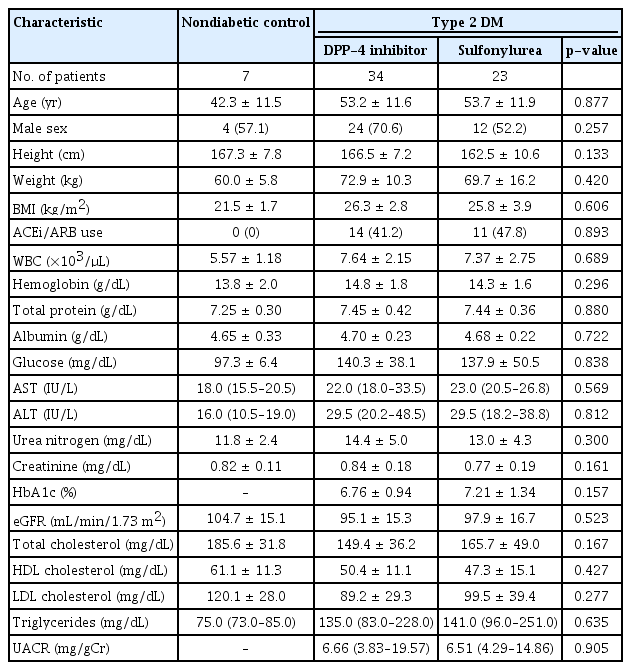
Baseline characteristics of study subjects
Exosomal miRNA expression profiles
In miRNA profiling analyses with NanoString technology, there were 21 differentially expressed candidate miRNAs between the DPP-4 inhibitor group and the sulfonylurea group (Fig. 1A). Of these, four miRNAs were upregulated in the DPP-4 inhibitor group and 17 miRNAs were upregulated in the sulfonylurea group (Fig. 1B). The expression patterns of these 21 miRNAs are presented as a heatmap (Fig. 1C). Altogether, 90 miRNAs were differentially expressed between the sulfonylurea group and the control group (58 miRNAs upregulated in the sulfonylurea group and 32 miRNAs upregulated in the control group), and 84 miRNAs differentially expressed between the DPP-4 inhibitor group and the control group (72 miRNAs upregulated in the DPP-4 inhibitor group and 12 miRNAs upregulated in the control group) (Supplementary Fig. 1, 2; available online).

Expression patterns of urinary exosomal miRNAs from nondiabetic controls and type 2 diabetic participants who were grouped according to their medication.
(A) Venn diagrams of differentially expressed miRNAs between the sulfonylurea (SU) group, the DPP-4 inhibitor (DPP4i) group, and the control (CTRL) group. (B) Log fold change (FC) values of differentially expressed miRNA in the DPP4i group compared with the SU group. (C) Heatmap representing hierarchical clustering of differentially expressed miRNAs in the DPP4i group and the SU group.
DPP-4, dipeptidyl peptidase-4; miRNA, microRNA.
Validation of candidate urinary exosomal miRNAs expression
From the 21 differentially expressed urinary exosomal miRNAs between the DPP-4 inhibitor group and the sulfonylurea group, six miRNAs (let-7c-5p, miR-23a-3p, miR-26a-3p, miR-30d, miR-205, and miR-200a) were selected for validation. These six miRNAs were selected through literature review, and it was confirmed that the miRNAs were associated with DM. Unlike with the NanoString analysis results, we failed to reproduce differences between miRNA expression in the DPP-4 inhibitor group and the sulfonylurea group in all the six miRNAs. Only miR-23a-3p was significantly overexpressed in the urinary exosome of the DM groups compared with the nondiabetic control group (p for DPP-4 inhibitor group vs. control group = 0.013, p for sulfonylurea group vs. control group = 0.007) (Fig. 2; Supplementary Fig. 3, available online). Even after adjusting for age, sex, and BMI, miR-23a-3p expression was significantly higher in the DM groups than in the control group (p for DPP-4 inhibitor group vs. control group = 0.015, p for sulfonylurea group vs. control group = 0.022). There was no significant difference between the control groups and the two DM groups (DPP-4 inhibitor group and sulfonylurea group) in let-7c-5p, miR-26a-3p, miR-30d, miR-205, and miR-200a expression (Fig. 2, Supplementary Fig. 3). There was no clear correlation between the urinary exosomal miRNAs and kidney function and albuminuria (Supplementary Table 2, available online).

Expression of candidate urinary exosomal miRNAs between the control (CTRL), DPP-4 inhibitor (DPP4i), and sulfonylurea (SU) groups.
The comparative threshold values of quantitative real-time polymerase chain reaction of urinary exosomal miRNAs including let-7c-5p (A), miR-23a-3p (B), miR-26a-3p (C), miR-30d (D), miR-205 (E), and miR-200a (F) are presented as arithmetic means and 95% confidence intervals in an error bar plot.
DPP-4, dipeptidyl peptidase-4; miRNA, microRNA.
*p < 0.05, **p < 0.01.
Discussion
In this study, NanoString analysis showed 21 differentially expressed urinary exosomal miRNAs between the DPP-4 inhibitor group and the sulfonylurea group. However, we failed to reproduce differences in miRNA expression with RT-PCR validation. Based on our RT-PCR results, miR-23a-3p was significantly higher in the urinary exosome of the diabetic participants than in the nondiabetic controls.
There was no difference in urinary exosomal miRNA expression between the DPP-4 inhibitor group and the sulfonylurea group in this study. This is likely because there was no difference between the two groups, but non-drug-related reasons may have obscured any actual difference. Heterogeneity in participant baseline characteristics could have made it challenging to find the true difference. In particular, the duration of drug use and duration of DM status were variable between the study participants. Furthermore, the homogeneity between the two diabetic groups could have masked differences resulting from the two antidiabetic drugs. The participants across the two diabetic groups had similar overall characteristics in that both groups comprised type 2 DM patients who received outpatient care without other problems.
Urinary exosome-derived miRNAs are protected from endogenous RNase activity, they are remarkably stable, and they are not easily confounded by circulating miRNAs that pass through the glomerular filtration barrier [28,29]. This makes miRNA profiling useful in DM cases and suggests that urinary exosome-derived miRNAs might be better diagnostic markers than free miRNAs. Although there are many studies that reported a role for exosomal miRNAs in DM [17,30], no research study has reported expression patterns of exosomal miRNAs with regard to diabetic medications. Our work presents insights and approaches for new research on diabetic medication. If the shortcomings of our research are addressed in future research, we can further evaluate how diabetic medications affect the kidney environment.
In our study, miR-23a-3p was significantly overexpressed in the urinary exosome of the DM groups compared with the nondiabetic control group. Xu et al. [31] reported that miR-23a was upregulated in renal tissue of diabetic patients and high glucose-induced HK cells. This result was consistent with our findings, especially considering that most exosomes in urine might originate from the kidney cells. Their study also showed that knockdown of miR-23a suppressed high glucose-induced epithelia-mesenchymal transition and renal fibrosis. Our research only revealed that miR-23a levels were elevated in the urinary exosome of diabetic participants, so further research to verify the association between miR-23a in the urinary exosome and t diabetic kidney disease severity is needed.
Our study has a number of limitations. First, the changes in miRNA levels over time were not measured because of the cross-sectional design of this study. If the changes had been analyzed, the effects of the drugs on exosomal miRNA would have been more conspicuous, which would have increased our statistical power. Second, as previously mentioned, the duration of diabetic mediation varied among study subjects. Third, the association of miR-23a levels in urinary exosome with the degree of kidney damage was not examined because most of the participants included in this study had a normal range of albuminuria and renal function.
In conclusion, there was no significant difference in urine exosome miRNA expression between diabetic participants taking a DPP-4 inhibitor and those taking sulfonylurea. The miR-23a was elevated in diabetic participants compared with nondiabetic controls. Further research on the effects of diabetic medication on exosomal miRNA expression is required.
Supplementary Materials
Notes
Conflict of interest
All authors have no conflicts of interest to declare.
Funding
This study was supported by the Daewoong and Sonchunhyang University Research Funds.
Authors’ contributions
Conceptualization: HWG, SWC, DYK, NJC
Data curation: SWC, DYK, HWG, SP, EL
Formal analysis, Visualization: TWH, HKK, NJC
Funding acquisition: HWG
Investigation: TWH, HKK, MRL
Methodology: MRL, SHK, HWG, NJC
Project administration: HWG
Writing–Original Draft: NJC, HWG
Writing–Review & Editing: All authors
All authors read and approved the final manuscript.