Current characteristics of dialysis therapy in Korea: 2016 registry data focusing on diabetic patients
Article information
Abstract
Diabetic nephropathy is the most frequent cause of end-stage renal disease worldwide. Dialysis patients with diabetes mellitus (DM) have more complications and shorter survival duration than non-DM dialysis patients, requiring more clinical attention and difficult management. The registry committee of the Korean Society of Nephrology has collected data about dialysis therapy in Korea through an on-line registry program and analyzed the characteristics of patients. A survey of dialysis patients in 2016 showed that 50.2% of new dialysis patients had DM nephropathy as the cause of end-stage renal disease. The proportion of patients receiving hemodialysis (HD) for more than 5 years was 38% in DM patients and 51% in non-DM patients. The mean pulse pressure in DM HD patients was 71.5 mmHg, compared with 62.6 mmHg in non-DM patients. The proportion of DM patients with native vessel arteriovenous fistula as vascular access for HD was lower than that of non-DM patients (73% vs. 78%). Mean serum creatinine of DM and non-DM dialysis patients was 8.4 mg/dL and 9.5 mg/dL respectively. As vascular access of the DM HD patients was poor, the dialysis adequacy of DM patients was slightly lower than that of non-DM patients. The 5-year survival rate for DM HD patients was 53.9%, which was much lower than that of chronic glomerulonephritis patients (78.2%). The proportion of patients with a full-time job was 17% for DM patients and 28% for non-DM patients.
Introduction
As a result of economic growth over the last 3 decades dietary habits and living environments have greatly changed, resulting in a rapid increase in the prevalence of diabetes mellitus (DM) in Korea [1]. Along with the increasing prevalence of diabetic nephropathy, the total number of patients with end-stage renal disease (ESRD) under maintenance dialysis therapy has increased very rapidly, by approximately 7% to 10% per year [2–4]. The most frequent cause of ESRD in Korea has been DM nephropathy since 1994. DM dialysis patients have more complications and shorter survival duration than non-DM dialysis patients, requiring more medical attention and difficult management in the clinical dialysis setting.
The Korean Society of Nephrology (KSN) has performed a nationwide official survey program on dialysis therapy through an online registry system. As the registry committee of KSN, we analyzed the characteristics of patients in this survey, especially focusing on DM dialysis patients.
Methods of data collection
The internet questionnaire for dialysis patient registration is being run by the KSN year round, and includes dialysis center information, patient personal medical information including vascular access for hemodialysis (HD), dialysis adequacy performance data, erythropoietin (EPO) dose, phosphate binders, laboratory data, and rehabilitation status. The registry program also has a graphic evaluation function of dialysis adequacy including single-pool Kt/V, normalized protein catabolic rate (nPCR), and a peritoneal equilibrium test. Every KSN member can access the dialysis adequacy data of their own dialysis center at any time, which could be of benefit for dialysis prescription. The KSN ESRD registry response rate for patients’ individual data was 53.9% in 2016.
Dialysis data from the KSN ESRD patient registry
Prevalence and incidence of ESRD
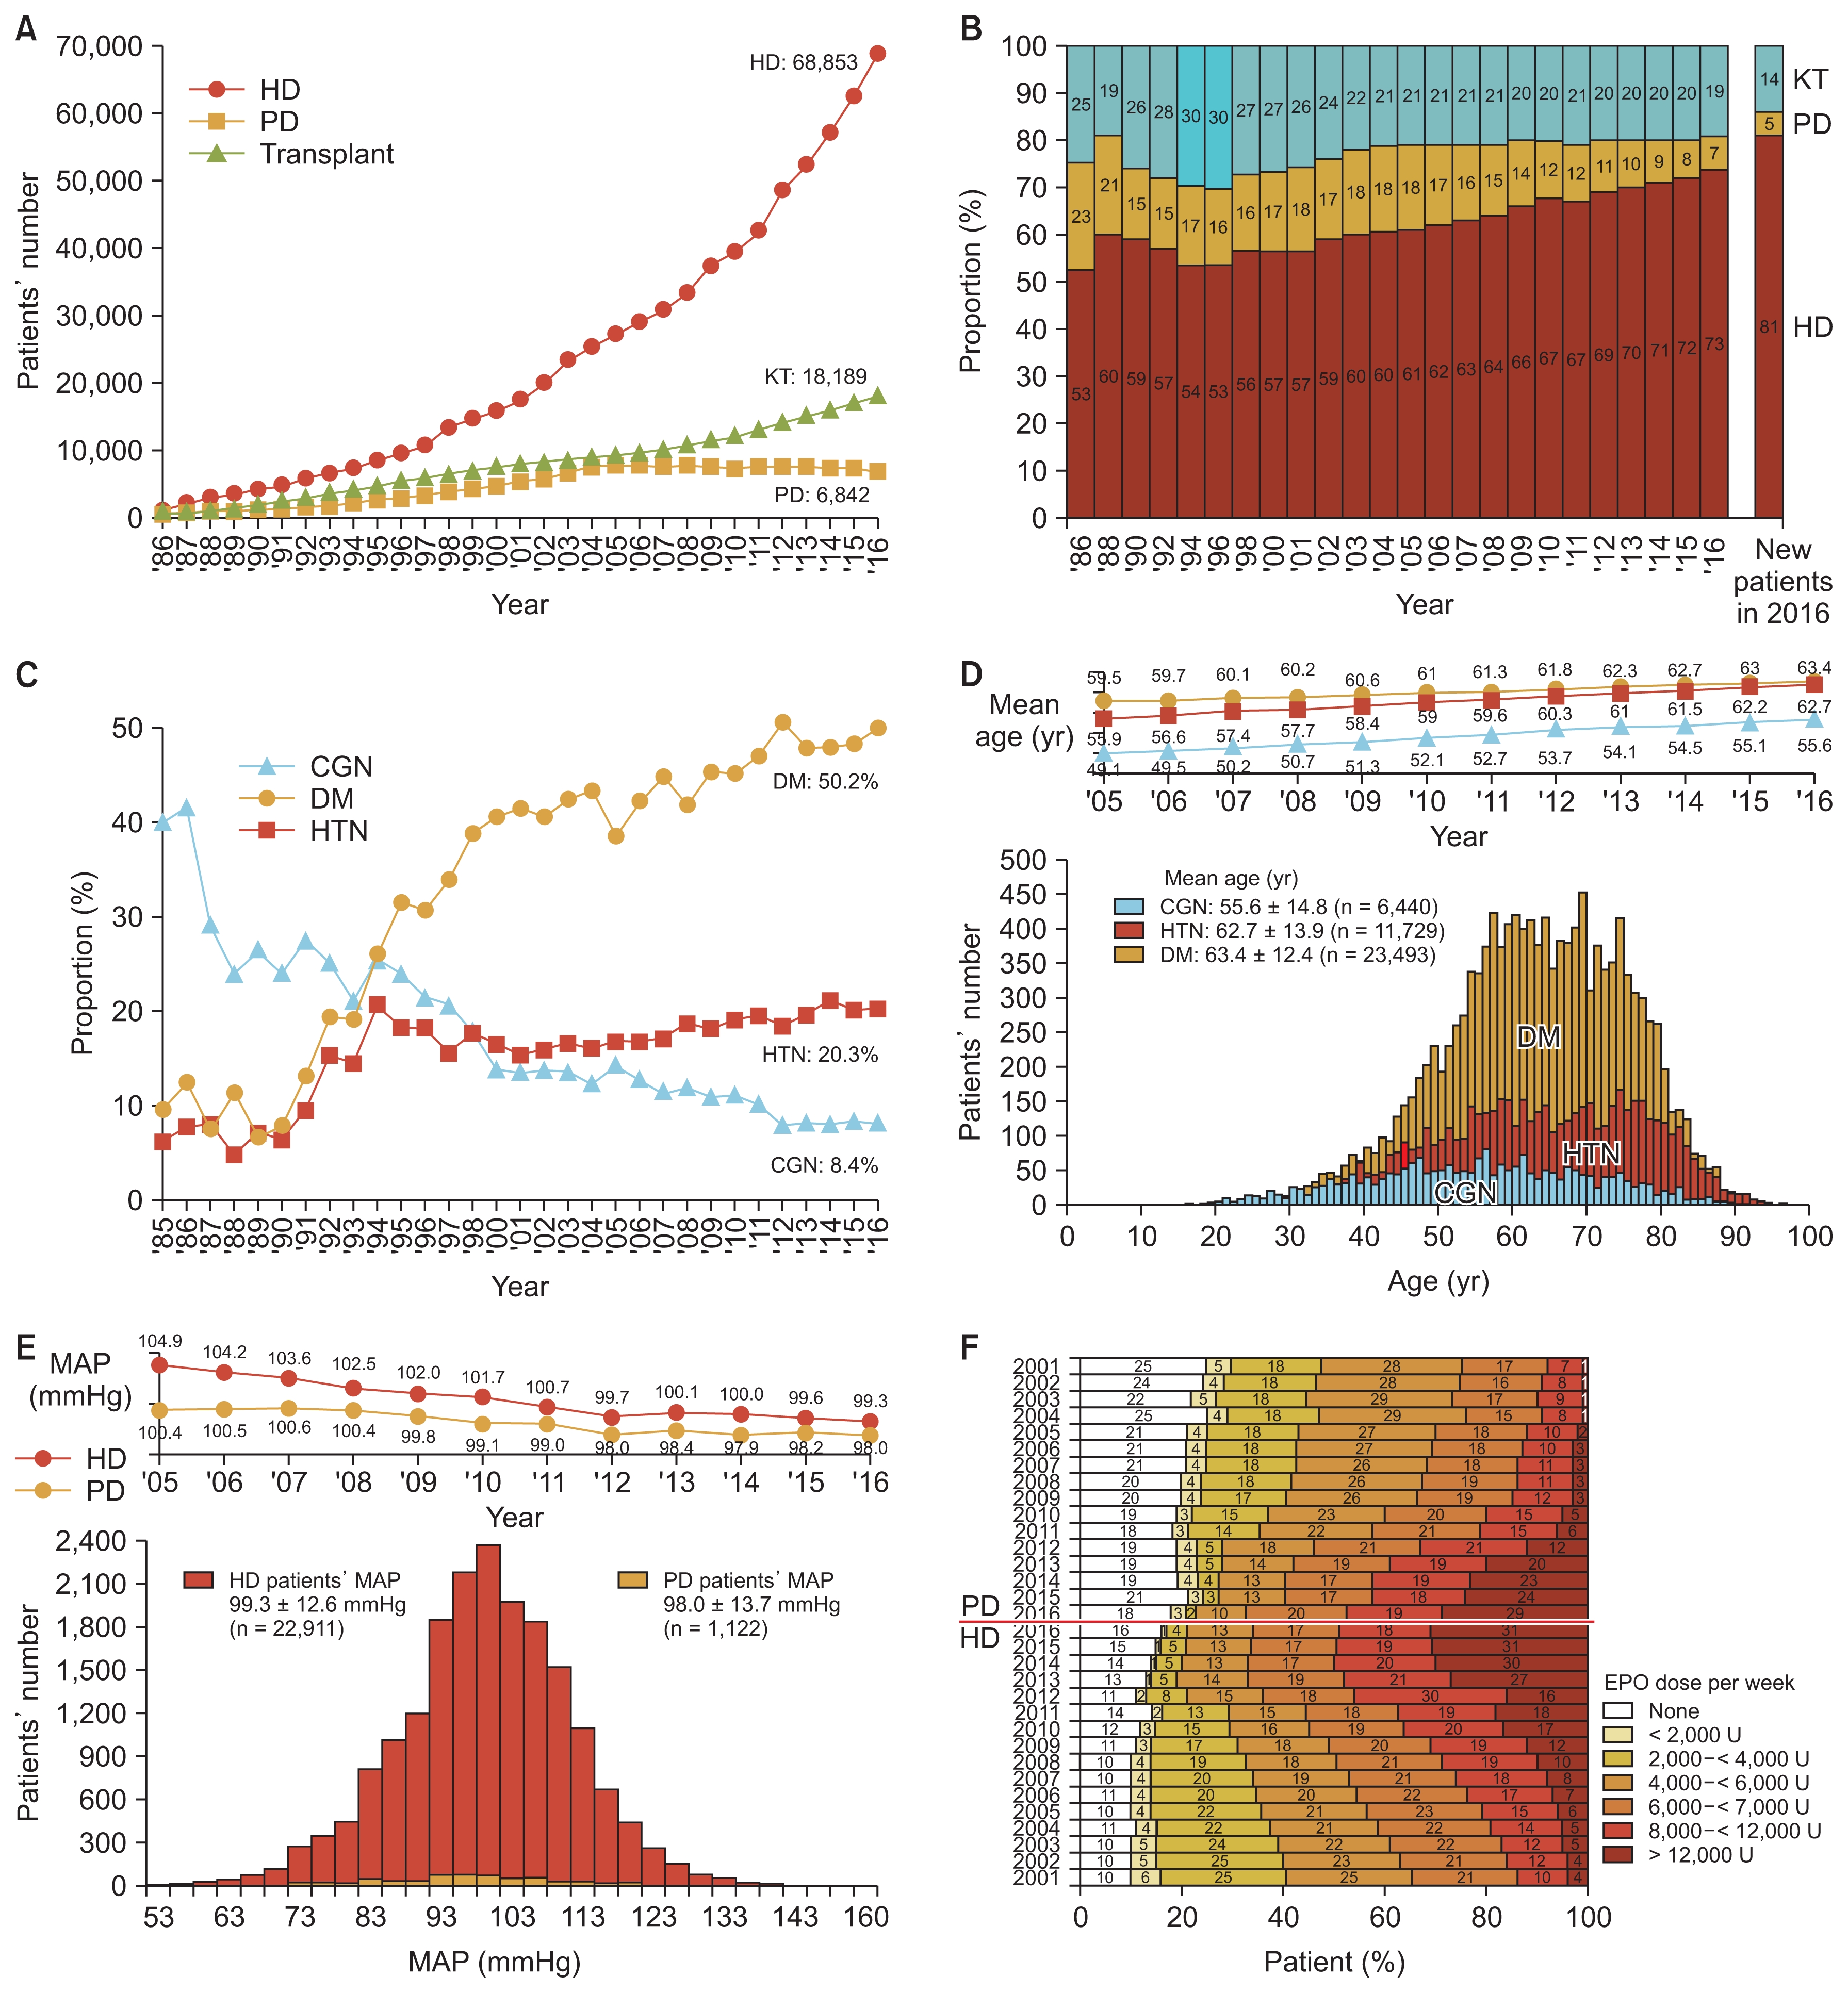
At the end of 2016, the number of ESRD patients in Korea was reported as 93,884, of which 68,853 received HD, 6,842 received peritoneal dialysis (PD), and 18,189 received kidney transplantation (KT) (Fig. 1A). The number of patients per million population (PMP) was 1,332 for HD, 132 for PD, 352 for KT, and 1,816 overall. Also, the proportion of patients with HD, PD, and KT as renal replacement modalities was 73%, 7% and 19%, respectively, at the end of 2016 (Fig. 1B).
Prevalence and characteristics of dialysis in Korea
(A) Number of patients with renal replacement therapy at the end of each year. (B) Proportion of renal replacement modalities, annual prevalence, and incidence. (C) Changes in the proportion of three major causes of end-stage renal disease. (D) Age distribution of dialysis patients according to underlying diseases. (E) Mean arterial pressure of maintenance hemodialysis (HD) and peritoneal dialysis (PD) patients according to year. (F) Percent distribution of erythropoietin doses of HD and PD patients according to year.
CGN, chronic glomerulonephritis; DM, diabetic nephropathy; EPO, erythropoietin; HTN, hypertensive nephrosclerosis; KT, kidney transplantation; MAP, mean arterial pressure.
The number of new patients who initiated dialysis in 2016 was estimated to be 13,835 (13,049 with HD, 786 with PD, overall 268 PMP).
Underlying causes of ESRD
The most common underlying cause of ESRD was DM nephropathy, which accounted for 50.2% of new ESRD patients in 2016, followed by hypertensive nephrosclerosis in 20.3%, chronic glomeruolonephritis in 8.4%, and other causes or unknown cause in 21.1%. The proportion of DM patients in Korea was the highest in the world except for a few city states, according to the international comparison published in the annual data report of Untied State Renal Data System (USRDS) [5]. The DM patient proportion in Korea increased rapidly from 1990 to 2000, and then more slowly from 2000 to 2016 (Fig. 1C).
Dialysis centers and dialysis machines
The number of dialysis centers in Korea was 896, excluding centers that were not KSN members (approximately 50 centers). The number of HD machines was estimated as 24,115 at the end of 2016. The average number of machines per center was about 27 and the number of HD patients per HD machine was 2.9. Approximately 42% of HD patients were under maintenance dialysis therapy at private clinics, 42% were at general hospitals, and 16% were at university hospitals. During the recent couple of years, the proportion of patients at general hospitals increased rapidly due to the increase in dialysis facilities in nursing hospitals, which mostly care for elderly dialysis patients.
Characteristics of dialysis patients
Gender ratio
The gender ratio (male vs. female) was 59% to 41% in HD patients and 55% to 45% in PD patients. The ratio of male to female dialysis patients was much higher than that of the general population. This ratio showed no interval change over 20 years and was quite similar to that in the United States and Japan [5,6].
ABO blood type
The ABO blood type ratio (A:B:AB:O) was 34%:27%:11%:28%, which was the same as in the general population.
Hepatitis B & C
The rate of hepatitis B antigen positivity was 6% and hepatitis C antibody positivity was 4% among HD patients in 2016. The corresponding percentages in PD patients were 6% and 3%, respectively.
Medical insurance status
At the end of 2016, approximately 78% of dialysis patients were covered by national health insurance and 19% were under medical aid programs in Korea. The proportion of patients under medical aid was slowly decreasing.
Age
The average age of overall dialysis patients was 61.2 ± 14.5 years in 2016, and had steadily increased from 55.2 years in 2005. The average age of HD patients and PD patients was 62.3 ± 14.2 and 53.8 ± 14.6 years respectively. The percentage of elderly patients (over 65 years old) was 43.9% in 2016, which represented a large increase from 28% in 2005. The average age of DM dialysis patients, hypertensive nephrosclerosis patients, and chronic glomerulonephritis patients was 63.4 ± 12.4, 62.7 ± 13.9, and 55.6 ± 14.8 years respectively in 2016 (Fig. 1D).
Body mass index
The average body mass index (body weight in kilograms divided by square of height in meters) was 22.4 ± 3.7 kg/m2 for HD patients and 24.2 ± 3.8 kg/m2 for PD patients in 2016. These values had steadily increased from 21.4 and 23.2 kg/m2 in 2005.
Blood pressure
The mean arterial pressure was 99.3 ± 12.6 mmHg for HD patients and 98.0 ± 13.8 mmHg for PD patients in 2016. These values had decreased from 104.9 and 100.4 mmHg respectively in 2005. The mean pulse pressure (the difference between systolic blood pressure and diastolic pressure) of HD patient was 66.7 ± 18.0 mmHg, which was much higher than that of PD patients at 53.5 ± 14.1 mmHg (Fig. 1E).
Duration of dialysis maintenance
About 18% of HD patients were under dialysis therapy for more than 10 years, 27% of HD patients were under therapy for 5 to 10 years, and 12% had less than 1 year of dialysis therapy. In PD patients, only 14% were under dialysis for 10 years or more, suggesting that the dialysis duration of HD patients was longer than that of PD patients (Fig. 1F).
Characteristics of dialysis therapy
Frequency of HD and hemodiafiltration (HDF)
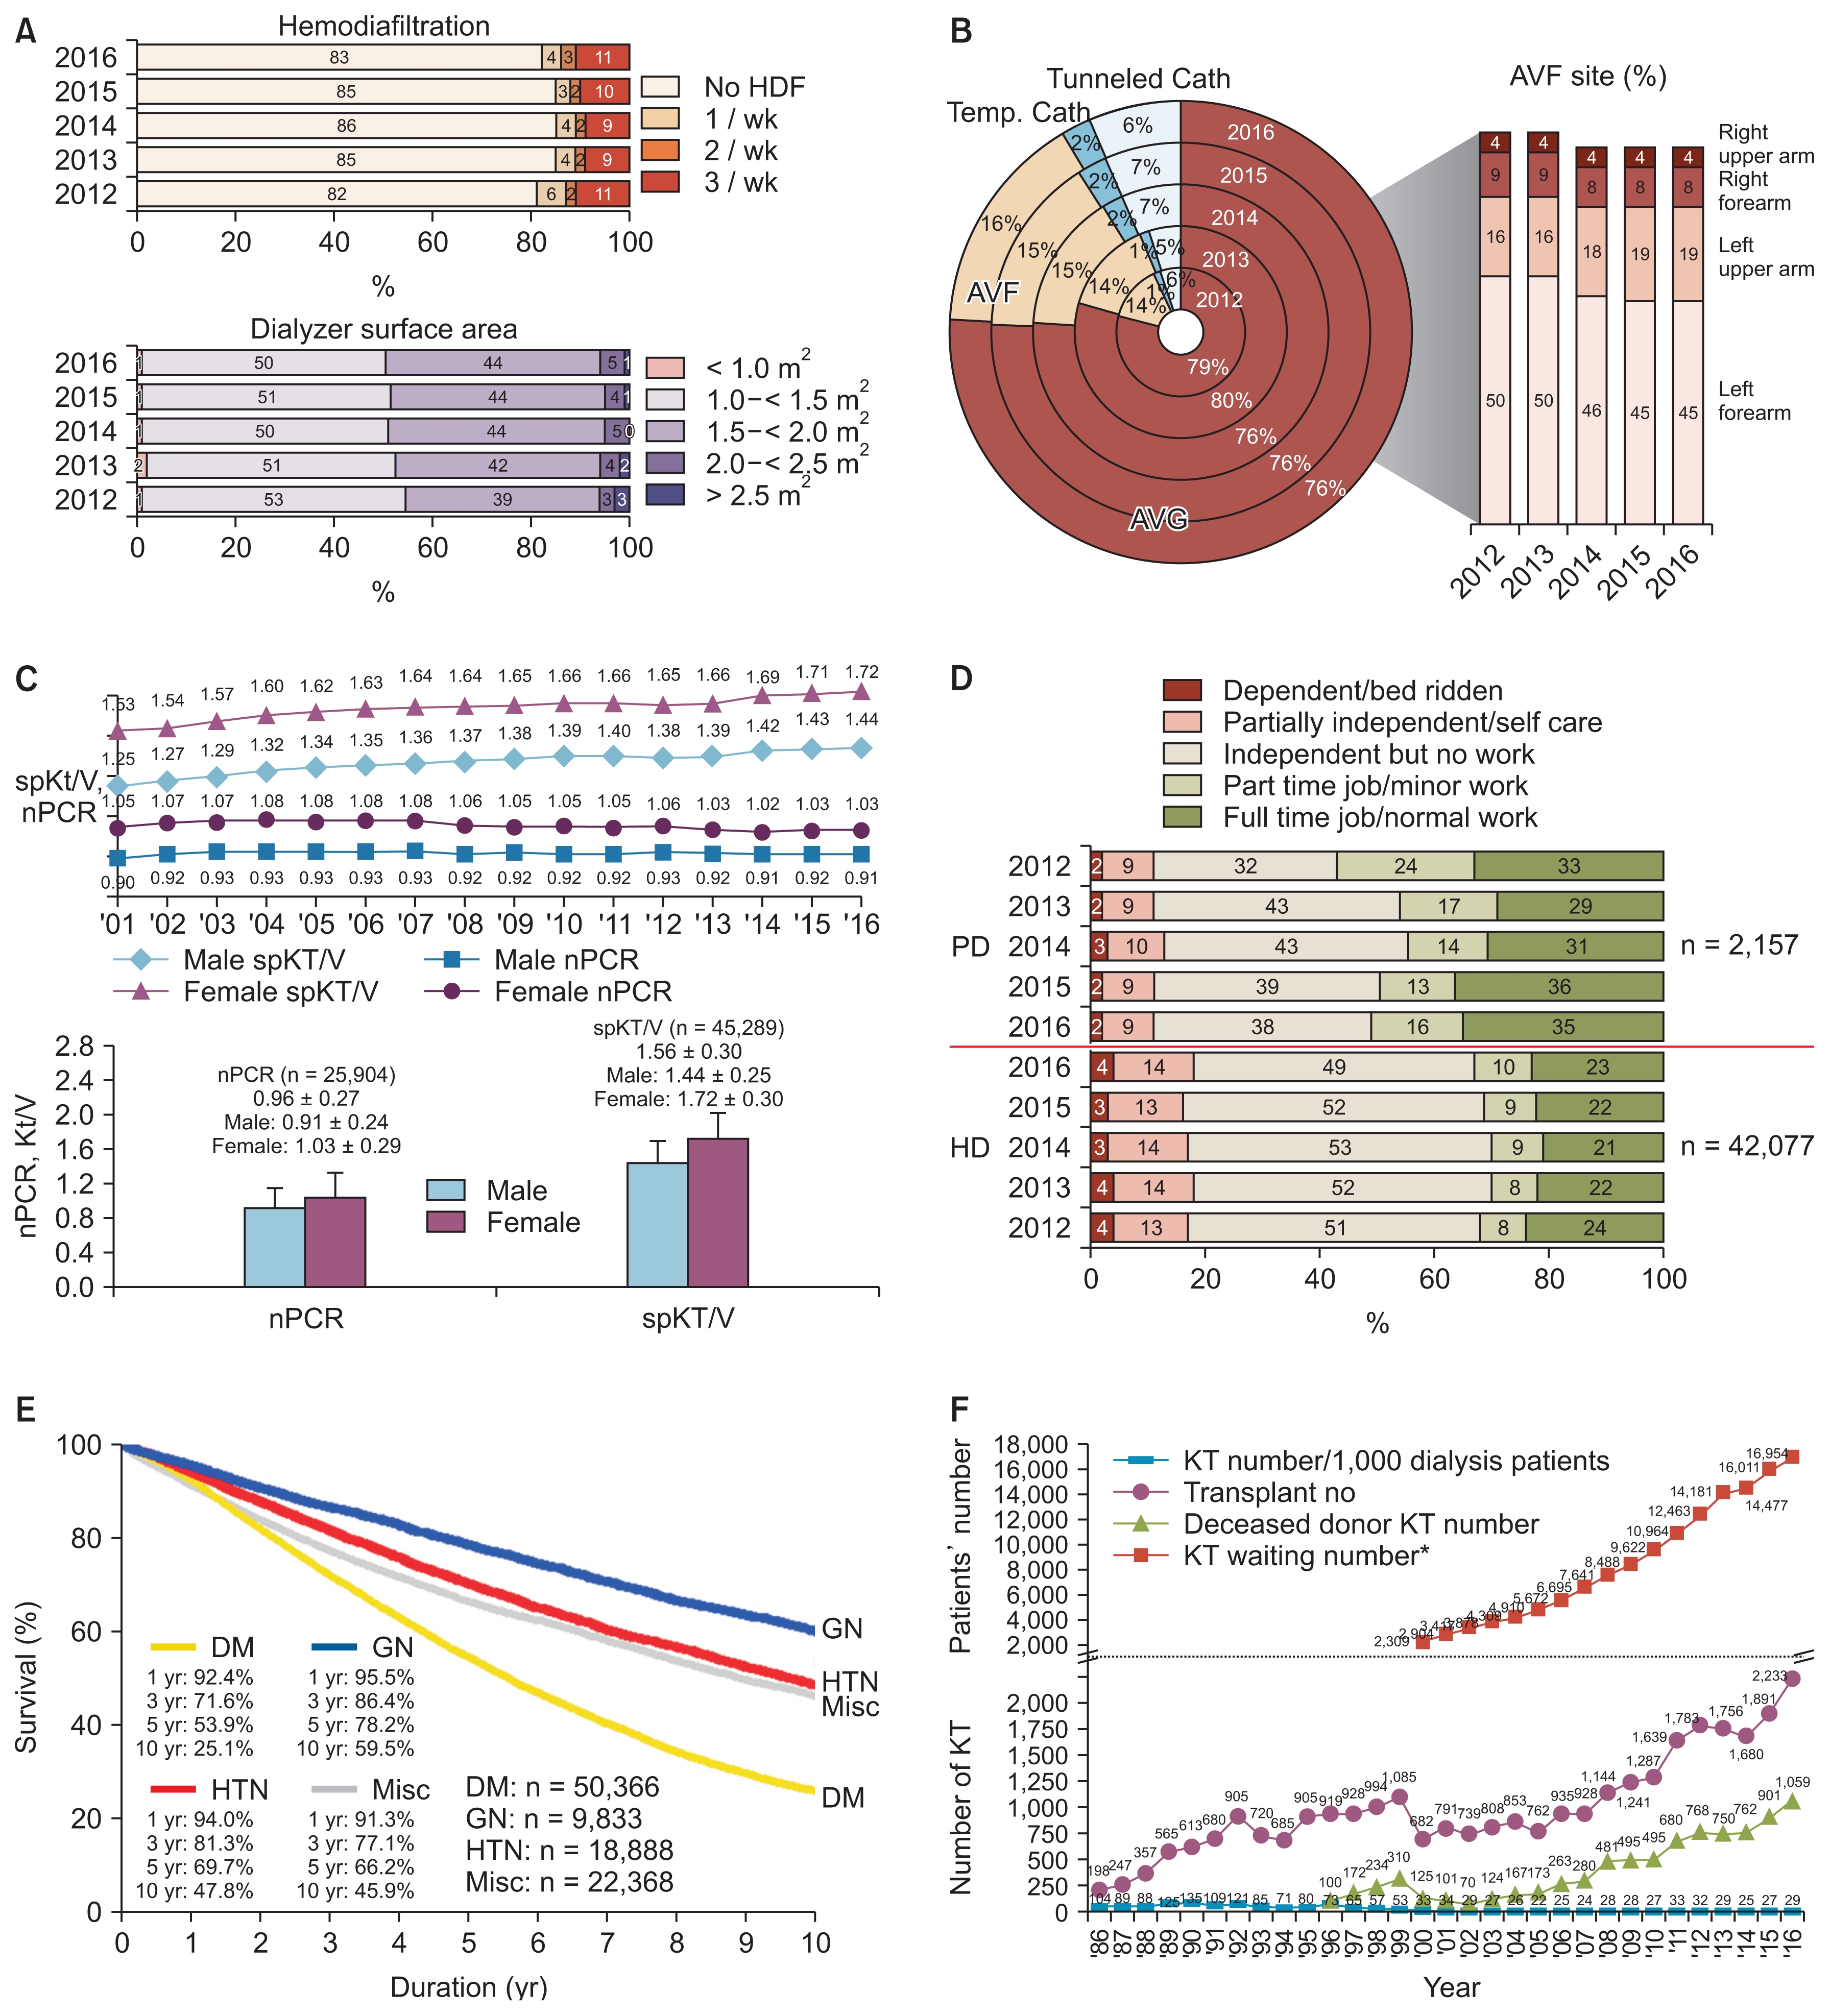
About 91% of HD patients were under a three times per week schedule, and only 7% were under a twice per week schedule. This percentage had minimally changed from 2005 (Fig. 2A). HDF therapy was still not popular, and was applied to only 18% of the whole HD patient population because the cost difference between conventional HD and HDF was still not reimbursed in Korea.
Dialysis characteristics
(A) Percent of patients receiving hemodiafiltration (HDF) and dialyzer membrane surface area. (B) Vascular access for hemodialysis (HD). (C) Dialysis adequacy parameters (normalized protein catabolic rate [nPCR] and single-pool Kt/V [spKt/ V]) of HD patients. (D) Rehabilitation status of HD and peritoneal dialysis (PD) patients. (E) Patient survival rates according to underlying diseases (registered dialysis patients in Korean Society of Nephrology registry since 2001). (F) Annual number of kidney transplantations (KT) in Korea (including data from Korean Network for Organ Sharing). *Number of surviving patients waiting for KT at the end of each year.
AVF, arteriovenous fistula; AVG, arteriovenous graft; Cath, catheter; DM, diabetic nephropathy; GN, chronic glomerulonephritis; HTN, hypertensive nephrosclerosis; Misc, miscellaneous; Temp., temperature.
Dialyzer and dialysate
Although use of a large surface area dialyzer had been slowly increasing, 50% of HD patients received dialysis therapy with a dialyzer smaller than 1.5 m2 in surface area and a dialyzer with surface area of 1.5 to 2.0 m2 was used for 44% of patients (lower panel of Fig. 2A). Bicarbonate dialysate was used for approximately 98% of HD patients, dialysate with glucose was used for 70%, and low calcium dialysate was used for 7% of patients.
Vascular access
Autologous arteriovenous fistula was used in 76% of HD patients, arteriovenous graft shunt was used in 16%, and subcutaneous tunneled catheter was used in 6%. About 45% of HD patients had the arteriovenous fistula on the left forearm and 19% had the fistula on the left upper arm in 2016 (Fig. 2B).
PD catheters
About 39% of PD patients had a swan neck PD catheter and 23% had a swan neck with coiled tip PD catheter in 2016. The PD catheter was inserted by surgical method in 67% and by trochar method in 29% of patients newly starting dialysis in 2016. The break-in period of the new PD catheter was approximately 2 to 3 weeks in 44% of new patients.
PD type and doses
The automated PD program was applied to about 29% of PD patients in 2016; this rate had gradually increased from 5% in 2005. About 51% of PD patients used 8 to 10 L of dialysate per day, and about 15% used more than 10 L.
Anemia and EPO therapy
The mean hemoglobin level of HD patients was 10.4 ± 1.1 g/dL and that of PD patients was 10.3 ± 1.4 g/dL in 2016. Over 12,000 units of EPO per week were injected into 31% of HD patient, but 16% of HD patients had not used EPO. For PD patients, 29% of patients had used over 12,000 units of EPO per week and 18% had no EPO. The units of darbepoietin and methoxy polyethylene glycol-epoetin beta were calculated as EPO units using a conversion constant.
Calcium and phosphorus control
The mean calcium level was 8.88 ± 0.85 mg/dL for HD patients and 8.67 ± 0.90 mg/dL for PD patients in 2016. The mean phosphorus level was 4.83 ± 1.62 mg/dL for HD patients and 5.18 ± 1.52 mg/dL for PD patients. The average parathyroid hormone (PTH) level of HD patients was 220.8 ± 230 pg/mL, but the distribution of PTH level was extremely skewed as a right-tail distribution and the most frequent values were in the range of 30 to 100 pg/mL.
Calcium carbonate or calcium acetate was applied to 63% of HD patients and sevelamer or lanthanum was applied to 13% of HD patients as phosphate binders. For PTH control, about 23% of HD patients were prescribed vitamin D and only 3% of HD patients were prescribed cinacalcet.
Miscellaneous laboratory data were as follows: Average albumin level of HD patients was 3.87 ± 0.47 g/dL and that of PD patients was 3.54 ± 0.54 g/dL in 2016. Average creatinine level of HD patients was 8.96 ± 3.0 mg/dL and that of PD patients was 10.34 ± 3.9 mg/dL. Average total cholesterol level of HD patients was 144 ± 36 mg/dL and that of PD patients was 170 ± 43 mg/dL. Average uric acid level of HD patients was 6.92 ± 1.7 mg/dL and that of PD patients was 6.65 ± 1.7 mg/dL. Average hemoglobin A1c level of DM HD patients was 6.75 ± 1.5% and that of DM PD patients was 6.73 ± 1.6%.
Dialysis adequacy
Overall urea reduction ratio of HD patients was 71.9 ± 7.0% in 2016. The average urea reduction ratio of male HD patients was 69.4 ± 6.4% and that of female patients was 75.5 ± 6.1%; these values had been steadily increasing from 63.6% and 70.4% in males and females respectively in 2001. The nPCR of HD patients had minimal interval change during 2001 to 2016 (from 0.90 to 0.91 in male patients; from 1.05 to 1.03 in female patients), but single-pool Kt/V had steadily increased (from 1.25 to 1.43 in males, from 1.53 to 1.72 in females) (Fig. 2C).
Rehabilitation, co-morbidity, causes of death
At the end of 2016, about 35% of PD patients had a full-time job, compared with only 23% of HD patients. In addition, 18% of HD patients and 11% of PD patients were in a dependent state for daily living or confined to bed (Fig. 2D). The most common co-morbid disease in 2016 was reported as vascular disease, which was present in 50.4% of HD patients and 52.8% of PD patients. Coronary artery disease was involved in 8.2% of HD patients and 7.7% of PD patients. The most common cause of death in HD patients was cardiac (38%), followed by infection (24%). In PD patients, the rate of cardiac death was 39% and that of death due to infection was 26% in 2016.
Survival of dialysis patients
The 5-year patient survival rate of KSN-registered dialysis patients since 2001 was 60.7% in male patients and 63.8% in female patients. The 5-year DM patient survival rate was approximately 53.9%, which was significantly lower than that of patients with underlying chronic glomerulonephritis (78.2%) or hypertensive nephrosclerosis (69.7%) (Fig. 2E).
Kidney transplantation
According to data from the Korean Network for Organ Sharing, the number of KTs in 2016 was 2,233, among which 1,059 were KT from deceased donors. The number of patients waiting for KT was 16,954 at the end of 2016 (Fig. 2F).
Characteristics of DM dialysis patients
The proportion of male DM dialysis patients (60%) was higher than that of non-DM patients (56%) at the end of 2016 (Fig. 3A). The proportion of HD patients (89%) among diabetic ESRD patients was slightly higher than that (87%) among non-DM patients (Fig. 3B). Among the DM HD patients, 27% were under HD therapy at university hospitals, 38% were at general hospitals, and 35% were at private clinics, whereas a higher proportion of non-DM HD patients were at private clinics (28%, 33%, 39% respectively) (Fig. 3C).
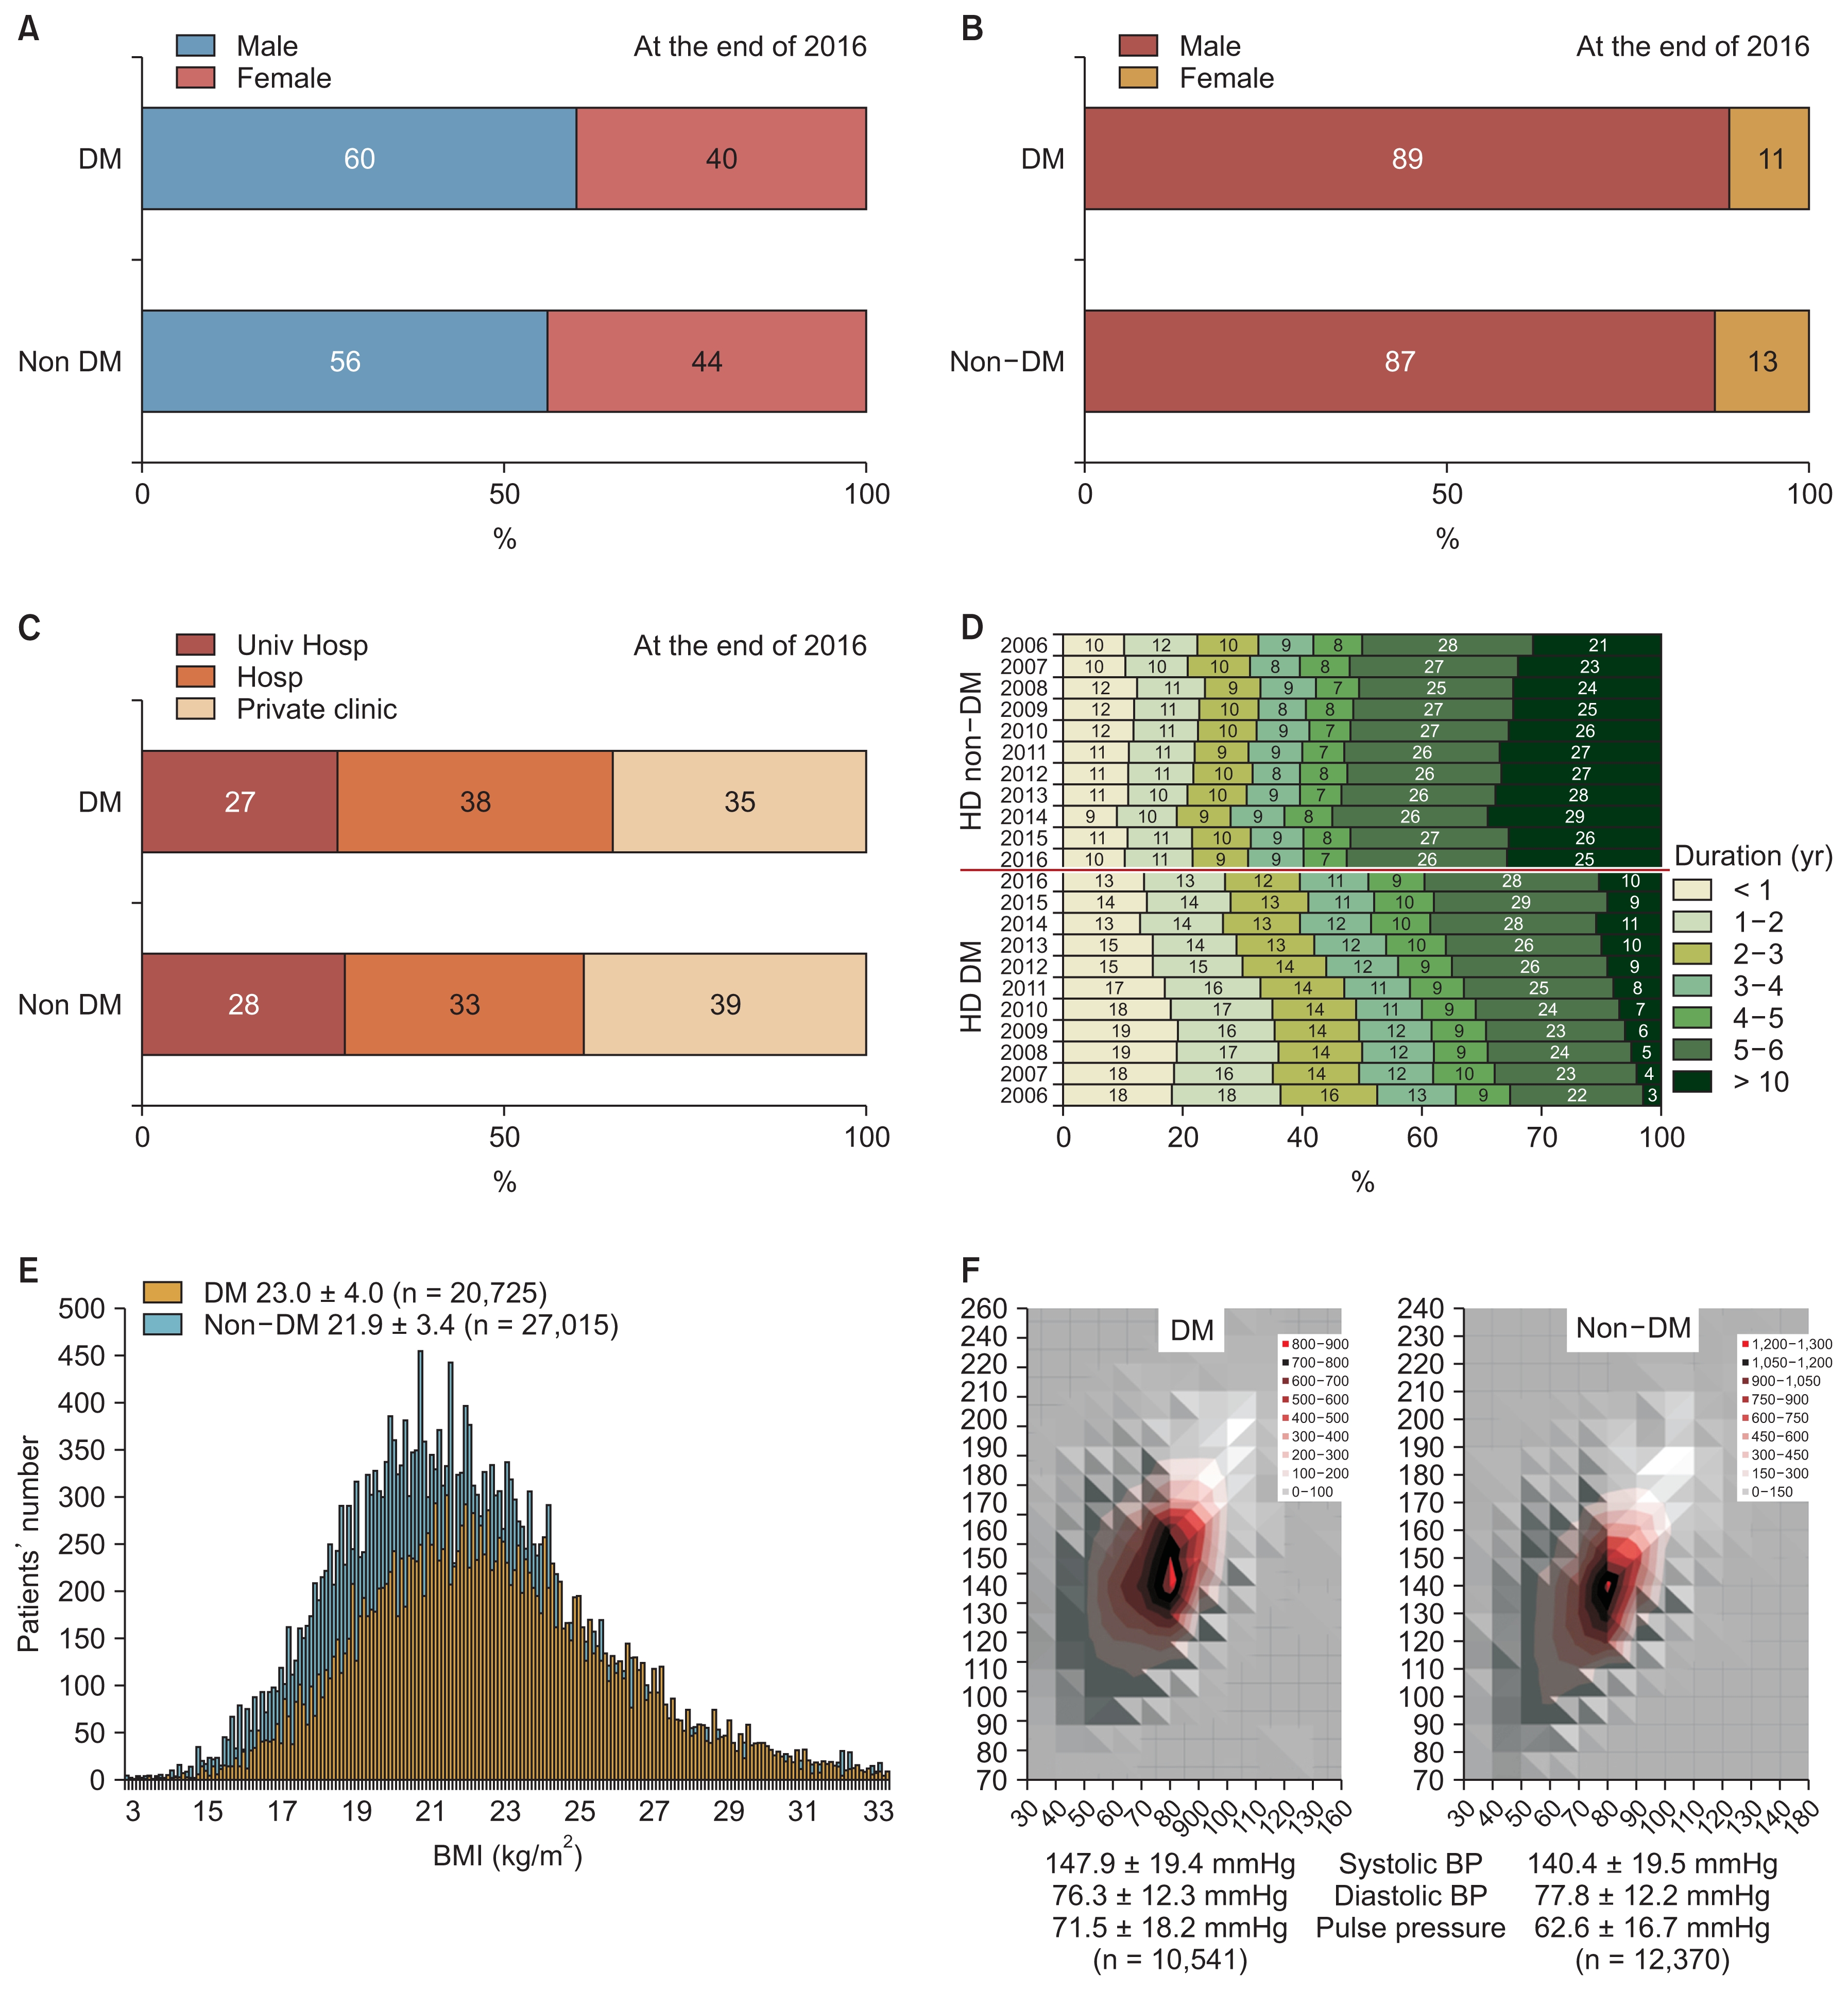
Characteristics of diabetic dialysis patients
(A) Gender ratio of diabetes mellitus (DM) and non-DM dialysis patients. (B) Dialysis modalities of DM dialysis patients compared with non-DM patients. (C) Proportion of DM hemodialysis (HD) patients according to the dialysis center type (university hospital [Univ Hosp], general hospital [Hosp], private clinic). (D) Duration of dialysis maintenance in DM and non-DM patients for HD vs. peritoneal dialysis (PD). (E) Body mass index (BMI) distribution of DM patients compared with non-DM patients. (F) Comparison of blood pressure (BP) between DM and non-DM dialysis patients.
Regarding the duration of HD maintenance, 10% of diabetic HD patients were under HD for more than 10 years, 28% for 5 to 10 years, and 13% for less than 1 year. In comparison, 25% of non-diabetic patients were under HD for more than 10 years, 26% for 5 to 10 years, and 10% for less than 1 year. These data suggest a much longer duration of HD for non-DM patients (Fig. 3D).
Mean body mass index was 23.0 ± 4.0 for DM dialysis patients and 21.9 ± 3.4 for non-DM patients. Mean systolic pressure was 147.9 ± 19.4 mmHg for DM patients and 140.4 ± 19.5 mmHg for non-DM patients (Fig. 3E). The mean pulse pressure of DM patients (71.5 ± 18.2 mmHg) was significantly higher than that of non-DM patients (62.6 ± 16.7 mmHg). The range of diastolic blood pressure of DM patients was slightly wider than that of non-DM patients (Fig. 3F).
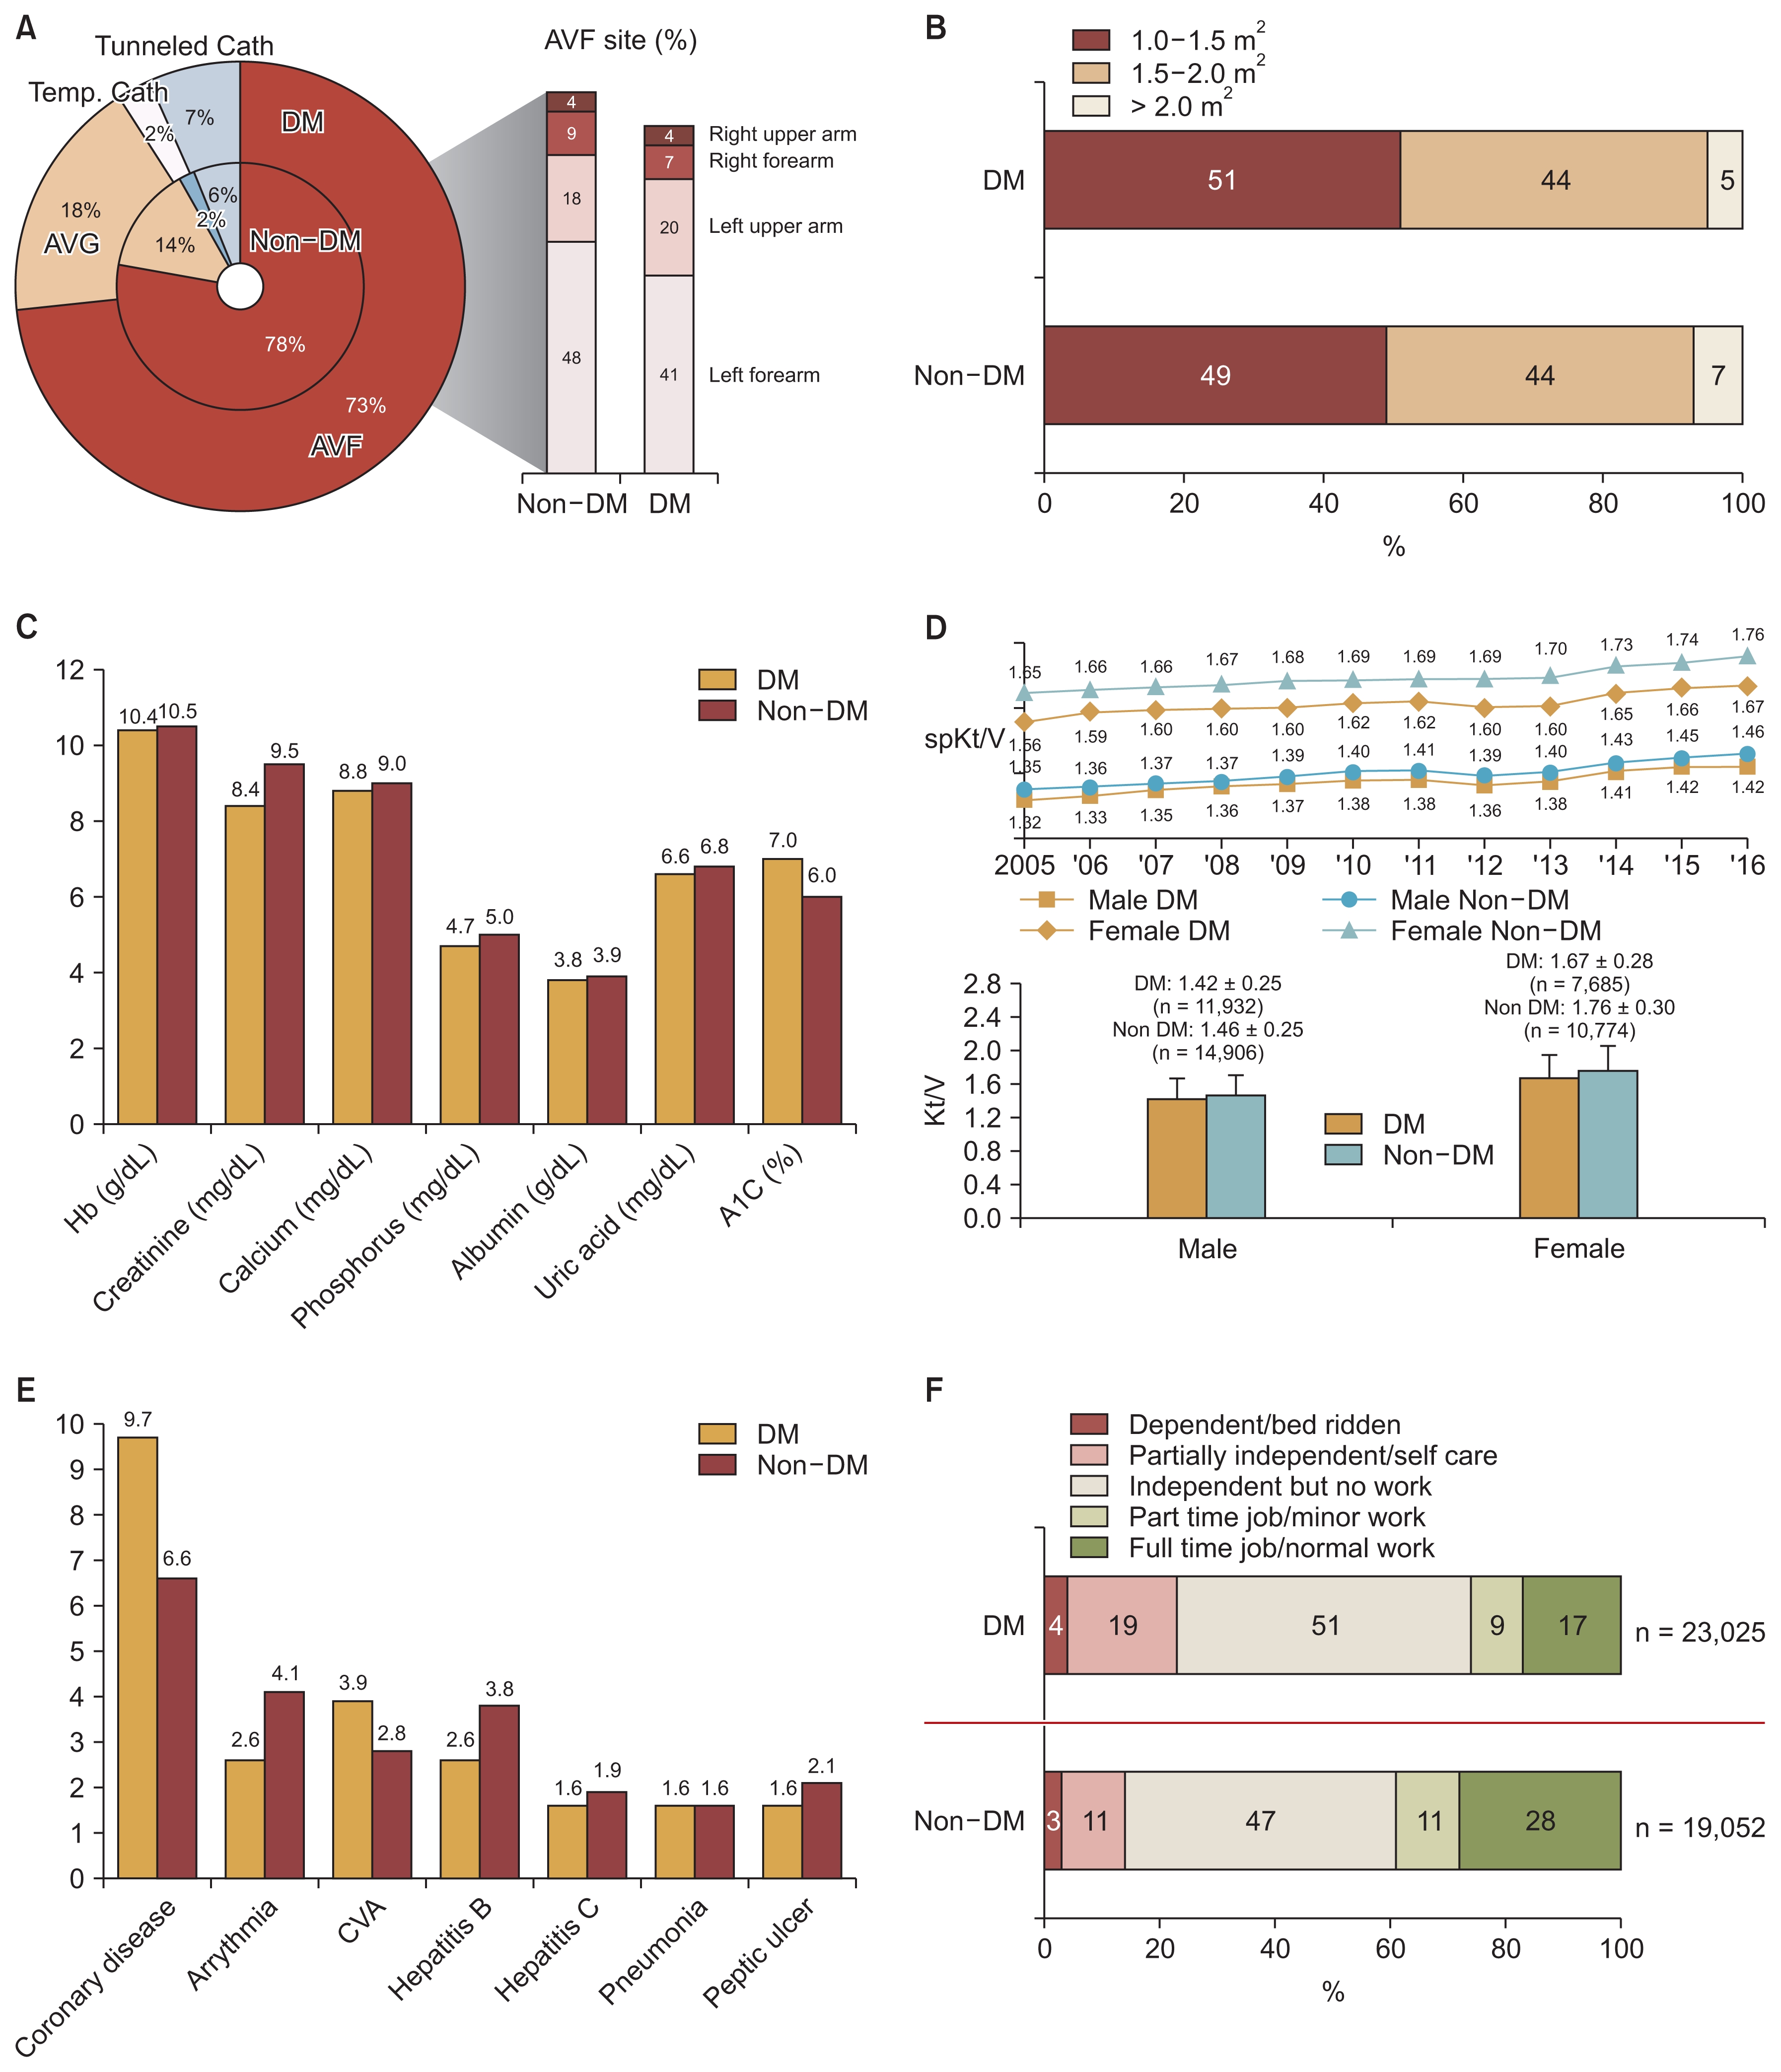
The proportion of DM HD patients with intravenous catheter was 9% (subcutaneous tunneled catheter 7%, temporary catheter 2%), which was higher than that of non-DM dialysis patients (8%). The proportion of DM HD patients with native vessel arteriovenous fistula as vascular access for HD was lower than that of non-DM HD patients (73% vs. 78%), therefore the proportion of DM patients with arteriovenous graft was higher (18%) than that of non-DM patients (14%). Regarding the site of arteriovenous fistula, left forearm was the most commonly used site for DM patients (41%) but its use was less frequent than for non-DM patients (48%) (Fig. 4A). A dialyzer with surface area of 1.0 to 1.5 m2 was most frequently used for DM HD patients (51%), whereas dialyzers with larger surface area were used for non-DM patients (1.5 to 2.0 m2, 49%; > 2.0 m2, 7%) (Fig. 4B). In the laboratory data, the mean serum creatinine level of DM patients was significantly lower than that of non-DM patients (8.4 vs. 9.5 mg/dL) and hemoglobin, calcium, phosphorus, albumin and uric acid levels of DM patients also were slightly lower than those of non-DM dialysis patients (10.4 vs. 10.5 g/dL, 8.8 vs. 9.0 mg/dL, 4.7 vs. 5.0 mg/dL, 3.8 vs. 3.9 g/dL, 6.6 vs. 6.8 mg/dL, respectively). The mean hemoglobin A1c level was 7.0% (Fig. 4C).
Characteristics of elderly dialysis patients
(A) Vascular access of diabetes mellitus (DM) hemodialysis (HD) patients compared with non-DM HD patients. (B) Dialyzer surface area of DM and non-DM HD patients. (C) Laboratory data of DM and non-DM dialysis patients. (D) HD adequacy comparison of DM and non-DM patients according to year. (E) Comparison of comorbid conditions in DM and non-DM dialysis patients. (F) Rehabilitation status of DM and non-DM dialysis patients.
AVF, arteriovenous fistula; AVG, arteriovenous graft; Cath, catheter; CVA, cerebrovascular accident; Hb, hemoglobin; spKt/V; single-pool Kt/V; Temp., temperature.
Single-pool Kt/V of DM HD patients was higher than that of non-DM patients (male, 1.42 ± 0.25 vs. 1.45 ± 0.25; female, 1.67 ± 0.28 vs. 1.76 ± 0.30, respectively) (Fig. 4D).
Coronary disease and cerebrovascular diseases were the most frequent co-morbid diseases in DM dialysis patients (9.7% and 3.9%), and were present at much higher rates than in young patients (Fig. 4E). As expected based on the low survival rate of DM patients (Fig. 2E), the rehabilitation rate of DM patients was much lower than that of non-DM patients. Only 17% of DM dialysis patients had a full-time job compared with 28% of non-DM dialysis patients. In addition, 23% of DM patients were dependent or partially dependent compared with 14% of non-DM patients (Fig. 4F).
Discussion
DM is one of the most problematic diseases, together with hypertension and cancer. DM is an underlying cause of cardiovascular diseases such as ischemic heart disease and stroke, which are the most common cause of death in Korea. The prevalence of DM among adults 30 years or older in Korea is 13.7% (4.8 million individuals), and the prevalence of diabetic nephropathy (albuminuria or decreased estimated glomerular filtration rate) is 30.3%, according to the diabetes fact sheet 2016 from the Korean Diabetes Association [1]. This high prevalence of DM is likely to lead to an increase in the number of patients with ESRD; this pattern has been observed worldwide, especially in Asian countries [5,6]. Koreas has the fastest increase in the number of patients with ESRD in the world, and the proportion of patients with diabetes among new ESRD patients is also the highest according to a United States Renal Data System report [5].
In the 2016 report of the KSN ESRD registry, the proportion of patients with DM nephropathy among new ESRD patients was 50.2%, which was the highest rate during recent decades, and the mean age of dialysis patients had also steadily increased to 61.2 years. As expected, the vascular access conditions were poor (Fig. 4A) and the dialysis adequacy of DM patients was slightly lower than that of non-DM patients. Laboratory data and dialysis adequacy were not significantly different between DM and non-DM patients, but large differences between DM patients vs. non-DM patients were observed for survival rate (Fig. 2E) and rehabilitation rate (Fig. 4F). These differences were probably caused by complications of diabetes (Fig. 4E), such as coronary disease, arrhythmia, and cerebrovascular accident. Those co-morbidities were probably not directly related to dialysis therapy, but instead associated with the original diabetic complication.
In the actual clinical dialysis setting, more meticulous medical care is now needed due to the increased proportions of diabetic patients and elderly patients. For DM HD patients, control of water intake according to hyper-glycemia is more difficult. As a result, the inter-dialytic body weight gain of DM dialysis patients is usually large and the main cause of intra-dialytic hypotension, in addition to autonomic neuropathy. Glucose control with insulin is also confusing due to the alternative days for therapy with HD, and the dose of insulin should be modified according to the HD schedule. DM ESRD patients with PD also are confused about glucose control due to the high dose requirement of insulin for glucose-based peritoneal dialysate. Furthermore, DM ESRD patients usually have chronic complications of diabetes such as ischemic heart disease, diabetic neuropathy, retinopathy, and diabetic foot disease. For these DM dialysis patients, detailed dialysis guidelines such as target blood pressure, hemoglobin, glucose level, and EPO therapy should be established based on evidence from the ESRD registry data.
More detailed data of the KSN ESRD registry are available through the KSN web page [7].
Conclusion
As the KSN ESRD patient registration committee, we have continuously performed ESRD patient registration and present the data for 2016 in this report, in particular for DM dialysis patients. The number of ESRD patients and the proportion of patients with DM have rapidly increased during the last decade in Korea. The survival rate and rehabilitation rate of DM dialysis patients were significantly lower than those of non-DM patients. For DM dialysis patients, detailed evidence-based dialysis guidelines should be established using ESRD registry data.
Acknowledgments
The ESRD Registry Committee of the Korean Society of Nephrology thanks all of the medical doctors and nurses of dialysis centers in Korea for participating in this registry.
Notes
Conflicts of interest
All authors have no conflicts of interest to declare.