Ferric carboxymaltose versus ferric gluconate in hemodialysis patients: reduction of erythropoietin dose in 4 years of follow-up
Article information

Abstract
Background
Ferric carboxymaltose (FCM) is a parenteral, dextran-free iron formulation designed to overcome the limitations of existing iron preparations. The main aim of this study was to retrospectively examine results obtained from a long period of FCM therapy in hemodialysis patients who have been previously treated with ferric gluconate (FX). Markers of iron metabolism, erythropoietin (EPO) doses, and effects on anemic status have been analysed.
Methods
The study was performed with a follow up period of 4 years, when patients were treated before with FX and then switched to FCM. A total of 25 patients were included in the study.
Results
FCM increased transferrin saturation (TSAT) levels by 11.9% (P < 0.001) with respect to FX. Events of TSAT less than 20% were reduced during FCM. The monthly dose of EPO was reduced in the FCM period (-6,404.1 international unit [IU]; 95% confidence interval, -10,643.5 IU; -2,164.6 IU; P = 0.003), as well as the erythropoietin resistance index (P = 0.004). During the period with FCM, ferritin levels were higher than during FX (P < 0.001), while transferrin was reduced (P = 0.001).
Conclusion
During FCM treatment, minor doses of EPO were administered if compared to those delivered during FX therapy. Stable and on target levels of hemoglobin were maintained with better control of anemia through high levels of ferritin and TSAT.
Introduction
Iron deficiency is common in the non-dialysis nephropathic population, and it is even more pronounced in patients on hemodialysis (HD). Intravenous (IV) iron therapy is recommended in these patients, due to the frequent blood loss associated with dialysis machine use and inability to achieve optimum outcomes with oral iron [1]. Moreover, in HD patients, a functional iron deficiency coexists, characterized by unsuccessful mobilization of iron from stores. This is associated with normal or high ferritin levels and low transferrin saturation (TSAT) values, indicating limited transport of iron to the erythron for erythropoiesis. The inflammatory state is associated with increased serum hepcidin, which blocks iron absorption from the duodenum and iron release from the liver (main iron store) and macrophages, thereby interrupting iron recycling [2]. The decreased availability of iron for erythropoiesis aggravates the existing anemia of chronic disease (functional iron deficiency) in HD patients.
Currently, available IV iron agents vary in indication, dosing regimens, and safety profiles, and there are concerns about related anaphylactic reactions due to dextran-containing iron formulations. Current IV iron formulations include high or low molecular weight iron dextran, ferric gluconate (FX), iron sucrose, and ferric carboxymaltose (FCM). In particular, FCM (Ferinject®; Vifor (International) Inc., St Gallen, Switzerland) is a next-generation parenteral, dextran-free iron formulation designed to overcome the limitations of existing IV iron preparations.
IV iron agents share the same core chemistry, but they differ in the size of the core and the identity and density of the surrounding carbohydrate. These differences determine pharmacologic and biologic effects, such as clearance rate after injection, iron release rate, bioactivity, and maximum tolerated dose. Whereas FX is structurally based on a weak complex of carbohydrate shell, which is rapidly degraded in blood, FCM is characterized by a more stable structure. FCM is partially broken after administration in the blood, inducing a gradual release of iron and avoiding precocious TSAT (Fig. 1).
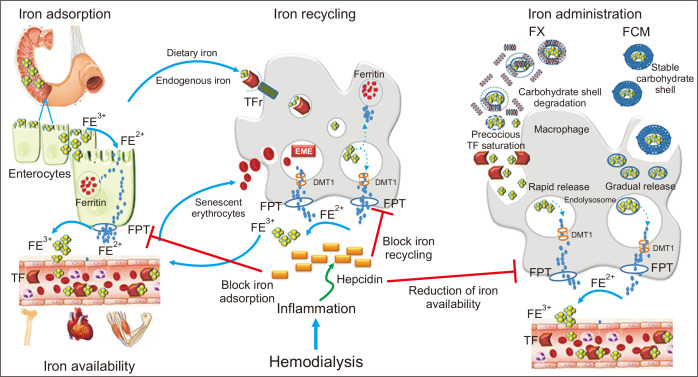
Endogenous iron metabolism and iron administration.
Dietary Fe3+ is first reduced to Fe2+, which then enters the intestinal cell where it is either stored as ferritin or it leaves the cell via ferroportin (FPT). Macrophages catch iron from endogenous sources, such as dietary iron via enterocytes and senescent erythrocytes, release Fe3+ through FPT, and play a pivotal role in iron recycling. Ferric gluconate (FX) is structurally characterized by a weak complex of carbohydrate shell that is rapidly degraded in blood, whereas ferric carboxymaltose (FCM) is characterized by a more stable carbohydrate shell that is only partially broken after administration in blood. The carbohydrate shell is completely broken inside macrophages, and the iron core is included in endolysosomes. This process results in gradual and more stable release of iron into the blood, avoiding precocious transferrin saturation (TSAT). Hepcidin, a peptide hormone synthesized by liver cells, negatively regulates all these processes, blocking FPT. This figure is original and entirely realized by the authors.
DMT 1, divalent metal transporter 1; TF, transferrin; TFr, TF receptor.
Studies on pharmacodynamics and pharmacokinetics with radio-labelled FCM demonstrated iron uptake by the reticulo-endothelial system (RES) and delivery to the endogeneous transport system for heme synthesis in new erythrocytes with minimal release of free iron [3]. Considering the RES as a peripheral compartment, a 2-compartment model was the best fit for FCM, which may be taken up by hepatocytes or return to circulation as intact complexes [4,5]. No information is available on the pharmacokinetics of FX at dosage of > 125 mg [6]. Although FCM is an attractive option in terms of both efficacy and safety, widespread use of this formulation is not yet supported by a high level of evidence. Clinical trials of FCM versus comparators conducted in over 10,000 patients with iron deficiency anemia and associated with a variety of medical conditions have shown improvements in hemoglobin (Hb) levels and replenishment of depleted iron stores [7,8].
Several studies have been also conducted in the nephropathic population, but the cohort was often affected by chronic kidney disease not on dialysis. The dialytic population was enrolled to analyze the safety and effects of the drug, but there are no data about its superiority versus other iron IV formulations [9-11].
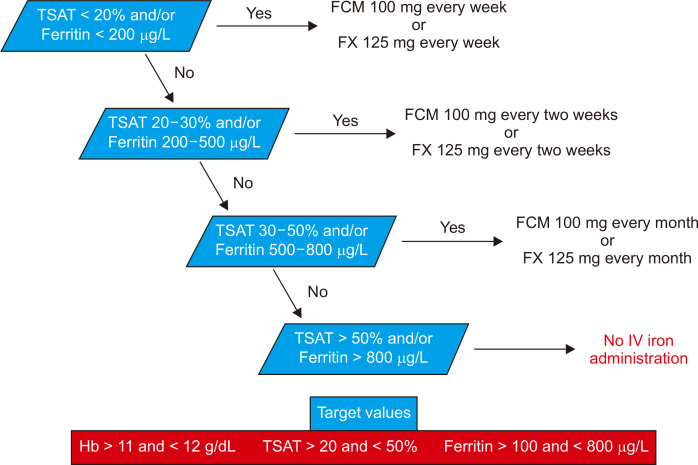
The most appropriate IV iron-replacement regimen in adults undergoing dialysis is unknown, which has resulted in different local, national, and international recommendations and practices. Kidney Diseases Outcomes Quality Initiative (KDOQI) recommended IV iron to maintain Hb between 11 and 12 g/dL, ferritin between 100 and 800 ng/mL, and TSAT between 20% and 50% [12].
Observational studies have raised concern that monthly doses of 300 mg or more of IV iron are associated with poor outcomes. Recently, a multicenter, open-label trial showed that among HD patients, the use of proactively administered high-dose IV iron resulted in a significantly lower dose of erythropoietin (EPO) and a lower incidence of blood transfusion than the use of a low-dose regimen administered reactively. Mortality and incidence of nonfatal cardiovascular events and infections did not differ significantly between the two treatment groups [13].
The main aim of this study was to retrospectively examine results obtained from a long period of FCM therapy in HD patients who were previously treated with FX. Markers of iron metabolism, variation of EPO administration, and effects on anemic status were analyzed. FCM was hypothesized to be superior to FX.
Methods
Study design
A retrospective study was performed with a follow up period of 4 years. The enrollment phase started in January 2014 with patients treated with IV ferric gluconate (Ferlixit, FX; Aventis Pharma, Milan, Italy) in the past for ≥ 6 months. This phase lasted for 24 months until December 2015, when FX was discontinued. In this period, 125 mg of gluconate iron was administered per week. During January 2016, a wash out period was performed. From February 2016 to February 2018, patients were treated with FCM.
Patients received an undiluted dose of FCM directly into the venous line of the dialyzer ~30 to 60 minutes into the dialysis session. Hb, TSAT, and ferritin levels were evaluated in accordance with the KDOQI guidelines [14]. IV iron therapy was initiated when there was an absolute iron deficiency associated with the EPO dose, defined by TSAT < 20% or ferritin < 200 ng/mL. During FX treatment, all patients required 125 mg per week to maintain adequate iron metabolism. Conversely, patients received 100 mg of FCM per week after the switch.
Fig. 2 demonstrates the applied algorithm for maintenance therapy according to Hb, TSAT, and ferritin levels.
Flow diagram of patient selection.
FCM, ferric carboxymaltose; FX, ferric gluconate; Hb, hemoglobin; IV, intravenous; TSAT, transferrin saturation.
Patients and baseline data
A total of 64 patients who were receiving maintenance HD as outpatients at the Papardo Hospital, Nephrology and Dialysis Unit, Messina, Italy, were screened.
All patients received HD three times a week for 4 hours each. Patients were at least 18 years old, were on uninterrupted HD treatment for a period of at least 6 months before the switch from FX to FCM, and continued the treatment for at least 12 months.
Patients with any malignancy diagnosed in the five years prior to the investigational period were excluded. Moreover, other exclusion criteria were hospitalization during the 6 months prior to enrollment, hospitalization during the study period, history of gastro-intestinal bleeding, history of hemotransfusion, Hb concentration more than 12.0 g/dL, known hypersensitivity to any component of FCM, anemia other than that due to iron and EPO deficiency, evidence of active infection (including hepatitis B, hepatitis C, or human immunodeficiency virus), concomitant severe liver or cardiovascular diseases, and iron storage disorders.
According to the abovementioned criteria, 25 patients were included in the study (Fig. 3).

Study design: inclusion and exclusion criteria, enrollment, and cross over phase.
FCM, ferric carboxymaltose; FX, ferric gluconate.
The study was approved by the Ethics Committee for Medical Research of the University Hospital of Messina, Italy and carried out in accordance with the Declaration of Helsinki. All patients provided informed consent permitting data sampling and analysis at the time of initiating dialysis therapy.
Blood collection and biochemical data
Data were measured once per month, and blood sampling was performed at the beginning of each week when initiating HD.
TSAT was calculated according to the following formula: (serum iron/serum transferrin) × 70.9.
The erythropoietin resistance index (ERI) was defined as the weekly weight-adjusted EPO dose (U/kg/wk) divided by the Hb level (g/dL). ERI was calculated monthly to investigate resistance to EPO treatment [15].
Statistical methods
Justification of sample size
According to previously available data, the EPO dose administered to HD patients was about 30,000 U with variability (standard deviation) of 11,000 U. In a pilot sample, the correlation between mean EPO doses in two different periods 6 months apart was quite high (r = 0.81). For caution, we assumed a slightly lower correlation (r = 0.75), thus making the a priori assumption that about 50% (49%) of variance in EPO dose at T1 can be explained by the EPO dose used 6 months before T0. Considering the paired design and the within-subjects planned analysis, we computed that a sample of 21 patients allows reaching a power of 80% to detect a statistically significant (with two-tailed alpha level set at 0.05) difference between treatments of 5,000 U. This difference was considered the “minimal relevant difference” in the sense that lower values are deemed unimportant in terms of pharmaeconomics.
Statistical analysis
The retrospective study was designed as a paired two-period study in which each patient was individually controlled, but without the possibility of a further control group.
According to the “long” structure of the dataset (several rows for each patient corresponding to monthly visits), the first analysis was a General Estimating Equation (GEE) model with “Patient” as a random-subjects variable, “Time” and “Treatment” as repeated variables within patients, and all measures of interest as dependent variables. Moreover, simpler statistical analyses were also performed by applying paired t tests and the Wilcoxon signed-rank nonparametric test. For this purpose, median and interquartile range was computed for every parameter and for each patient and treatment period.
Multiple regression analyses were performed by constructing a model including all univariate correlates of Hb levels to assess independent relationships. Data were expressed as partial correlation coefficients (β) and P values.
Results
Patients baseline characteristics
The main baseline characteristics of the study cohort are summarized in Table 1. The mean age of patients was 62.4 ± 19.6 years. The median value for dialysis vintage was 77 months (range 52-179). The primary disease was diabetic nephropathy in 10 patients (40.0%), nephrosclerosis in 8 patients (32.0%), chronic glomerulonephritis in 4 patients (16.0%), and other causes in the 3 remaining patients (12.0%).

Baseline characteristics of study cohort at enrollment
Dialysis sessions lost 4 hours with a mean weekly spKt/V of 1.46 ± 0.3. The mean Hb, Fe, ferritin, and TSAT were 11.73 ± 1.4 g/dL, 91.9 ± 43.2 μg/dL, 522.5 (378-750) ng/mL, and 21.3 ± 8.9, respectively. The mean monthly EPO dose was 29,666.66 ± 20,731.54 IU.
Comparison between FCM and FX treatment
The main findings are reported in Table 2. No side effects were recorded during the entire study period. The monthly dose of EPO was clearly reduced in the FCM period (-6,404.1; 95% confidence interval [CI], -10,643.5 to -2,164.6; P = 0.003) compared to EPO doses delivered to the FX group. Moreover, patients receiving FCM were characterized by higher levels of iron (+8.0; 95% CI, -1.3 to +17.2; P = 0.087) and ferritin (+162.4; 95% CI, +79.5 to +245.2; P < 0.001) than during FX, while transferrin values were reduced (-19.8; 95% CI, -32.2 to -7.4; P = 0.001). Furthermore, FCM increased TSAT levels of 11.9% (95% CI, +7.5 to +16.3; P < 0.001) with respect to FX.

Comparison between FCM and FX treatment
No differences were recorded between the two treatment periods for Hb (P = 0.118), although FCM therapy allowed maintenance of Hb values with fewer units of EPO. Incidence of TSAT less than 20%, indicating severe iron deficiency, was also reduced during FCM therapy (-15.0%; -30.4% to +0.4%; P = 0.054). The FCM group was characterized by significant reduction of the ratio of EPO dose/Hb (ERI), (-571.1; 95% CI, -966.7 to -175.4; P = 0.004) compared with the FX group (Fig. 4).
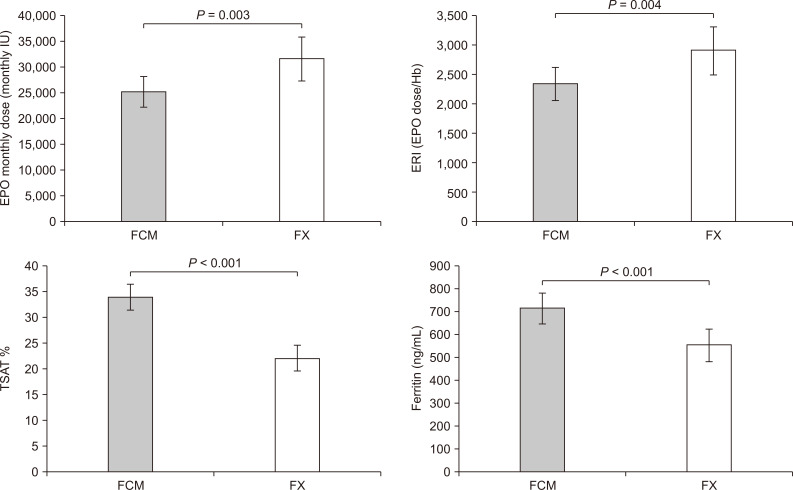
Differences between ferric carboxymaltose and ferric gluconate.
FCM, ferric carboxymaltose; FX, ferric gluconate; IU, international unit.
Finally, we assessed whether the most relevant differences between treatments in terms of iron balance (TSAT) and monthly EPO dose remained significant after considering inflammatory status. After entering Ca, parathyroid hormone (PTH), P, and fibrinogen as covariates, the difference in TSAT between FCM and FX remained significant (+11.1; 95% CI, +3.2 to +19.1; P = 0.005). Similarly, the adjustment for inflammatory indexes did not substantially change the treatment difference in monthly EPO dose (-10,726.9; 95% CI, -20,496.2 to -957.6; P = 0.028).
Since these findings were obtained using an advanced procedure capable of managing clusters (in our case, a cluster is a patient) and within-subjects correlated data, their robustness was assessed by applying basic statistical procedures to aggregated data. More specifically, medians were computed for each combination patient/period and then a paired t test was applied to each parameter. Very similar findings were obtained, confirming the general superiority of FCM to FX treatment. These results are reported in Table 3.

Comparison between FCM and FX treatment: Supplemental statistical analysis
The nonparametric Wilcoxon signed-rank test was applied as a further check, and all results were confirmed.
Univariate correlations of Hb levels and multiple regression analysis
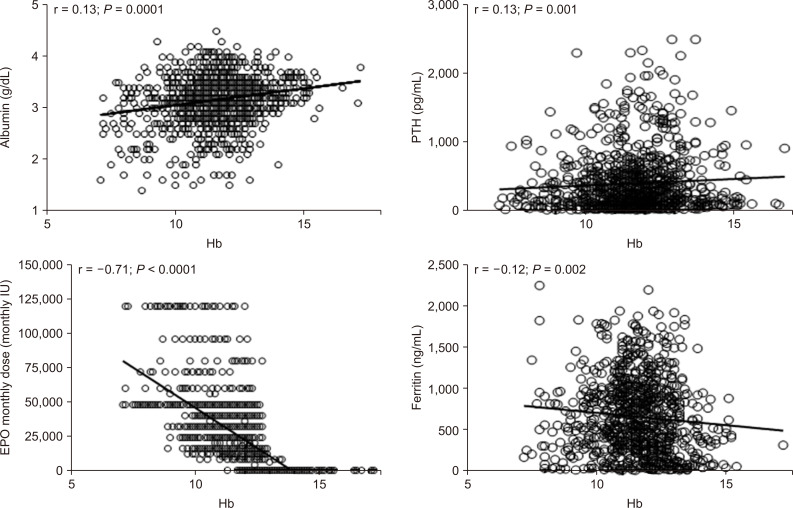
In univariate analysis, Hb levels, recorded during FCM treatment, were directly correlated with albumin (r = 0.13; P = 0.0001), serum PTH (r = 0.13; P = 0.001), calcium phosphorus product (r= 0.6; P = 0.002), and transferrin (r = 0.10; P = 0.02), whereas a significant inverse correlation was found with serum iron (r = -0.12; P = 0.0001), ferritin (r = -0.12; P = 0.002), EPO monthly dose (r = -0.71; P < 0.0001), and ERI (r = -0.78; P = 0.0001) (Fig. 5).
Univariate relationships of hemoglobin (Hb) levels in hemodialyzed patients.
IU, international unit.
In contrast, no significant correlation was found between Hb levels and other clinical and laboratory parameters, such as uric acid and TSAT (r range = 0.03 to 0.10, P > 0.06).
All variables found to be significantly related to Hb values in univariate analysis were introduced in a multivariate model using Hb level as a dependent variable. After adjustment for other factors, significance was maintained for the correlation between Hb and albumin, monthly dose of EPO, ERI, and ferritin. In contrast, the correlations with calcium—phosphorus product and PTH found in univariate analysis were lost.
Discussion
Our study revealed that treatment with FCM achieved target levels of Hb with reduced dosage of EPO. The FCM cohort was characterized by a reduced percentage of patients with TSAT < 20%, compared to the FX group, revealing better control of iron homeostasis and increased serum levels of iron and ferritin.
Hofman et al [16] confirmed our data and demonstrated the superiority of FCM compared to iron sucrose in obtaining better iron status in HD patients. Moreover, this was the first study comparing FCM and FX.
The increased ferritin and TSAT values observed during FCM therapy are related to improved bioavailability of elemental iron and a gradual, stable release of iron into the blood, avoiding precocious TSAT [5,17].
In the FCM group, our data revealed a reduced number of patients with Hb levels < 11 g/dL, defined as the target level. This is clinically relevant because the proportion of patients who achieve this value in a single month is usually 30% or less [1].
This important clinical target was obtained not only through improved iron management, but also by administering fewer monthly doses of EPO in the FCM group, which has positive economic implications. Reduced EPO doses may also be related to the results of several randomized controlled trials which showed that better patient outcomes are not exclusively and closely related to high levels of Hb induced by EPO administration, which may also be harmful [18-20].
Whereas nutritional status did not change during the entire observational period and no differences in albumin levels were detected after the therapy switch, reduced ERI levels were detected in the FCM cohort, demonstrating the response to EPO.
ERI represents an indirect index of inflammation. Ferritin and TSAT, the currently recommended tests to assess iron status in HD patients, have limitations that make diagnosis of iron deficiency or overload challenging [1]. Moreover, alterations in calcium and phosphorous metabolism linked to secondary hyperparathyroidism and vascular calcifications are closely related to chronic inflammation [21]. In our study, we did not evaluate modifications of inflammatory biomarkers, such as C reactive protein. However, the reduced levels of ERI in the FCM cohort may represent a link between FCM and inflammation. Further studies are necessary to confirm our hypothesis about the relationship between FCM and effects on ERI.
Compared to other IV iron preparations, FCM did not lead to additional complement activation during HD, revealing its low pro-inflammatory activities [22].
Several reports have demonstrated a strong relationship between FCM and phosphate metabolism that is mediated by complex interactions between iron formulations and fibroblast growth factor (FGF)-23, which determines hypophosphataemia [23]. FGF-23 acts primarily on the kidney to down-regulate expression of sodium-phosphate co-transporters and stimulate phosphaturia. A randomized controlled trial showed that FCM resulted in a transient increase in FGF23 through inhibition of its degradation and a subsequent increased rate of urinary phosphate excretion [24]. Our data did not assess modifications in phosphate levels between the two groups because iron-induced hypophosphatemia was not observed in our dialyzed population, in which kidney function was completely lost. The phosphaturic effects of FGF-23 were also not studied because all patients had anuria.
Finally, this study demonstrates that FCM, administered by bolus-push injection into the HD venous line, is a well-tolerated therapy with no adverse reaction recorded during the entire studied period.
The present study has some limitations. First, it was a single-center, retrospective study, and the patient cohort was relatively small with confounding factors that may have affected Hb levels. Although the target Hb level was set, anemia therapy depended on the discretion of each doctor. Given these limitations, a prospective study on the effects of FCM on Hb levels in HD patients is required in the future. Confirmation in wider cohorts is indispensable to verify the general validity to our report. Second, C-reactive protein, an inflammatory marker used to ascertain functional iron deficiency, was not included. However, we did account for a number of speculative inflammatory markers, including serum albumin, ERI and ferritin, obtaining interesting data for this study generating hypotheses.
In conclusion, we have clearly demonstrated that minor doses of EPO administered during FCM treatment, compared to those delivered during FX therapy, help maintain stable and target levels of Hb. Better control of anemia was also achieved, as demonstrated by high levels of ferritin and TSAT.
Further observational and prospective studies are warranted to comprehensively determine the factors that influence anemia and iron homeostasis and their implications on inflammation and outcomes in HD patients.
Notes
Conflicts of interest
All authors have no conflicts of interest to declare.
Authors’ contributions
Antonio Lacquaniti, Patrizio Pasqualetti, and Paolo Monardo designed the study, and analysed and interpreted the data. Teresa Casuscelli Di Tocco, Stefania Rovito, and Susanna Campo drafted the article. Maurizio Bucca and Antonino Ragusa revised the paper. All authors provided intellectual content of critical importance to the work. All authors finally approved this version of the manuscript for publication.