Low prealbumin levels are independently associated with higher mortality in patients on peritoneal dialysis
Article information
Abstract
Background
Prealbumin, a sensitive marker for protein–energy status, is also known as an independent risk factor for mortality in hemodialysis patients. We investigated the impact of prealbumin on survival in incident peritoneal dialysis (PD) patients.
Methods
In total, 136 incident PD patients (mean age, 53.0 ± 15.8 years) between 2002 and 2007 were enrolled in the study. Laboratory data, dialysis adequacy, and nutritional parameters were assessed 3 months after PD initiation. Patients were classified into 2 groups according to prealbumin level: high prealbumin (≥ 40 mg/dL) and low prealbumin (< 40 mg/dL).
Results
The patients in the low-prealbumin group were older and had more comorbidities such as diabetes and cardiovascular diseases compared with the patients in the high-prealbumin group. Mean subjective global assessment scores were lower, and the high-sensitivity C-reactive protein levels were higher in the low-prealbumin group. Serum creatinine, albumin, and transferrin levels; percent lean body mass; and normalized protein catabolic rate were positively associated, whereas subjective global assessment scores and high-sensitivity C-reactive protein levels were negatively associated with prealbumin concentration. During the median follow-up of 49 months, patients in the lower prealbumin group had a higher mortality rate. Multivariate analysis revealed that prealbumin < 40 mg/dL (hazard ratio, 2.30; 95% confidence interval, 1.14–4.64) was an independent risk factor for mortality. In receiver operating characteristic curves, the area under the curve of prealbumin for mortality was the largest among the parameters.
Conclusion
Prealbumin levels were an independent and sensitive predictor for mortality in incident PD patients, showing a good correlation with nutritional and inflammatory markers.
Introduction
The National Kidney Foundation Kidney Disease Outcomes Quality Initiative clinical practice guideline for nutrition in end-stage renal disease (ESRD) has suggested that more careful attention to the relationship between nutrition and dialysis outcomes is needed [1], [2]. The dialysis procedure itself results in protein and nutrient losses into the dialysate and changes of metabolism [3]. Moreover, inadequate dialysis leads to anorexia, increased levels of leptin, and impaired taste acuity [1], [4]. As a result, 39% to more than 50% of maintenance dialysis patients have protein–energy malnutrition [5], [6]. In this context, prior studies have investigated the relationship between various nutritional markers and mortality in patients on dialysis [5], [6], [7], [8].
Prealbumin, also known as transthyretin, is a 54-kDa hepatic secretory protein and functions primarily as a transport protein for thyroxin and vitamin A [9]. Serum prealbumin levels decline in response to inadequate protein intake and acute or chronic inflammation [10]. However, prealbumin levels may increase in renal failure, presumably because of impaired degradation by the kidney, and thus may not correlate with changes in other nutritional parameters [11]. Nonetheless, many studies have suggested that the serum prealbumin concentration is independently associated with mortality in hemodialysis patients, even after adjustment for other nutritional parameters including albumin [5], [12], [13]. Prealbumin is also known as a more sensitive marker for protein–energy malnutrition than albumin because the half-life of 2–3 days for prealbumin is shorter than the half-life of 20 days for albumin [7], [9].
However, data on the role of prealbumin in peritoneal dialysis (PD) are limited, and controversies regarding optimal prealbumin levels still exist [8], [12], [14]. We investigated the impact of prealbumin on survival in incident PD patients and evaluated the relationships between prealbumin and other nutritional markers.
Methods
Study population
We enrolled 136 consecutive patients who started PD and had baseline laboratory data, dialysis adequacy, and nutritional parameters between January 1, 2002, and November 30, 2007, at Kyungpook National University Hospital. Exclusion criteria for this study were as follows: patients with infection at enrollment and patients who had changed dialysis modality, undergone renal transplantation, or transferred to another dialysis unit. The Institutional Review Board of Kyungpook National University Hospital approved this study. All study procedures adhered to the Declaration of Helsinki.
Dialysis prescription and data collection
PD patients were followed regularly, and PD prescriptions were adjusted by the patient's weight, peritoneal equilibration characteristics, and clinical condition. Dialysis adequacy was assessed via dialysate/plasma creatinine (Cr), ultrafiltration volume, urine volume, residual renal function, and weekly Kt/V urea.
Laboratory data, dialysis adequacy, and nutritional parameters were assessed within 3 months after PD initiation. On enrollment, demographic and clinical data including age, sex, and cause of ESRD, and systemic comorbidities, such as diabetes, hypertension, and cardiovascular diseases, were assessed. Cardiovascular disease is defined as follows: (1) coronary artery disease and myocardial infarction; (2) congestive heart failure; (3) cerebrovascular disease, stroke, atrial fibrillation, or peripheral arterial disease; and (4) sudden cardiac death. Venous blood samples were assessed at regular visits within 3 months.
Nutritional markers were defined as follows: serum Cr, albumin, total cholesterol, and transferrin levels; subjective global assessment (SGA) scores; percent lean body mass (%LBM); and normalized protein catabolic rate (nPCR). Lean body mass was estimated by Cr kinetics [15]. High-sensitivity C-reactive protein (hs-CRP) was defined as an inflammatory marker. Other laboratory data included hemoglobin, blood urea nitrogen (BUN), triglycerides, glucose (fasting blood sugar), lipoprotein(a), and ferritin. Based on SGA scores, patients were subdivided into 3 groups: normal (6–7), mildly to moderately malnourished (3–5), and severely malnourished (1–2) groups.
For evaluation of serum prealbumin, the samples were centrifuged 20 minutes after collection, and then the serum was kept at –18°C. Prealbumin was determined by turbidimetric immunoassay using the COBAS INTEGRA 800 automated analyzer (Integra; Roche, Basel, Switzerland). Correlations between prealbumin and other nutritional and inflammatory markers were also analyzed.
Statistical analysis
Patients were classified into 2 groups according to the prealbumin level based on the results of previous studies [12], [13], [16]: high prealbumin (≥ 40 mg/dL) and low prealbumin (< 40 mg/dL). For comparison between the 2 groups, continuous variables were evaluated with the independent t test, and categorical variables were evaluated with the Pearson chi-square test. A comparison of survival curves between the 2 groups was conducted with the Kaplan–Meier survival analysis and log-rank test. To identify independent predictors of mortality, the hazard ratio (HR) and 95% confidence interval (CI) for each variable were calculated using the multivariate Cox proportional hazard model with the backward conditional method. The correlation between prealbumin and other nutritional parameters and inflammation was analyzed with the Pearson correlation coefficient. Receiver operating characteristic (ROC) curves were built, and the area under the ROC curve (AUC) was calculated to evaluate the ability of each nutritional parameter to predict mortality. The pairwise comparison of AUC values was performed using a method proposed by DeLong et al [17] and MedCalc software, version 15.6.1 (MedCalc Software bvba, Ostend, Belgium). Statistical analyses were performed with SPSS for Windows, version 18.0 (SPSS Inc., Chicago, IL, USA). Values are shown as the mean ± standard deviation with a range, and a P value < 0.05 was considered statistically significant.
Results
Patient characteristics
The mean age of the enrolled patients was 53.0 ± 15.8 years, and the number of men was 85 (62.5%). The causes of ESRD were as follows: diabetes (47.1%), glomerulonephritis (36.8%), hypertension (11.0%), polycystic kidney disease (2.9%), and others (2.2%). Patient demographic and clinical characteristics are described in Table 1.

Baseline demographics of peritoneal dialysis patients (n = 136)
Comparisons of parameters between high- and low-prealbumin groups
Table 2 summarizes the clinical characteristics of the subgroup analysis according to the prealbumin level. Among 136 total patients, 56 and 80 patients were divided into high- and low-prealbumin groups, respectively. The low-prealbumin group showed a greater number of patients with old age, diabetes, cardiovascular disease, low SGA scores, and hs-CRP ≥ 1 mg/dL compared with the high-prealbumin group. Patients with low prealbumin were also associated with worse nutritional markers, such as BUN, Cr, albumin, transferrin, %LBM, and nPCR. However, there were no significant differences in hemoglobin, serum total protein, total cholesterol, triglyceride, and ferritin levels between the groups.

Comparisons of parameters between the 2 groups according to the prealbumin level
Correlations of prealbumin with other biochemical markers
Table 3 shows the correlations of prealbumin with age and other biochemical markers in PD patients. Serum BUN, Cr, albumin, and transferrin levels; %LBM; and nPCR were positively associated with prealbumin concentration, whereas serum glucose and hs-CRP levels and SGA score were negatively associated with prealbumin concentration. Pearson correlation analysis demonstrated negative correlation between prealbumin and residual renal function (R = –0.244, P = 0.004). However, total cholesterol did not show a significant correlation with prealbumin.

Correlations of prealbumin with biochemical profiles in peritoneal dialysis
Prealbumin and patient survival
During the study period, 54 of 136 PD patients died. The causes of mortality were as follows: cardiac disease (32%), sepsis except peritonitis (28%), cerebrovascular accident (13%), peritonitis (8%), malignancy (2%), and others (17%).
Patient survival was compared between the high- and low-prealbumin groups during the mean follow-up of 50.5 ± 31.7 months. Patient survival in the low- and high-prealbumin groups was 64.8% and 87.3% at 3 years, 50.7% and 79.8% at 5 years, and 29.8% and 75.6% at 10 years, respectively. Kaplan–Meier survival analysis demonstrated that 10-year mortality in the low-prealbumin group was significantly higher than that in the high-prealbumin group (P < 0.001) (Fig. 1).
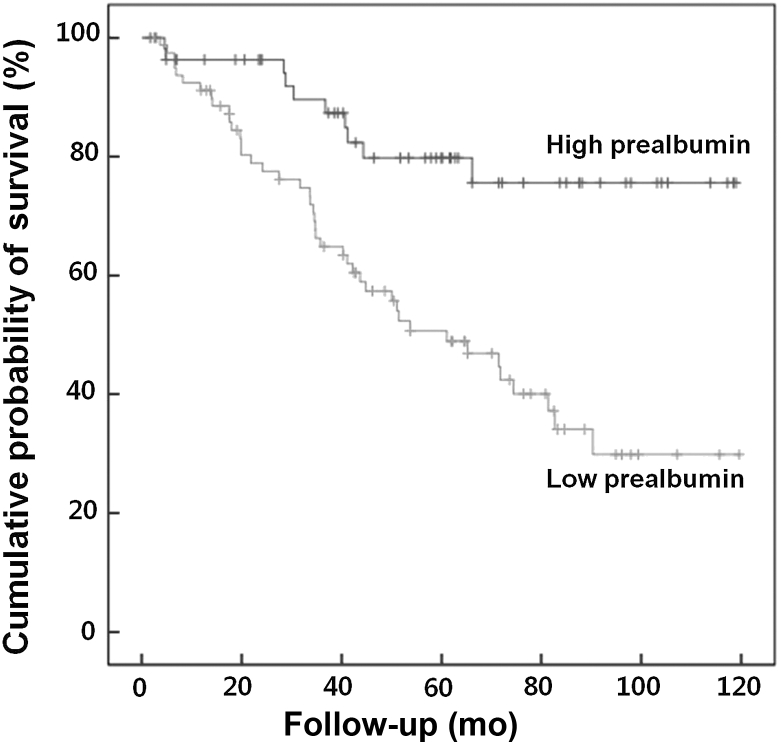
Kaplan–Meier survival analysis by the prealbumin level in 136 peritoneal dialysis patients. Kaplan–Meier survival analysis demonstrated that cumulative probability of 10-year survival in the high-prealbumin group was significantly higher than that in the low-prealbumin group (P < 0.001, Mantel log-rank test).
Table 4 demonstrates the Cox proportional hazards analysis for independent predictors of mortality in PD patients. Univariate analysis showed that older age (65 years and older), diabetes, cardiovascular disease, low SGA scores, prealbumin < 40 m/dL, lower %LBM, and hs-CRP ≥ 1 mg/dL were associated with mortality. However, the serum albumin level did not influence mortality in this regression model (P = 0.184). Multivariate analysis revealed that prealbumin < 40 m/dL (HR, 2.30; 95% CI, 1.14–4.64), diabetes (HR, 4.02; 95% CI, 2.10–7.71), cardiovascular disease (HR, 3.43; 95% CI, 1.88–6.24), and CRP ≥ 1 mg/dL (HR, 2.11; 95% CI, 1.12–3.97) were independent risk factors for mortality. To test the interaction between prealbumin and hs-CRP, the authors added an interaction term (prealbumin × hs-CRP) to a regression model. As a result, there was no statistical significant interaction (P = 0.192). Therefore, we thought that our multivariate Cox proportional hazard assumption is satisfied and the interaction term could be dropped from the model. In addition to treating prealbumin as a categorical variable, multivariate Cox regression analysis demonstrated that HR of prealbumin level (as continuous variable) for mortality was 0.962 (95% CI, 0.934–0.990).

Predictors of mortality in peritoneal dialysis patients: univariate and multivariate Cox regression analysis
Comparison with other biochemical markers
Fig. 2 compares the AUC values of each nutritional parameter for mortality. The AUC values of prealbumin (0.705), hs-CRP (0.651), %LBM (0.644), and Cr (0.603) were larger than 0.5 significantly, which represents the chance of discrimination. Moreover, the pairwise comparison among ROC curves showed that prealbumin had a larger AUC value compared with that of classic nutritional parameters including albumin (P = 0.013), total cholesterol (P = 0.037), transferrin (P = 0.011), and nPCR (P = 0.028). Although the AUC value of prealbumin also was larger than that of hs-CRP, %LBM, and Cr, there was no statistical significance (P = 0.287, 0.243, and 0.076, respectively). However, hs-CRP, %LBM, and Cr showed no statistically significant difference in AUC compared with other nutritional parameters (all P values > 0.05; Table 5).
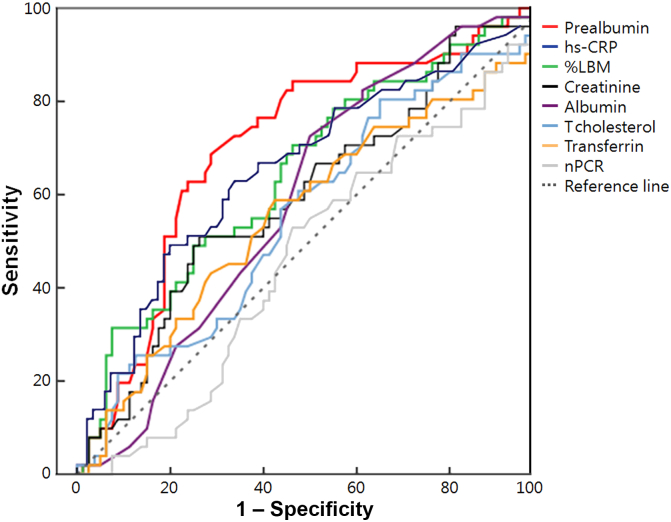
Comparison of AUC values among various nutritional parameters for survival in peritoneal dialysis patients. The AUC values of prealbumin (0.705), hs-CRP (0.651), %LBM (0.644), and Cr (0.603) were statistically significantly larger than 0.5, which represents the chance of discrimination. Moreover, the AUC value of prealbumin for mortality was the largest among the parameters.
AUC, area under the receiver operating characteristic curve; Cr, creatinine; hs-CRP, high-sensitivity C-reactive protein; %LBM, percent lean body mass; nPCR, normalized protein catabolic rate; T-cholesterol, total cholesterol.

Comparison of AUC among various nutritional parameters for survival in peritoneal dialysis patients
Discussion
We investigated the impact of prealbumin on survival and compared its predictability for mortality with other nutritional or inflammatory markers in incident PD patients. The patients in the low-prealbumin group were older and had more comorbidities such as diabetes and cardiovascular diseases compared with the patients in the high-prealbumin group. In addition, SGA scores were lower but CRP levels were higher in the low-prealbumin group. Even after adjustment for demographic, clinical, and biochemical factors, low prealbumin was an independent risk factor for mortality. Moreover, the AUC value of prealbumin for mortality was the largest among the various nutritional parameters, whereas classic nutritional markers such as albumin, cholesterol, BUN, and Cr did not show statistical significance in our results. Our results confirmed the clinical importance of prealbumin in the survival of PD patients.
Several studies have suggested the use of serum prealbumin as a better surrogate of nutritional status and cardiovascular outcome and a predictor of mortality in patients with maintenance HD [5], [7], [16], [18]. The cumulative survival of HD patients with prealbumin > 30 mg/dL was significantly better than that of patients with prealbumin < 30 mg/dL [12], [14]. In a North American cohort study with maintenance HD, patients with prealbumin > 40 mg/dL showed better survival rates compared with patients with lower prealbumin [13]. Higher prealbumin was also associated with greater survival even among different races including African American, Hispanic white, and non-Hispanic white [19].
However, there are few studies on the association between prealbumin and mortality in PD patients. Previous studies [8], [12], [14] reported that prealbumin < 30 mg/dL was associated with an increased mortality rate compared with higher prealbumin values. Similarly, Avram et al [7] reported that serum prealbumin was an independent predictor of mortality in PD patients over 12 years. In our study, we set prealbumin < 40 mg/dL as the reference value to predict mortality. Kaplan–Meier survival analysis also demonstrated that mortality in the low-prealbumin group was significantly higher than that in the high-prealbumin group over 10 years. Our results confirmed those of previous studies [12], [14], which suggested that the cumulative survival of the high-prealbumin group was better than that of the low-prealbumin group of PD patients.
There are controversies on optimal prealbumin levels for mortality prediction in dialysis patients. We defined the low-prealbumin group as prealbumin < 40 mg/dL, which is slightly higher than the criteria (prealbumin < 30 mg/dL) for the clinical diagnosis of protein–energy wasting syndrome in chronic kidney disease suggested by the International Society of Renal Nutrition and Metabolism Expert Panel and other clinic-based studies [12], [14], [20], [21]. On the contrary, 1 nutritional study on dialysis patients suggested that the ideal level of prealbumin required to maintain an adequate nutritional status of PD patients may be higher than that of HD patients [12]. A US study with 959 dialysis patients reported that the mean prealbumin level of PD patients (35 mg/dL) was higher than that of HD patients (26.5 mg/dL) [7], which was also confirmed in the results of Sreedhara et al [14]. Moreover, Mittman et al [12] reported that the predictive power of prealbumin for mortality in PD patients appears to differ from that in HD patients, and low prealbumin (< 30 mg/dL) was not a significant risk factor for mortality in PD patients by multivariate regression analysis. In this context, we defined the low-prealbumin group as prealbumin < 40 mg/dL as some researchers have set the serum prealbumin level of 40 mg/dL as the reference value [13], [16]. These researchers reported that low prealbumin concentrations were associated with mortality and hospitalization independent of serum albumin and other clinical characteristics, which was in accordance with our results.
A change in protein and energy intakes leads to parallel changes in circulating prealbumin concentrations [22]. Thus, many studies regarding malnutrition and inflammation in PD patients reported that prealbumin continued to correlate with other nutritional markers after adjusting for age, race, sex, diabetes, and CRP level [23], [24], [25]. Pearson correlation analysis demonstrated negative correlation (R = –0.244, P = 0.004) between prealbumin and residual renal function in our results. Prealbumin is excreted by the kidney via glomerular filtration [26]. Moreover, in previous studies [26], [27], recommendations for the routine use of serum prealbumin levels as a marker are tempered by the fact that prealbumin levels are increased in renal failure, presumably due to impaired degradation by the kidney [11]. These mechanisms may affect this negative correlation between prealbumin and residual renal function in our results.
Our study also demonstrated that prealbumin correlated with other nutritional markers, including serum Cr, glucose, and transferrin levels; %LBM; nPCR; SGA score; and hs-CRP level. In addition, because the half-life of prealbumin is shorter than that of albumin, previous studies suggested that prealbumin may be a more sensitive nutritional marker than either serum albumin or transferrin [5], [12], [14], [20], [28]. In our study, the AUC value of prealbumin for mortality was the largest among the various nutritional parameters, whereas serum albumin did not reach a clinically significant relationship with mortality by AUC and multivariate analyses.
On the contrary, Avram et al [7] reported that serum albumin is an independent predictor of mortality in patients on PD (relative risk, 0.52) in the univariate regression model, and higher enrollment level of serum albumin is associated with better survival [29]. Moreover, a low serum albumin level had been used as an indicator of malnutrition in dialysis patients [30]. However, in these studies, multivariate Cox regression analyses demonstrated that the level of serum albumin is not a risk factor of mortality [7], [29]. Similarly, previous studies suggested that prealbumin is the best nutritional predictor of survival in HD and PD patients, whereas the serum albumin is not a predictor for death in multivariate Cox regression analysis [12], [14]. These results were consistent with our findings. Thus, we could conclude that monitoring of serum prealbumin levels is a useful tool for predicting mortality compared with other conventional markers.
There are some limitations in our study. First, the study design was observational; thus, we could not confirm a cause-and-effect relationship in the association of prealbumin and other markers [31]. In addition, we could not analyze the relationship between the prealbumin level and changes in nutritional parameters because of retrospective design and irregular follow-up sampling. Second, we could not entirely exclude the uncounted confounding variables although we tried to exclude the potential confounding factors. In addition, the potential conditions affecting prealbumin levels, such as hepatic diseases, protein-losing enteropathy, or zinc deficiency, were not completely excluded, and important potential risk factors were not adjusted: blood pressure, glycemic control, anemia, mineral bone disorder, and some medications that can influence mortality (angiotensin II receptor blocker, statin, etc). Nevertheless, this study has the strength of having a relatively long-term follow-up duration of 50.5 months. Furthermore, this study was the first to compare AUC values of prealbumin with various nutritional and inflammatory markers that could predict mortality.
In conclusion, prealbumin measurement was a useful tool to assess the nutritional and inflammatory states of PD patients and also was the best predictor of mortality for PD patients among all tested nutritional parameters in this study.
Conflicts of interest
All authors have no conflicts of interest to declare.
References
Acknowledgments
This work was supported by grant of the Korean Health Technology R&D Project, through the Korea Health Industry Development Institute, funded by the Ministry of Health & Welfare, Korea (HI15C0001), by a grant of the Korea Healthcare Technology R&D Project, Ministry for Health and Welfare, Korea (HI10C2020).