Serum and urine metabolomic biomarkers for predicting prognosis in patients with immunoglobulin A nephropathy
Article information

Abstract
Background
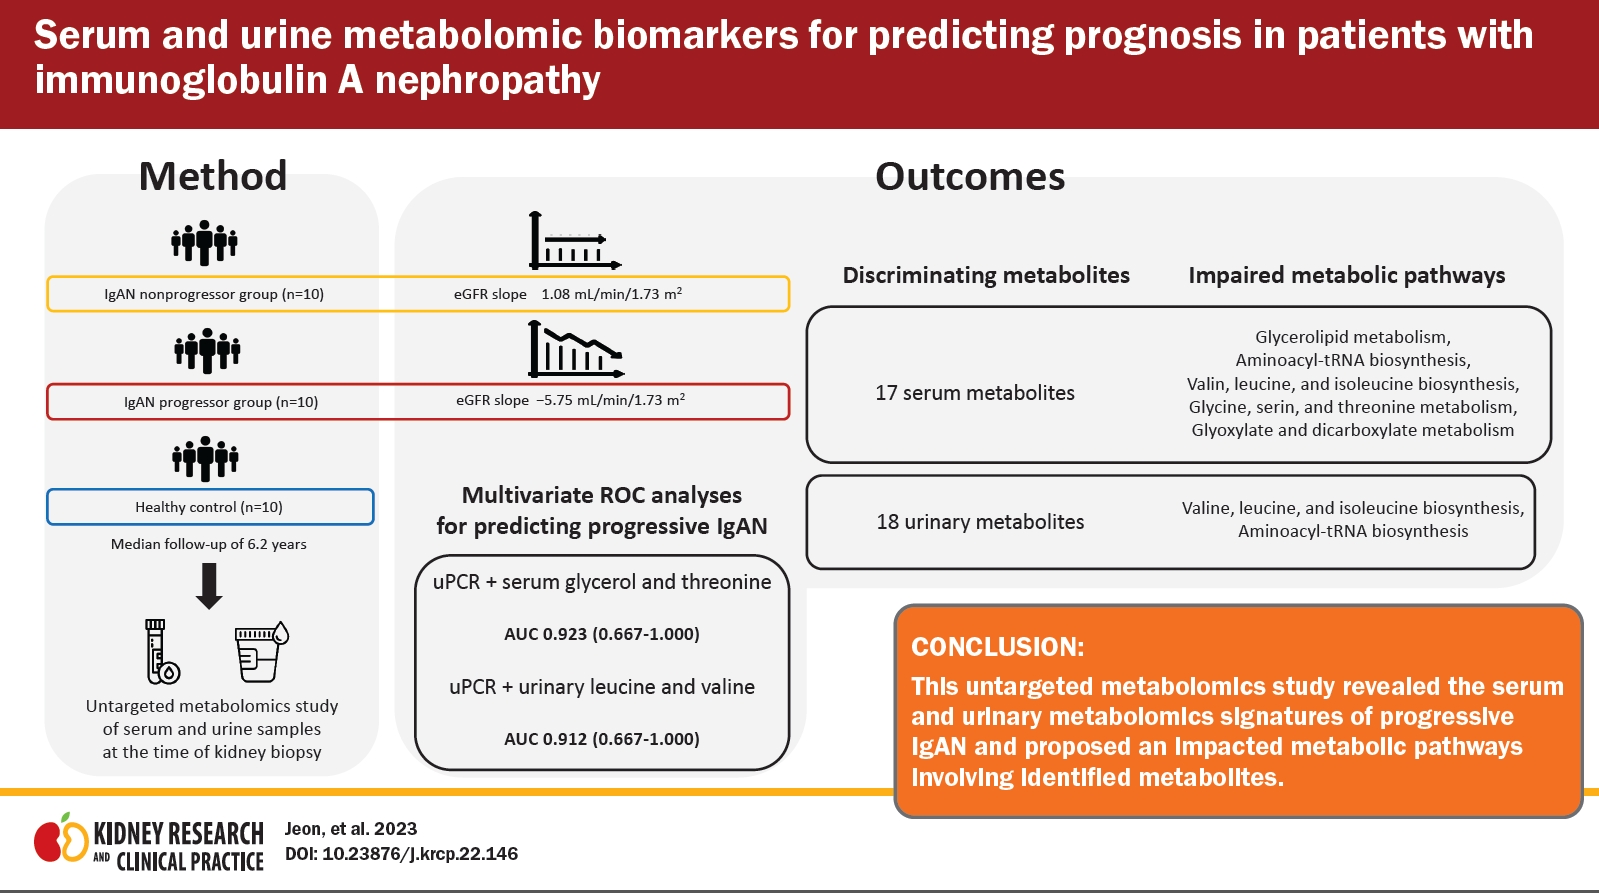
Immunoglobulin A nephropathy (IgAN) is the most prevalent form of glomerulonephritis worldwide. Prediction of disease progression in IgAN can help to provide individualized treatment based on accurate risk stratification.
Methods
We performed proton nuclear magnetic resonance-based metabolomics analyses of serum and urine samples from healthy controls, non-progressor (NP), and progressor (P) groups to identify metabolic profiles of IgAN disease progression. Metabolites that were significantly different between the NP and P groups were selected for pathway analysis. Subsequently, we analyzed multivariate area under the receiver operating characteristic (ROC) curves to evaluate the predictive power of metabolites associated with IgAN progression.
Results
We observed several distinct metabolic fingerprints of the P group involving the following metabolic pathways: glycolipid metabolism; valine, leucine, and isoleucine biosynthesis; aminoacyl-transfer RNA biosynthesis; glycine, serine, and threonine metabolism; and glyoxylate and dicarboxylate metabolism. In multivariate ROC analyses, the combinations of serum glycerol, threonine, and proteinuria (area under the curve [AUC], 0.923; 95% confidence interval [CI], 0.667–1.000) and of urinary leucine, valine, and proteinuria (AUC, 0.912; 95% CI, 0.667–1.000) showed the highest discriminatory ability to predict IgAN disease progression.
Conclusion
This study identified serum and urine metabolites profiles that can aid in the identification of progressive IgAN and proposed perturbed metabolic pathways associated with the identified metabolites.
Introduction
Immunoglobulin A nephropathy (IgAN) is the most common primary glomerular disease worldwide and progresses to end-stage kidney disease (ESKD) in approximately 30% of patients [1,2]. Oxford MEST-C classification [3] and International IgAN Prediction Tool [4] have been developed to assess the risk of disease progression in IgAN. Kidney biopsy is mandatory for diagnosis and risk stratification in IgAN. However, there are concerns about the use of remotely performed biopsies in predicting patients’ dynamic clinical courses. Hence, efforts are needed to identify and validate readily available serum or urine biomarkers for prediction of IgAN disease progression with the goal of individualized treatment.
Generally, metabolites are the end products of cell reactions, and metabolomics has been used to obtain important information about the phenotypes of organisms and diseases [5,6]. Emerging high-throughput omics technologies have been applied in recent studies to gain insights into various kidney diseases and to identify diagnostic and predictive risk markers [7–9]. Untargeted metabolomic approaches have been used to discriminate metabolites associated with chronic kidney disease (CKD) progression [10,11], and a recent study identified 13 metabolites associated with progression of diabetic kidney disease (DKD) in the targeted analysis [12].
Several studies using omics techniques have also revealed that metabolites and proteins can serve as potential diagnostic biomarkers of IgAN [13–15]. A few studies have suggested the use of urinary metabolites and proteins identified through metabolomics and proteomics as biomarkers associated with outcomes of IgAN [16,17]. However, these studies had varied definitions and methods for selecting progressive disease groups. Therefore, further metabolomic investigations to clearly identify progressive disease and validate proposed biomarkers are needed.
We hypothesized that metabolites in serum and urine can serve as biomarkers of progressive IgAN as assessed by long-term changes in the estimated glomerular filtration rate (eGFR). Our ultimate goal is to identify biomarkers associated with kidney function deterioration to facilitate the development of minimally invasive risk-based treatment strategies.
Methods
Study subjects
We screened patients with primary IgAN diagnosed by biopsy at Pusan National University Hospital, between February 2007 and April 2016. Exclusion criteria were age of <20 years, follow-up period less than 5 years, other glomerular diseases identified on kidney biopsy, eGFR less than 30 mL/min/1.73 m2, and unavailability of serum or urine samples. To determine the rate of disease progression, the annual eGFR slope was calculated using linear regression. Patients with an eGFR slope below the median and a final eGFR of 60 mL/min/1.73 m2 or less were assigned to the progressor (P) group. Age- and sex-matched patients with an eGFR slope above the median were assigned to the non-progressor (NP) group. Subjects in the P group, NP group, and healthy controls were included in the final analysis (n = 10 for all three groups). Baseline clinical characteristics and laboratory results were also collected at the time of kidney biopsy. Healthy controls were living kidney transplantation donors who provided written informed consent and donated biospecimens to the Biobank. Serum and urine samples analyzed in our study had been collected earlier as biomarker research samples for a cohort study involving patients with glomerular kidney disease (No. 1610-003-003). Specimens from patients with IgA nephropathy who fasted after midnight were collected on the day of kidney biopsy. Similarly, samples from kidney donors as healthy controls were collected on the day of nephrectomy (Nx) surgery in the fasted state.
This study was approved by the Institutional Review Board (IRB) of Pusan National University Hospital (No. 2009-007-094). The IRB waived the requirement for informed consent because of the retrospective design of the study. Biospecimens and data used for the healthy control group were provided by the Biobank of Pusan National University Hospital, a member of the Korea Biobank Network.
Sample preparation for proton nuclear magnetic resonance measurements
Blood and urine samples from patients were collected before kidney biopsy and centrifuged for 15 minutes at 1,006 ×g and 4 °C. Serum and urine samples were immediately frozen and stored at –80 °C. For proton nuclear magnetic resonance (1H-NMR) analysis, frozen serum samples were fully thawed at room temperature. Serum was vortexed and then centrifuged at 12,000 ×g for 10 minutes at 4 °C. Sodium phosphate buffer solution (300 μL) in deuterium oxide (0.075-M NaH2PO4) containing 4-mM 3-trimethylsilyl propionic-2,2,3,3-d4 acid sodium salt (TSP-d4; Sigma-Aldrich) as a chemical shift reference and sodium azide (NaN3) as a preservative were added to 300 μL of supernatant from the serum samples. The resulting 600-μL solutions were adjusted to a pH of 7.4, mixed well, and transferred to 5 mm-NMR tubes for NMR measurement.
Urine samples were thawed and centrifuged using the same methods described above for the serum samples. Sixty microliters of potassium phosphate buffer solution in deuterium oxide at pH 7.4 (1.5-M KH2PO4) containing TSP-d4 as a chemical shift reference and NaN3 as a preservative were added to 540 μL of urine sample supernatant. The resulting 600-μL solutions were adjusted to a pH of 7.4, mixed well, and transferred to 5 mm-NMR tubes for NMR measurement.
Proton nuclear magnetic resonance spectral acquisition and processing analyses
1H-NMR spectral acquisition of serum samples was performed using the Carre–Purcell–Meiboome–Gill (CPMG) pulse sequence with a relaxation delay time of 3 seconds, acquisition time of 3 seconds, and total time of 13 minutes 13 seconds using 128 scans to suppress water and macromolecule signals [18]. Signals were acquired using a 600-MHz Varian NMR spectrometer (Varian, Inc.) at 298 K. Phases and baselines of all 1H-NMR spectra were corrected manually, and chemical shifts were adjusted with the TSP signal to 0.00 parts per million (ppm) as an internal reference using VnmrJ software of Varian NMR spectrometer systems (Varian, Inc). All spectra with line broadenings of 0.3 Hz were binned into buckets of 0.003 ppm from 0.5 to 9.0 ppm after excluding the region of the water signal (4.55 to 5.18 ppm) to minimize interference caused by variability in the water suppression signal. Thereafter, spectra were normalized using the total area to minimize dilution effects among samples. Binning data were aligned using the icoshift algorithm in MATLAB (MathWorks) and were used for pattern recognition analyses. The resonance of each metabolite was identified and quantified using Chenomx NMR suite 8.4 Professional (Chenomx Inc.).
For the urine samples, 1H-NMR spectral acquisition was performed using a 1D NOESY (nuclear Overhauser effect spectroscopy) presat pulse sequence for water suppression with a relaxation delay time of 1 second, mixing time of 0.01 seconds, and acquisition time of 2.726 seconds for a total time of 8 minutes 16 seconds using 128 scans and the same NMR spectrometer as used for the serum samples at 298 K. Phases and baselines of all 1H-NMR spectra were corrected manually, and chemical shifts were adjusted to the TSP signal to 0.00 ppm as an internal reference using VnmrJ software. All spectra with line broadenings of 0.3 Hz were binned into buckets of 0.01 ppm from 0.5 to 9.5 ppm after excluding the regions of the water and urea signals (4.55 to 6.4 ppm) to minimize interference due to the variability of water suppression and urea signals, and spectra were normalized in the same manner as described for the serum samples.
Metabolic pathway analysis
Metabolic pathway analysis was performed using the pathway analysis module of MetaboAnalyst 5.0 (https://www.metaboanalyst.ca) for urine and serum metabolites with variable importance in projection (VIP) values of >1.0 in a comparison of the NP and P groups. Pathway analysis was conducted using as follows. Pathway enrichment analysis was performed using the “global test” to assess the statistical significance of the enrichment, and pathway topology was determined using “out-degree centrality” to evaluate the importance of the matched metabolites in identified metabolic pathways [19]. The Kyoto Encyclopedia of Genes and Genome (KEGG) database for Homo sapiens was used as the reference pathway library. Significantly disturbed metabolic pathways were defined as those with a p-value of ˂0.05 and an impact score of >0.1.
Statistical analysis
Multivariate pattern recognition analysis was performed using unsupervised principal component analysis (PCA) to identify outliers in the dataset; orthogonal partial least squares discriminant analysis (OPLS-DA) with unit variance scaling was the supervised method used to uncover discriminatory variances. Analyses were performed using SIMCA-P 12.0.1 software (Umetrics). Performances of the classification models were assessed using cumulative R2 and Q2 values indicating goodness of fit and prediction ability, respectively. Variables responsible for discrimination were identified using VIP in the model, and variables with VIP values of >1.0 were considered significant. To confirm the normality of the data sets, the Kolmogorov-Smirnov test was performed (p > 0.05). Significant differences in concentrations between NP and P groups were examined using the Mann-Whitney U test (p < 0.05). These analyses were performed using the IBM SPSS version 25 (IBM Corp.). Multivariate receiver operating characteristic (ROC) curve comparisons between the P and NP groups were performed using MetaboAnalyst 5.0. First, metabolites and clinical variables with high predictability were identified using univariate ROC analysis. We then assessed multicollinearity as measured by variance inflation factors (VIFs) and selected independent variables with VIF of <10. Thereafter, to enhance discriminatory accuracy, metabolites with area under the curve (AUC) above 0.7 were determined using multivariate ROC analysis.
Results
Clinical characteristics of immunoglobulin A nephropathy patients
Serum and urine samples from 20 IgAN patients were analyzed. Baseline characteristics of the patients are shown in Table 1. Urine protein/creatinine ratio (p = 0.027) was significantly higher in the P group, but there were no significant differences in age, sex, mean blood pressure, hematuria, World Health Organization (WHO) classification, or baseline kidney functions between the P and NP groups. Most patients were prescribed angiotensin II receptor blockers, and 10% of the NP group and 50% of the P group received immunosuppressive therapy with corticosteroid. During the median follow-up period of 6.2 years, the mean annual eGFR slope in the P group was –5.75 ± 2.98 mL/min/1.73 m2/year (p < 0.001), and one patient (5%) developed ESKD. Fig. 1 illustrates the individual eGFR trajectories for each group over at least 60 months.
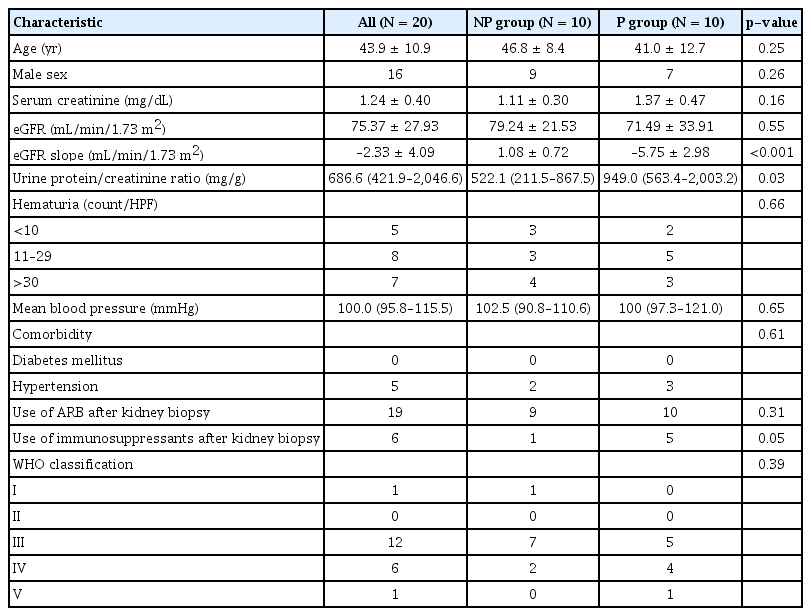
Clinical and laboratory data of the study subjects at baseline

eGFR trajectories of the study subjects.
(A) The non-progressor (NP) group showed a decrease in kidney function with a mean eGFR slope of 1.08 mL/min/1.73 m2/year. (B) The progressor (P) group showed preservation of kidney function with a mean eGFR slope of –5.75 mL/min/1.73 m2/year.
eGFR, estimated glomerular filtration rate.
Serum metabolic profiling
Serum samples from 10 healthy controls and 20 patients with IgAN were included in the metabolomics analysis. Multivariate analysis findings based on 1H-NMR spectroscopy of serum metabolites are shown in Fig. 2. We compared the P and NP groups after identifying metabolic patterns of IgAN that differed from the control group. Unsupervised PCA showed differences in the distributions of serum metabolic profiles between the groups; however, there were some overlaps between clusters (Fig. 2A, C). To distinguish between the groups, OPLS-DA was performed. As shown in Fig. 2B and D, distinct clusters were observed between the groups (control vs. IgAN: R2Y = 0.991, Q2 = 0.770; P vs. NP: R2Y = 0.948, Q2 = 0.222). VIP scores, indicating the contributions of metabolites to the discriminant model, were obtained by comparison of the NP and P groups (Table 2), as well as the control and IgAN groups (Supplementary Table 1, available online). To identify potential biomarkers of disease progression, we evaluated common metabolites among variables with VIP score of >1 in each comparison group (control vs. IgAN and NP vs. P). Seventeen overlapping metabolites (3-hydroxybutyrate, 3-hydroxyisobutyrate, acetate, acetone, creatinine, formate, glucose, glutamine, glycerol, glycine, hypoxanthine, lysine, phenylalanine, proline, serine, threonine, and valine) were identified. Supplementary Table 2 (available online) provides the list of 43 metabolites identified in serum based on comparisons between the P and NP groups.
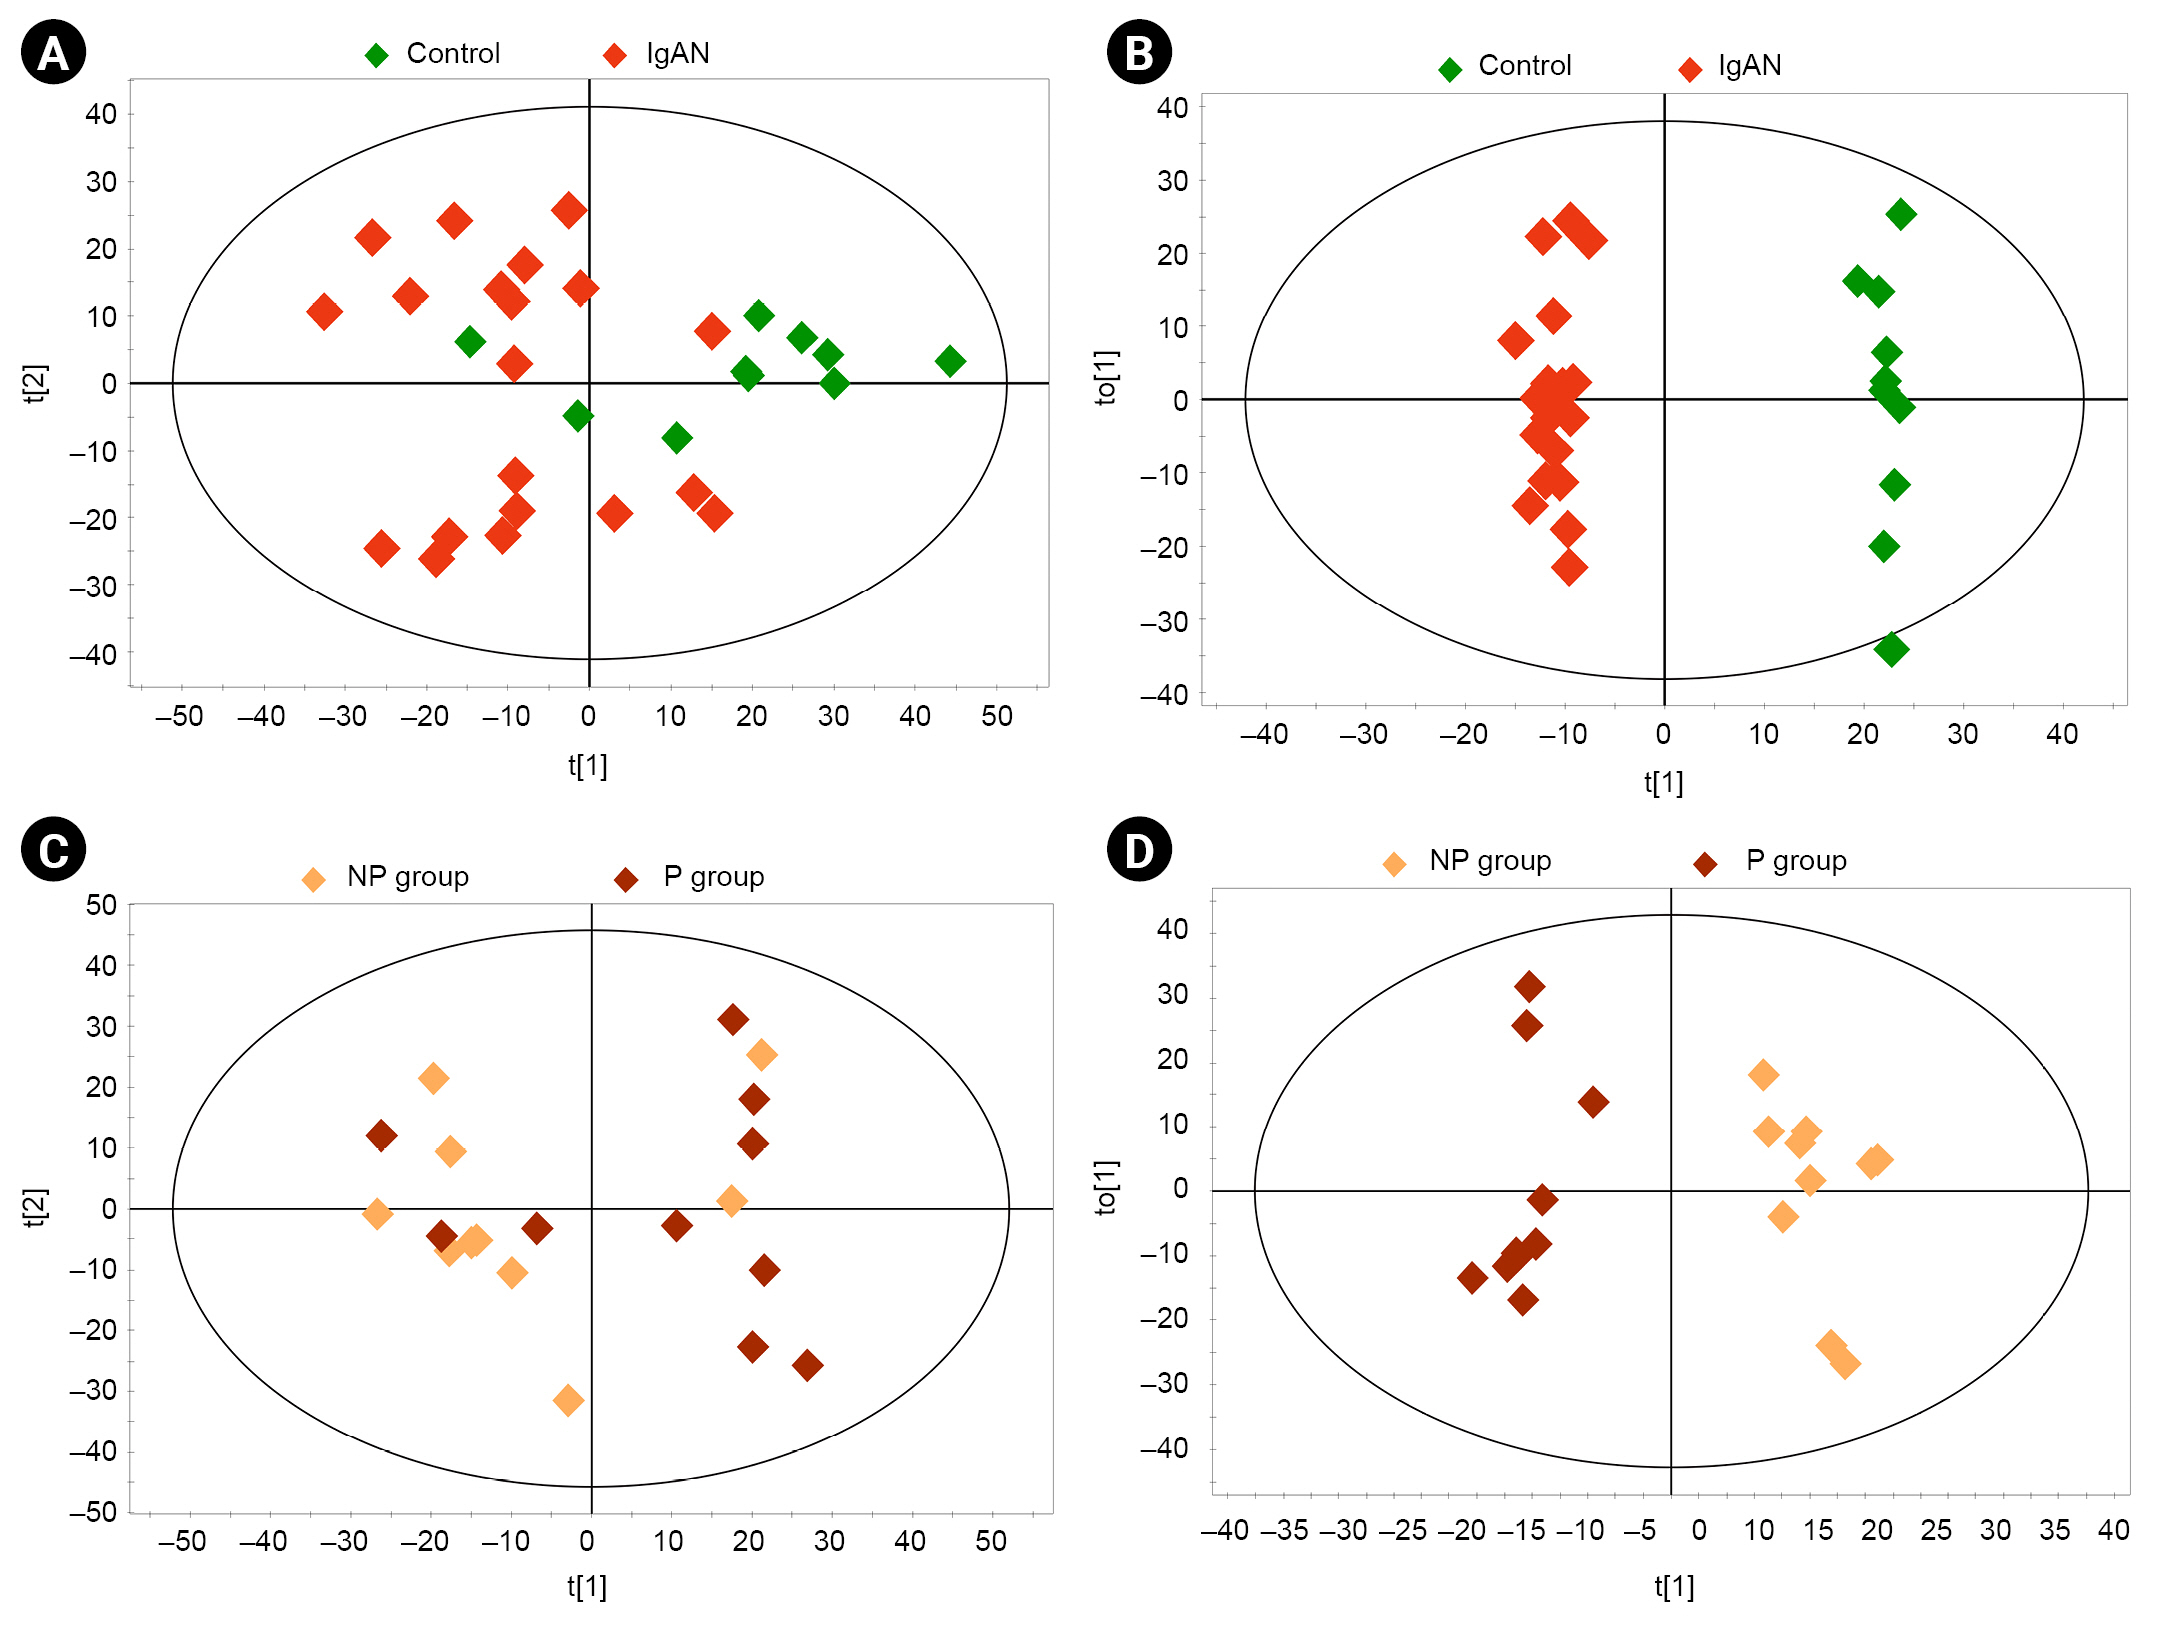
Multivariate analysis of the metabolites of serum samples.
(A) Principal component analysis (PCA) score plot of controls vs. patients with IgAN (R2X = 0.515, Q2 = 0.111). (B) Orthogonal partial least squares discriminant analysis (OPLS-DA) score plot of controls vs. patients with IgAN (R2Y = 0.991, Q2 = 0.770). (C) PCA score plot of progressor (P) group vs. non-progressor (NP) group (R2X = 0.263, Q2 = 0.057). (D) OPLS-DA score plot of P group vs. NP group (R2Y = 0.948, Q2 = 0.222). The ellipse indicates the confidence region.
IgAN, immunoglobulin A nephropathy.
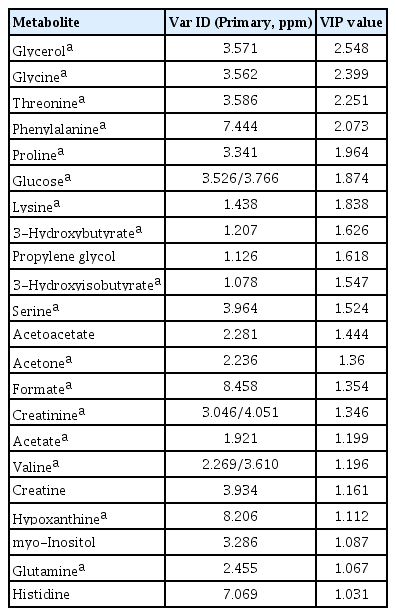
VIP values of serum OPLS-DA score plot between non-progressor and progressor groups
Urine metabolic profiling
We performed metabolomics analyses of urine samples from healthy controls, NP, and P groups. Multivariate analysis based on 1H-NMR spectroscopy of urine samples was performed in the same manner as described for serum. PCA analyses revealed greater variability in clustering patterns in the IgAN group than in the control group (Fig. 3A). OPLS-DA was performed to identify differences between groups. Score plots from OPLS-DA showed discrimination between different groups (control vs. IgAN: R2Y = 0.971, Q2 = 0.458; NP vs. P: R2Y = 0.937, Q2 = 0.177) (Fig. 3B, D). The VIP scores of urinary metabolites that differed between the control and IgAN groups are provided in Supplementary Table 3 (available online). Table 3 lists the 20 urinary metabolites with VIP score of >1 obtained from OPLS-DA between the NP and P groups; among these, 18 metabolites were identified in both control vs. IgAN group and NP vs. P group comparisons. In addition, the urinary concentrations of 47 identified metabolites were compared between the P and NP groups using the Mann-Whitney U test (Supplementary Table 4, available online).
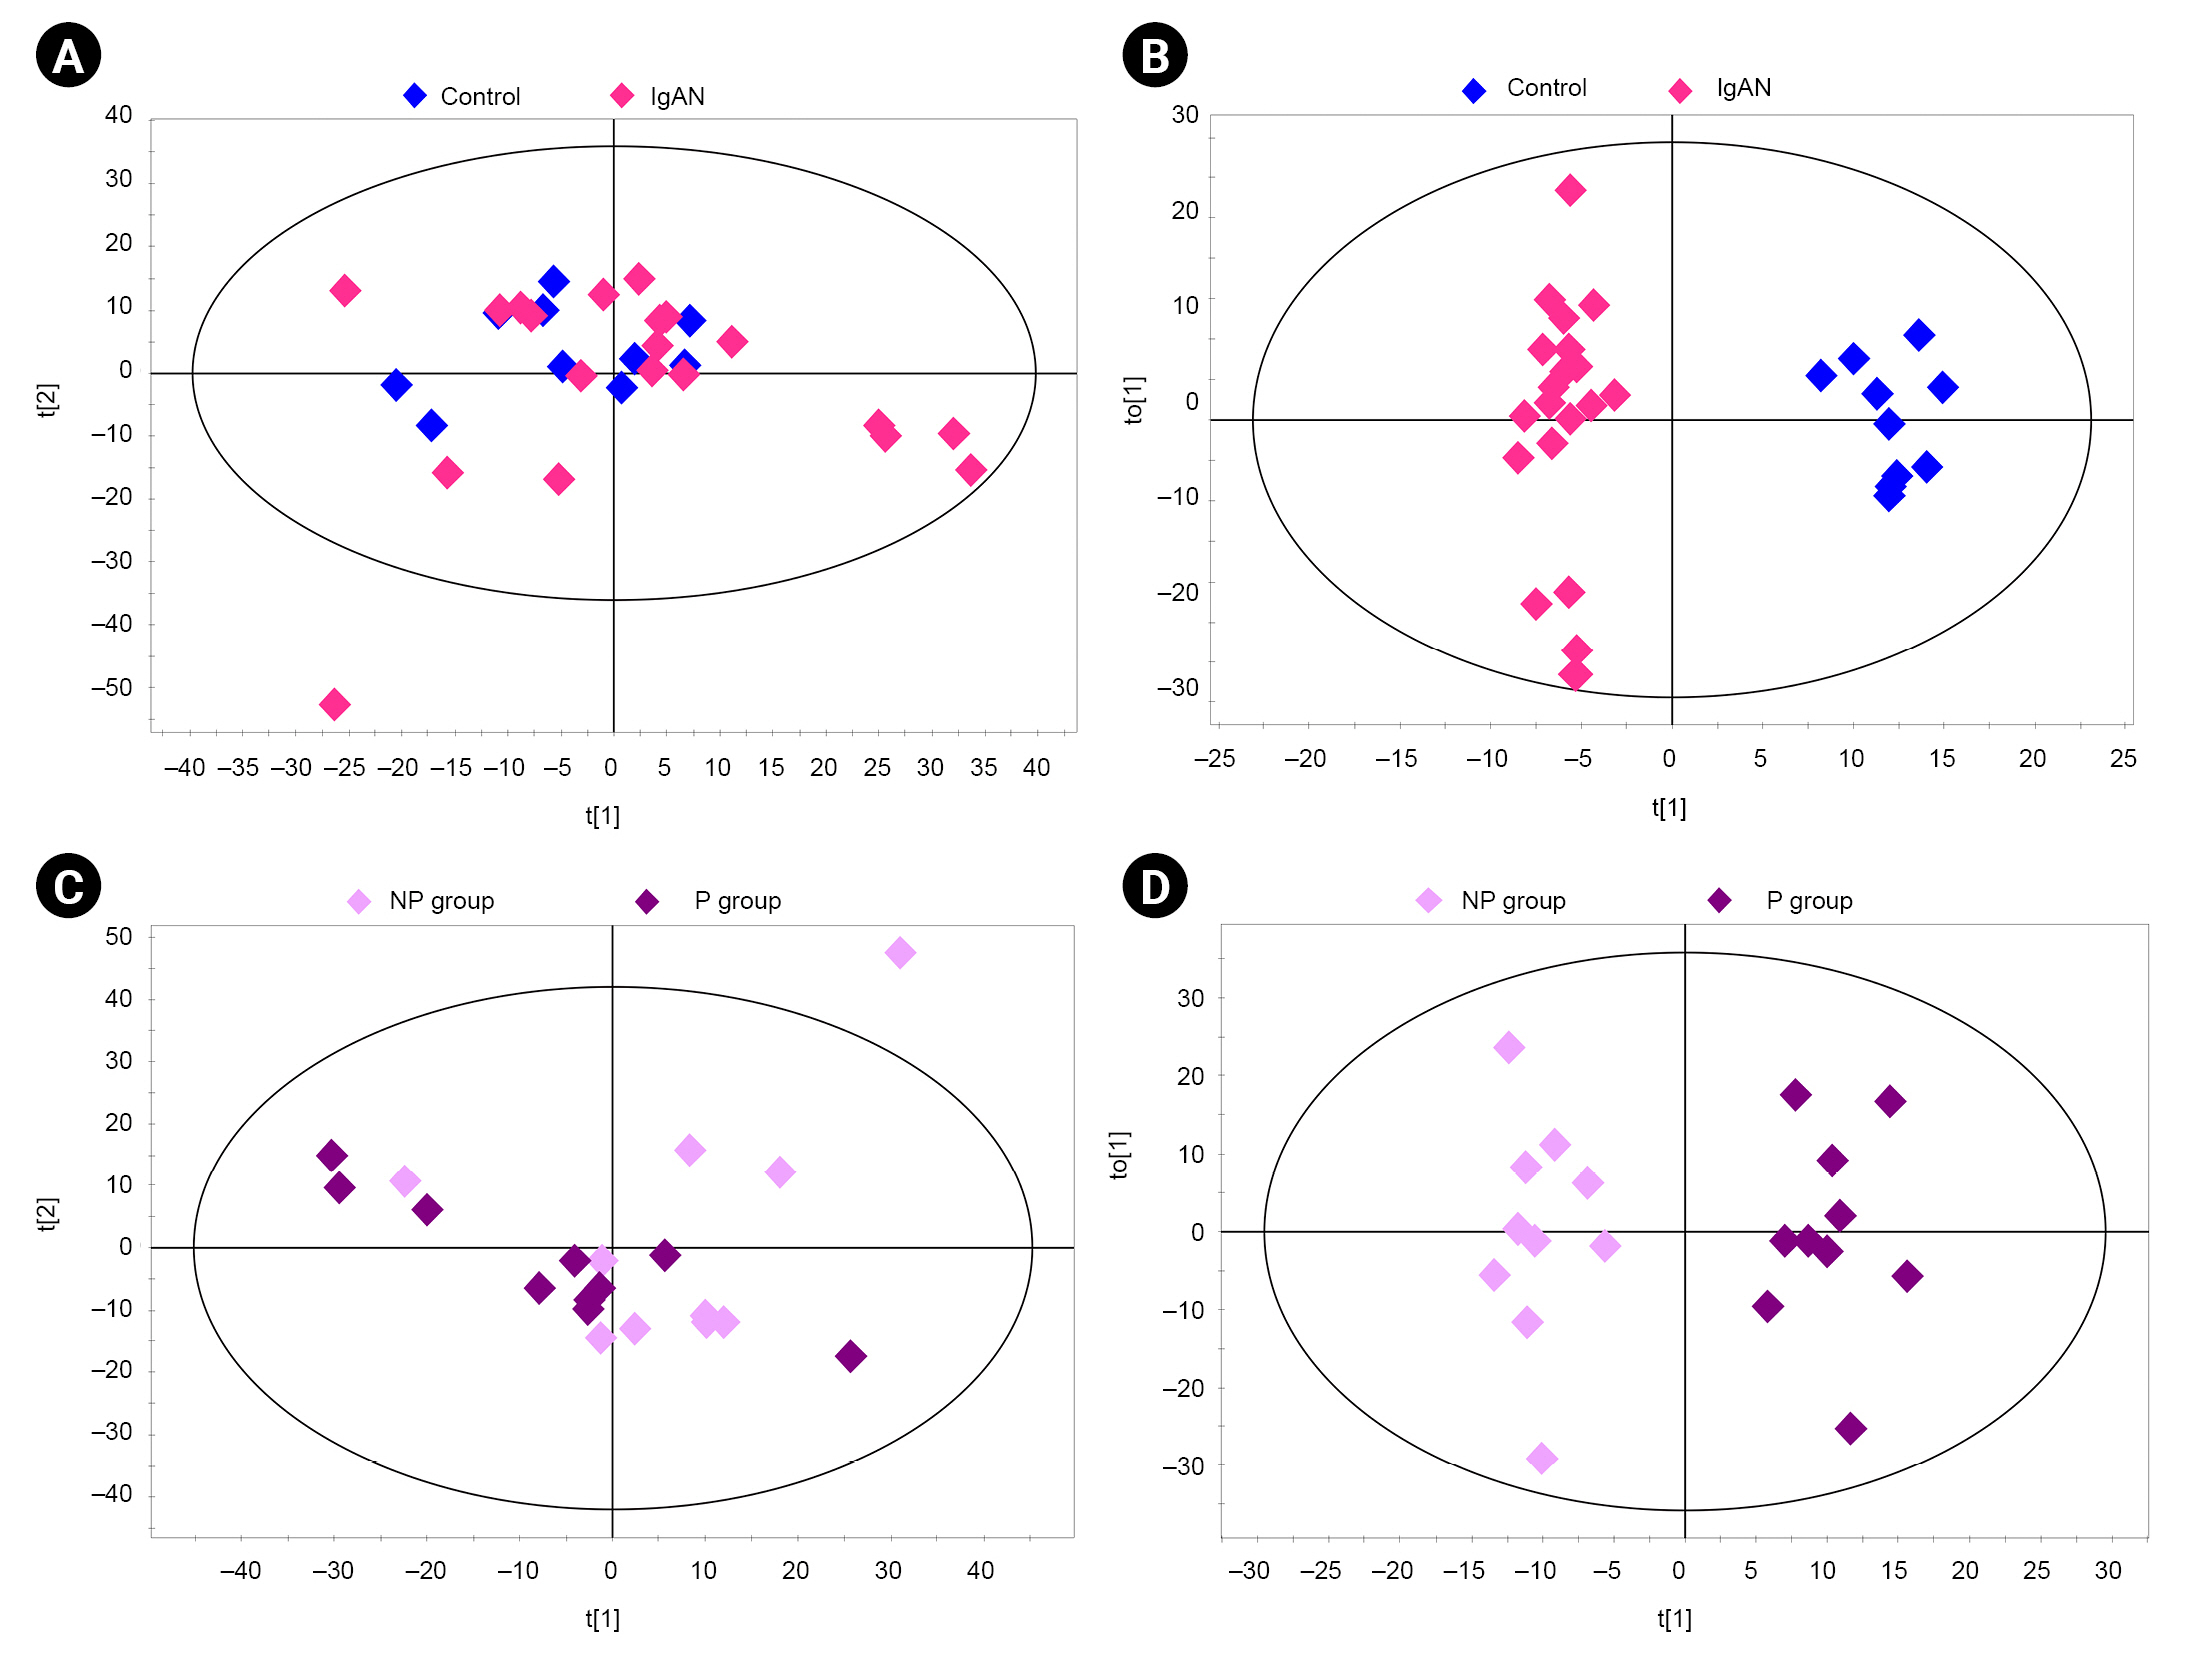
Multivariate analysis of the metabolites of urine samples.
(A) Principal component analysis (PCA) score plot of controls vs. patients with IgAN (R2X = 0.266, Q2 = 0.068). (B) Orthogonal partial least squares discriminant analysis (OPLS-DA) score plot of controls vs. patients with IgAN (R2Y = 0.971, Q2 = 0.458). (C) PCA score plot of progressor (P) group vs. non-progressor (NP) group (R2X = 0.327, Q2 = 0.025). (D) OPLS-DA score plot of P group vs. NP group (R2Y = 0.937, Q2 = 0.177). The ellipse indicates the confidence region.
IgAN, immunoglobulin A nephropathy.

VIP scores of urinary OPLS-DA score plots between non-progressor and progressor groups
Pathway analysis of identified serum metabolites
Pathway enrichment analysis was performed to identify the metabolic pathways that contribute to IgAN disease progression. The 17 metabolites with VIP scores of >1.0 in each comparison group (control vs. IgAN and NP vs. P) were used in pathway analysis. The topology of the pathway in Fig. 4 shows several altered metabolic pathways associated with IgAN progression. Each node represents a metabolic pathway; the darker is the color, the stronger is the impact. Labeled nodes (A–E in Fig. 4) indicate significantly perturbed metabolic pathways (all p < 0.05, impact > 0.1). In the P group, five metabolic pathways were altered compared to the NP group: glycerolipid metabolism; aminoacyl-transfer RNA (tRNA) biosynthesis; valine, leucine, and isoleucine biosynthesis; glycine, serine, and threonine metabolism; and glyoxylate and dicarboxylate metabolism. Matched serum metabolites and their impact on each pathway are listed in detail in Table 4.

Pathway topology of serum metabolites implicated in IgAN disease progression.
The y-axis represents the –log (p) value of the pathway enrichment analysis, and the x-axis represents the pathway impact value of topology analysis. (A) Glycerolipid metabolism. (B) Aminoacyl-transfer RNA biosynthesis. (C) Valine, leucine, and isoleucine biosynthesis. (D) Glycine, serine, and threonine metabolism. (E) Glyoxylate and dicarboxylate metabolism.
IgAN, immunoglobulin A nephropathy.

Metabolic pathways of serum metabolites associated with progression of IgAN
Pathway analyses of identified urinary metabolites
The 18 common urinary metabolites with VIP scores of >1.0 among comparison groups (control vs. IgAN and NP vs. P) were selected for pathway analysis. Topology-based metabolic pathway analyses computed the significance of alterations in each pathway as illustrated in Fig. 5. The most disturbed metabolic pathways were the valine, leucine, and isoleucine biosynthesis pathway and the aminoacyl-tRNA biosynthesis pathway. Detailed urinary metabolite levels and impact scores are presented in Table 5.
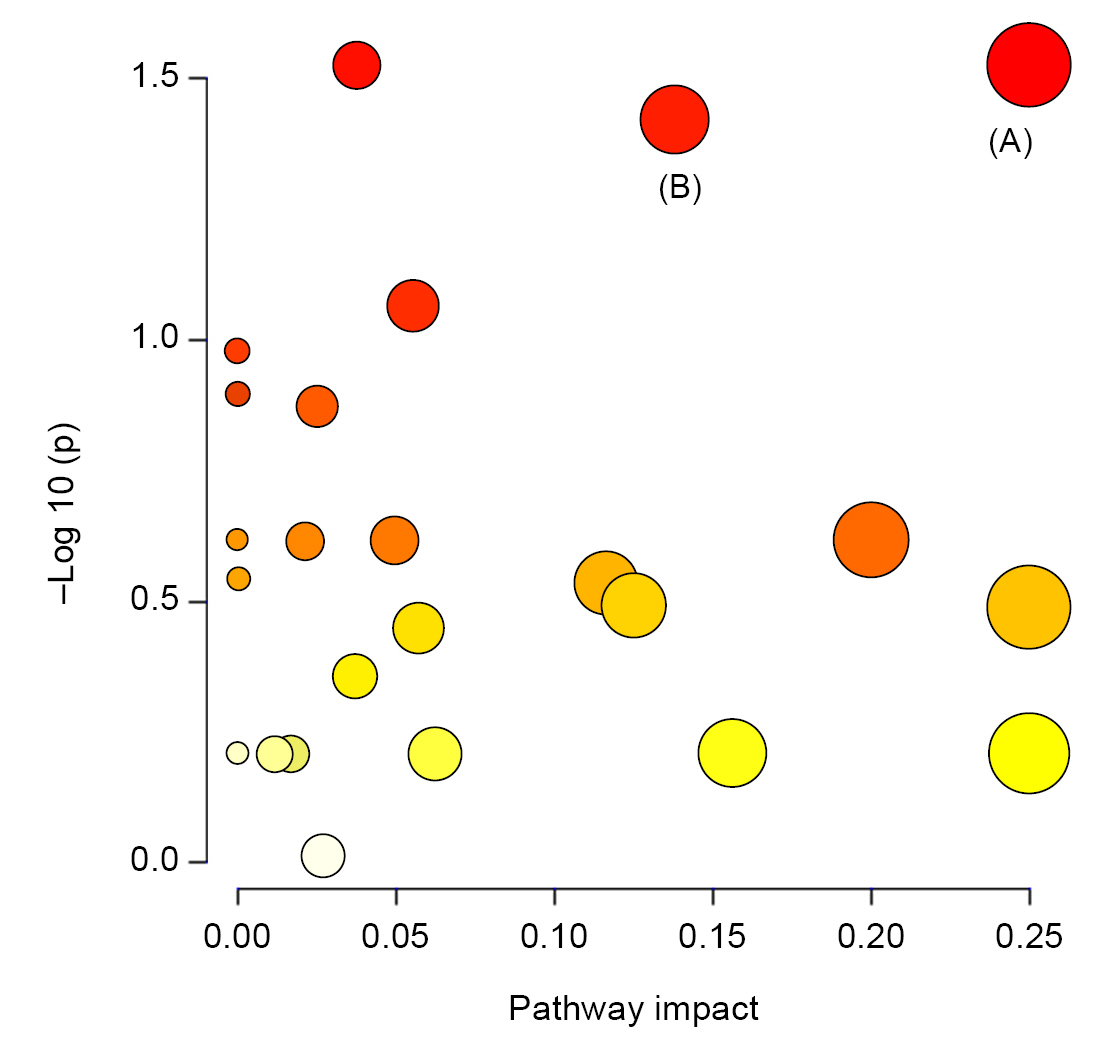
Pathway topology of urinary metabolites in disease progression of IgAN.
The y-axis represents the –log (p) value of pathway enrichment analysis, and the x-axis represents the pathway impact value of topology analysis. (A) Valine, leucine, and isoleucine biosynthesis. (B) Aminoacyl-transfer RNA biosynthesis.
IgAN, immunoglobulin A nephropathy.
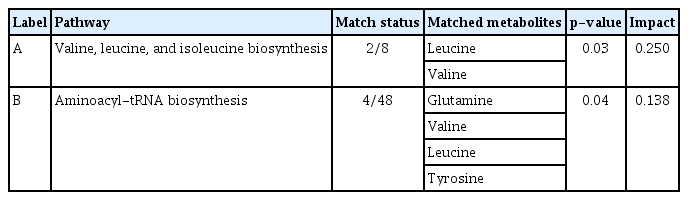
Metabolic pathways of urinary metabolites associated with progression of IgAN
Prediction of disease progression in immunoglobulin A nephropathy
Age, sex, baseline kidney function, proteinuria, and WHO classification were selected for univariate ROC analyses based on VIF values; among them, only proteinuria was higher than 0.7 in univariate analysis (Supplementary Table 5, available online). The AUC of six serum metabolites (glycerol, threonine, glycine, formate, valine, and acetone) and of urinary leucine and valine was also higher than 0.7. Although adding the identified metabolites to all clinical variables did not provide better predictive power, adding the serum or urinary metabolites to proteinuria improved predictive performance compared to proteinuria alone (Supplementary Table 6, available online). The multivariate prediction model including proteinuria and serum or urinary metabolites with an AUC greater than 0.8 showed the largest improvement in predictive performance (Supplementary Table 6, available online). The AUC for the combination of serum glycerol, threonine, and proteinuria was 0.923 (95% confidence interval [CI], 0.67–1.00) for disease progression of IgAN (Fig. 6B). Sensitivity and specificity were 70% and 90%, respectively. The ROC curve for the combination of urinary leucine, valine, and proteinuria had an AUC of 0.91 (95% CI, 0.67–1.00) with 80% sensitivity and 70% specificity (Fig. 6C).
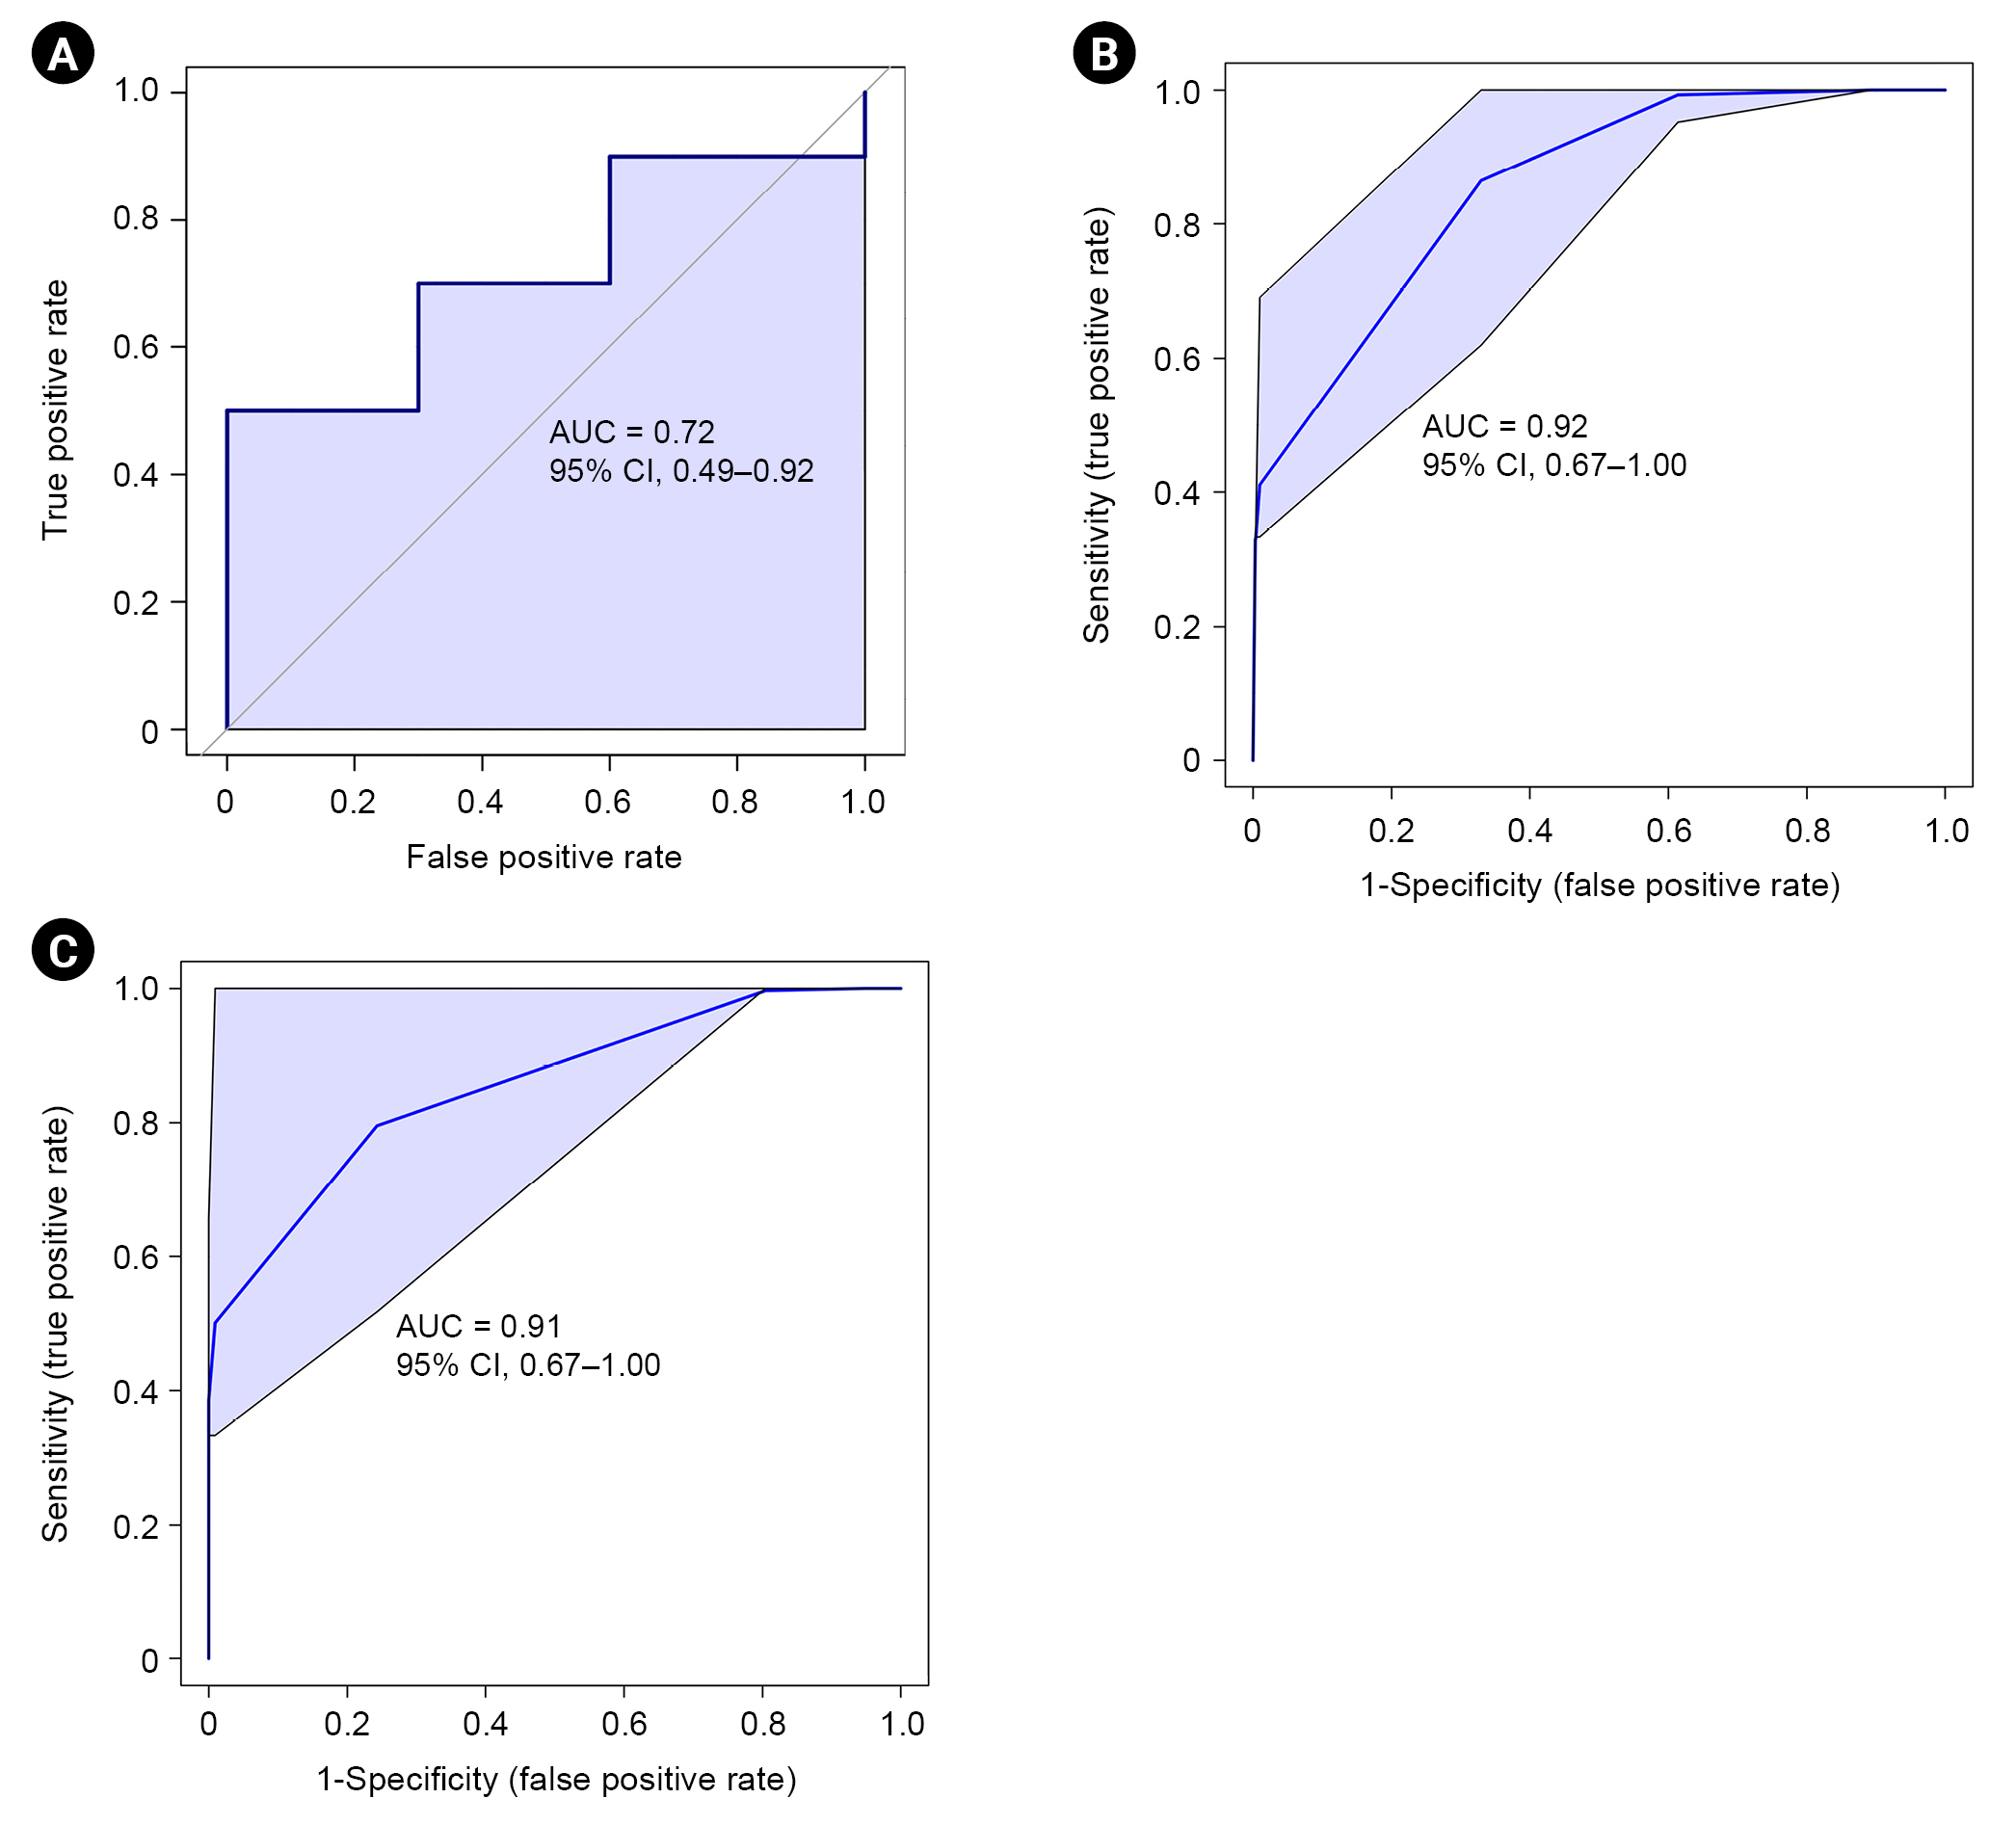
Multivariate ROC curves for prediction of IgAN progression.
(A) Using proteinuria alone (n = 20). (B) Using proteinuria and identified serum metabolites, glycerol and threonine (n = 20). (C) Using proteinuria and identified urinary metabolites, leucine and valine (n = 20).
AUC, area under the curve; ROC, receiver operating characteristic; IgAN, immunoglobulin A nephropathy.
Discussion
In the current study, we identified unique serum and urinary metabolic profiles in the rapidly progressive IgAN group. We identified 22 serum and 20 urinary metabolites that differed between the control and IgAN groups. Among these, 17 serum and 18 urinary metabolites that also showed a significant difference between the NP and P groups were selected, and additional pathway analyses were performed to identify the metabolites associated with IgAN disease progression. Several metabolic pathways associated with IgAN disease progression were identified using integrated metabolomics analyses. The predictability of IgAN progression was most enhanced for the combination of proteinuria with serum glycerol and threonine or urinary leucine and valine.
IgAN has a heterogeneous clinical presentation and natural course, making it difficult for physicians to predict disease progression. Kidney Disease: Improving Global Outcomes (KDIGO) guidelines proposed use of the International IgAN Prediction Tool for risk assessment in patients with primary IgAN [20]. Since this is based on histological and clinical data at the time of kidney biopsy, it is unclear whether dynamic changes during follow-up will be reflected in the initial biopsy. Indeed, in clinical practice, nephrologists are often faced with situations that require reassessment due to an abrupt increase in proteinuria or serum creatinine level. Histological changes may be followed by accumulation of metabolites from the disrupted pathways. Consequently, prognosis may be underestimated depending on the timing of the biopsy.
Metabolomics is a technology that has recently been applied in several areas of nephrology [7,11,21–24]. Several efforts have been made to identify diagnostic and prognostic markers of IgAN through metabolomics [13,14,16]. However, these studies involved diverse patient groups, and the follow-up periods were short. To predict disease progression, it is necessary to clearly distinguish between patients with and without progressive disease. Sui et al. [13] evaluated potential serum biomarkers by comparing 1H-NMR spectroscopy results between low-risk and high-risk IgAN patient groups. They identified IgAN-specific metabolic profiles in both groups in comparison with healthy controls; however, no metabolite differed significantly between the low- and high-risk groups. IgAN patients were classified solely based on histopathology according to the WHO diagnostic system for kidney biopsy [13]. In the present study, long-term clinical course was based on analyses of serum and urine samples at the time of diagnosis, and we were able to avoid the use of additional invasive methods. Furthermore, pathway analyses were performed to elucidate the functional pathways of the metabolic profiles identified using 1H-NMR spectroscopy.
Valine and leucine are branched-chain amino acids (BCAAs) whose serum concentrations have been shown to simultaneously drop as eGFR declines [25,26]. In CKD, metabolic acidosis is considered the main cause of amino acid degradation in skeletal muscles [27]. Previous animal experimental studies supporting this hypothesis have revealed 5/6 Nx-induced reductions in the levels of leucine and valine in rats that developed uremia and metabolic acidosis compared to those without metabolic acidosis [28]. Contrarily, another study on amino acid metabolomics reported that serum leucine and valine levels did not differ between patients with CKD stage 2–3 vs. 4–5, although serum hydrogen carbonate (HCO3) levels were different between the two groups [23]. Interestingly, we found significant group differences in BCAA metabolites even though kidney function was similar in the two groups at the time of diagnosis. This indicates that perturbed metabolic pathways (and not uremia) contribute to disease progression in IgAN. Furthermore, we observed increased urine levels of valine, which may reflect the decreased serum levels (Supplementary Tables 2, 4; available online). Duranton et al. [23] reported that the urinary excretion of valine is associated with proteinuria. Consistent with this, the P group in our study had more proteinuria than the NP group. Potential metabolic pathways involving leucine and valine include BCCAbiosynthesis and aminoacyl-tRNA biosynthesis; therefore, impairment of these metabolic pathways may play a role in progression of IgAN associated with proteinuria. Moreover, as urine leucine and valine improved predictive performance in multivariate ROC analysis, they appear to have a prognostic role in disease progression of IgAN.
The results of our metabolomics study revealed significantly increased serum levels of formate alongside altered glyoxylate and dicarboxylate metabolism. Formate is mostly derived from the degradation of serine and the metabolic activities of the intestinal microbiome in humans [29]. In addition, urinary excretion of formate occurs via anion transporters in proximal tubular cells. A metabolomics study in rats showed that the plasma level of formate was significantly increased in a CKD rat model [30]. Those authors proposed that high levels of organic acids, including formate, are associated with metabolic acidosis in CKD rats. As mentioned above, kidney function was similar between groups in our study. Thus, formate may have a pathological role in abnormal metabolic pathways and not simply be produced in response to metabolic acidosis.
Glycine is a simple amino acid biosynthesized from serine. Several decades of in vivo experiments have demonstrated that glycine plays a protective role in the kidney [31–33]. A recent investigation of an Nx rat model revealed that altered glycine metabolism via the gut microbiota is associated with kidney function and hypertension [34]. The authors of that study reported higher serum levels of glycine-conjugated metabolites derived from the gut microbiome in CKD rats. In a metabolomics study involving humans, urinary glycine level was lower in CKD patients [35]. Park et al. [16] performed metabolomics analyses of urine samples from healthy control, patients with IgAN, membranous nephropathy, minimal change disease, and lupus nephritis to identify IgAN-specific biomarkers; they found that patients in the IgAN group had significantly higher urinary glycine level associated with a lower risk of reduced kidney function. However, in our study, there was no significant difference in the urinary concentration of glycine between the P and NP groups. Inconsistent results need to be interpreted in light of the major differences between two studies. These include IgAN patients who were younger and had higher levels of eGFR and proteinuria in the previous study than in our study. In addition, comparisons of the concentration of metabolites between the two studies are complicated because Park et al. [16] reported concentrations of urinary metabolites as creatinine-adjusted concentrations. In the current study, we found that the absolute concentration of serum glycine was significantly lower in the P group than in the NP group and associated with disease progression based on ROC analysis. Although it is unclear if excessive urinary glycine excretion leads to a lower serum concentration of glycine, significant differences in both serum and urinary glycine implicate altered metabolism of glycine in the disease progression of IgAN. Further mechanistic work is required to interrogate the biological role of glycine in IgAN nephropathy. Aminoacyl-tRNA biosynthesis pathway and glyoxylate and dicarboxylate metabolic pathways were identified as disturbed glycine-related metabolic pathways.
Threonine is an essential amino acid and a component of IgA. Previous studies have suggested that threonine is responsible for mucin synthesis and that it regulates the immune response by modulating inflammatory cytokines in animal intestines [36]. In a human study, threonine was identified as a metabolite associated with rapid deterioration of kidney function in CKD patients [11]. Since the only source of threonine is dietary intake, low levels of threonine represent high metabolic consumption of threonine in humans assuming a normal diet. In the current study, valine, leucine, and isoleucine biosynthesis; glycine, serine, and threonine metabolism; and aminoacyl-tRNA biosynthesis were identified as altered metabolic pathways associated with threonine. Further research is needed to determine whether the abnormal metabolism of threonine forms the basis of the pathogenesis of progressive IgAN or is a defense mechanism to maintain homeostasis due to progressive disease.
We identified perturbed glycerolipid metabolism as being associated with aggravation of IgAN. Glycerol is considered a nephrotoxic substance that induces oxidative stress and apoptosis in endothelial and tubular epithelial cells and is used for this purpose in acute kidney animal models [37,38]. Interestingly, serum glycerol level was significantly lower in the P group than in the NP group in our study. Compared to healthy controls, the IgAN group had a lower serum glycerol level; this implies that a low glycerol level is a consequence of an altered metabolic pathway rather than a contributing factor to disease progression in IgAN. A recent study using metabolomics and proteomics demonstrated that glycerolipid metabolism was altered in patients with DKD and that glycerol-3-galactoside showed a significant association with development of DKD [39]. In the current study, serum glycerol was significantly associated with disease progression in IgAN, despite having the same altered metabolic pathway as in a previous study on DKD. The addition of serum glycerol and threonine to proteinuria, which is commonly used as a clinical indicator of kidney function deterioration, showed strong predictive performance. Based on the results of multivariate ROC analysis, we suggest that serum glycerol and threonine be used as predictive indicators of IgAN progression.
The present study had several limitations that should be considered. First, we analyzed only a small number of patients. Therefore, unmeasured confounding factors, such as dietary patterns and previous medications, could have affected our findings. Our results should be validated by additional studies with larger number of patients and longitudinal biospecimens. However, our study has methodological utility as we stratified IgAN patients according to prognosis and observed distinctive metabolic fingerprints despite the small number of subjects included. Second, the International IgAN Prediction Tool could not be validated because our data did not include MEST histological score. Therefore, we could not compare the predictive power of identified metabolites and International IgAN Prediction Tool. Furthermore, the relationships between pathologic findings and identified metabolites were not evaluated. Third, long-term sample storage was unavoidable because of the study design, and the effects of long-term storage on metabolic profiles have not been systematically investigated. Furthermore, because our study investigated only the Korean population, it is not appropriate to generalize the current results to other ethnic groups. Finally, this is the first step in identification of biomarkers of disease progression in IgAN. Untargeted metabolomics can reveal novel and unanticipated metabolic pathway perturbations. However, not all metabolites are indicative of disease progression because of the sensitivity of metabolomics. Further targeted metabolomic studies, external validation in independent cohorts, and mechanistic studies such as in vitro and animal studies are warranted to distinguish which metabolites are true biomarkers responsible for disease progression and to elucidate the mechanism(s) of disease progression.
Collectively, this untargeted metabolomics study identified serum and urinary metabolomics signatures of progressive IgAN that can help predict prognosis early in the clinical course of this disease. Furthermore, we identified impacted metabolic pathways involving the identified metabolites. Despite some of the limitations mentioned above, a strength of our study is the identification of metabolites related to progression of IgAN based on a clinical progression of 5 years or more. Furthermore, given that the metabolic signatures were established based on samples collected at the time of initial diagnosis, we were able to predict IgAN prognosis early in the clinical course. Additional prospective longitudinal and large-scale studies are required to verify that the biomarkers we identified are accurate predictors of IgAN disease progression.
Acknowledgements
The biospecimens and data used in this study were provided by the Biobank of Pusan National University Hospital, a member of the Korea Biobank Network.
Notes
Conflicts of interest
All authors have no conflicts of interest to declare.
Funding
This research was funded by the Biomedical Research Institute of Pusan National University Hospital (grant number, 20200230).
Data sharing statement
The data presented in this study are available on request from the corresponding author.
Authors’ contributions
Conceptualization, Methodology: YHJ, SSB, MH, EYS, SHS
Formal analysis, Data curation: SL, SK
Funding acquisition: YHJ
Investigation: YHJ, DWK, MH, EYS
Supervision: SHS
Writing–original draft: YHJ, SL
Writing–review & editing: SK, SSB, SHS
All authors read and approved the final manuscript.
Supplementary Materials
Supplementary data are available at Kidney Research and Clinical Practice online (https://doi.org/10.23876/j.krcp.22.146).