Body water percentage from childhood to old age
Article information

Abstract
Background
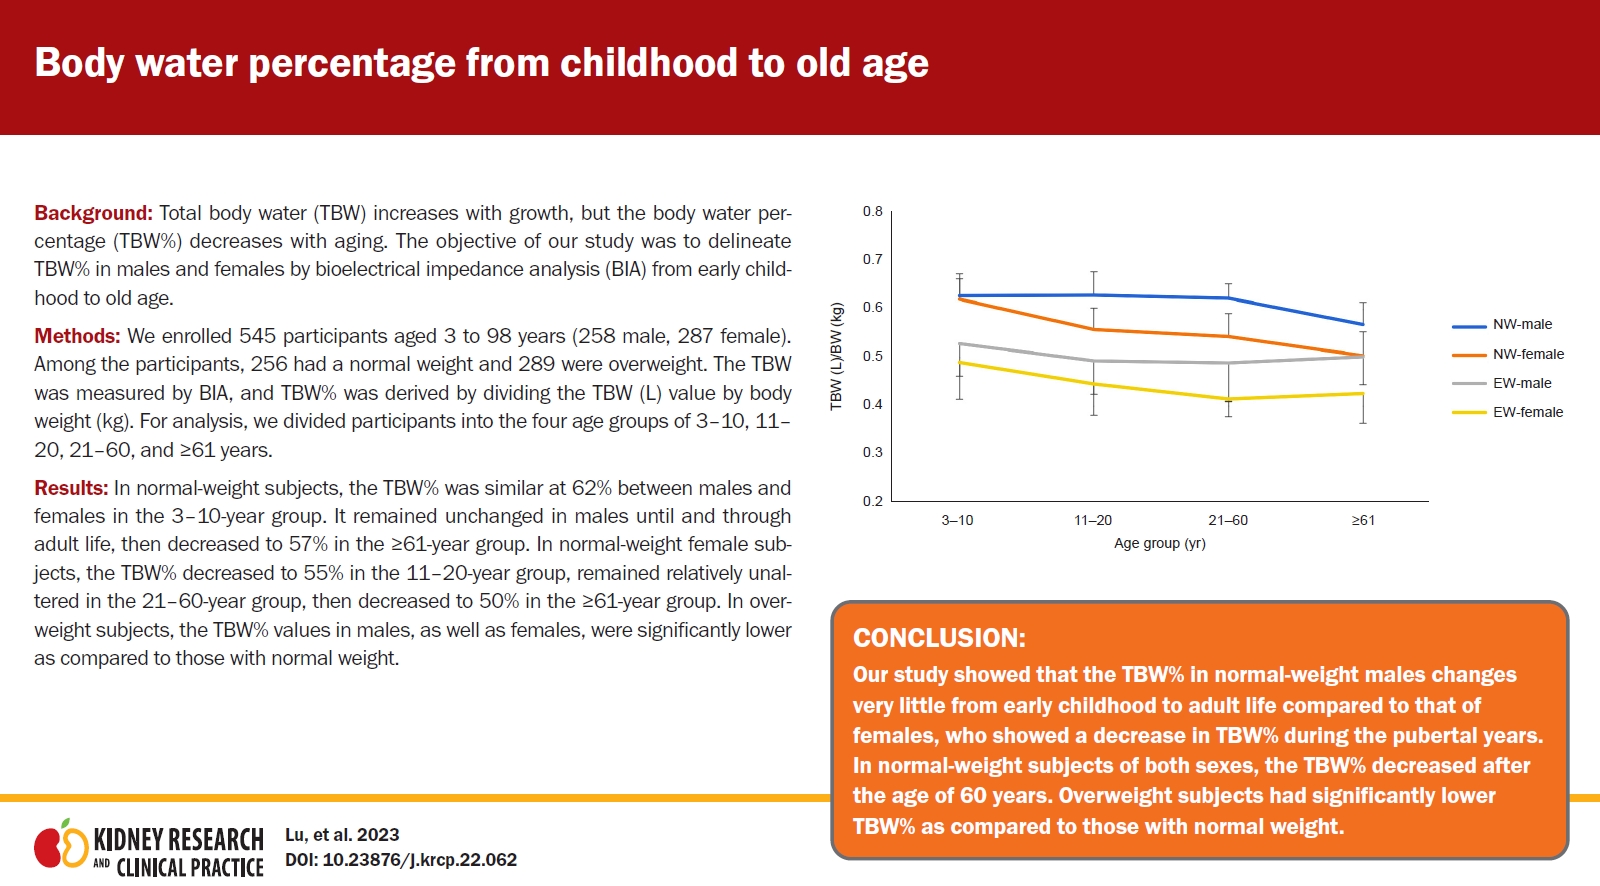
Total body water (TBW) increases with growth, but the body water percentage (TBW%) decreases with aging. The objective of our study was to delineate TBW% in males and females by bioelectrical impedance analysis (BIA) from early childhood to old age.
Methods
We enrolled 545 participants aged 3 to 98 years (258 male, 287 female). Among the participants, 256 had a normal weight and 289 were overweight. The TBW was measured by BIA, and TBW% was derived by dividing the TBW (L) value by body weight (kg). For analysis, we divided participants into the four age groups of 3–10, 11–20, 21–60, and ≥61 years.
Results
In normal-weight subjects, the TBW% was similar at 62% between males and females in the 3–10-year group. It remained unchanged in males until and through adult life, then decreased to 57% in the ≥61-year group. In normal-weight female subjects, the TBW% decreased to 55% in the 11–20-year group, remained relatively unaltered in the 21–60-year group, then decreased to 50% in the ≥61-year group. In overweight subjects, the TBW% values in males, as well as females, were significantly lower as compared to those with normal weight.
Conclusion
Our study showed that the TBW% in normal-weight males changes very little from early childhood to adult life compared to that of females, who showed a decrease in TBW% during the pubertal years. In normal-weight subjects of both sexes, the TBW% decreased after the age of 60 years. Overweight subjects had significantly lower TBW% as compared to those with normal weight.
Introduction
Body water is critical for maintaining normal physiological functions. The amount of total body water (TBW) in an individual varies according to age, sex, and body fat content. Assessing body water is important in clinical practice for diagnosing dehydration or fluid overload. Many of the medications are administered with their dosage based on their presumed volume of distribution, i.e., water as a percentage of total body weight. The same is true in calculations of body water and solute deficits.
There are several methods for measuring body water content, including the isotope dilution technique, nuclear magnetic resonance imaging, and bioelectrical impedance analysis (BIA) [1,2]. In the absence of any gold-standard method, the deuterium dilution method is considered the reference method for body water measurement. This method is based on the principle of water distribution in all parts of the body except fat. It requires the administration of an isotope into the body by ingestion or intravenously and the collection of a blood, saliva, or urine sample after a period of equilibration. The major limitations inherent with the dilution method include that it is time-consuming and requires ingestion of an isotope and collection of a biological specimen. As a result, this method cannot be used consistently in routine ambulatory clinic settings, particularly in younger children and elderly people.
BIA is a noninvasive method for body water measurement that measures the resistance and reactance of body tissue to an imperceptible low-intensity alternating current as it traverses through the body. Resistance to the electric current comes from body water (extracellular and intracellular), and the reactance is a result of a brief delay caused by cell membranes, which is also called capacitance [3,4]. A low-frequency current is used for measuring extracellular water, whereas a high-frequency current is used for measuring the TBW (intracellular and extracellular). The amount of intracellular water is calculated by subtracting the extracellular water content from the TBW. In comparison to the previously used single-frequency BIA method, the currently used multifrequency BIA method is believed to yield more accurate results [5]. Studies have shown that BIA results are comparable to those attained by the dilution method in both children and adults [3,4].
BIA provides a reliable estimate of TBW in most conditions and is an easy, inexpensive, safe, and portable method to deploy [6]. BIA works well in healthy participants and in patients with stable water and electrolyte balances [7,8]. Many studies have confirmed a good overall agreement between the results of dilution techniques and BIA in healthy children as well as adults, hospitalized elderly patients, and children with obesity [9–14]. Prior studies on body water content have grouped patients on the basis of their weight (normal, obese, and extreme or morbid obesity as well as weight loss after gastric bypass surgery for extreme obesity) [15]. In our previous study, we reported the feasibility of data collection by BIA in ambulatory clinic settings and the impact of excessive weight on TBW in children and young adults [16].
The main objective of this study was to delineate TBW% values in normal-weight and overweight male and female participants by BIA from early childhood to old age, which, to the best of our knowledge, has not been done before.
Methods
This prospective study included 335 children and young adults recruited from the Nephrology Clinic at the Children’s Hospital of Michigan or the Pediatric Clinic of the Wayne State University Physician Group and 210 adults recruited from the Wayne State University Physician Group clinic, Geriatric Clinic of University Health Center, or the St. Patrick Senior Center. The study protocol was approved by the Institutional Review Board of the Wayne State University (No. #092314MP2E). Depending on age, consent/assent forms were signed by participants or their legal guardians.
Normal-weight or overweight (including obese) participants aged ≥3 years were included in the study. We excluded patients with diabetes; dehydration as assessed by history, physical examination, or blood pressure measurement; the presence of an internal defibrillator or pacemaker; missing limbs; menstruation or pregnancy; or chronic kidney disease or another known comorbid condition as well as those taking medications that affect the body water content, such as glucocorticoids. Children with hypertension were also excluded from this study, whereas adults with hypertension on antihypertensive medications only were included in the study. Children on diuretics were excluded from this study, whereas adults on a low-dose diuretic (12.5 mg/day) or chlorthalidone (15 mg/day) for hypertension only were included in the study. Patients with a recent history of moderate exercise or consumption of a big meal within 2 hours before the procedure were also excluded from data collection. Any formal exercise or sports activity was considered moderate exercise. Any meal larger than breakfast or a light lunch was considered a big meal.
Height and weight were measured. Body weight was defined on the basis of body mass index (BMI) as normal weight (BMI of <85th percentile in children or <25 kg/m2 in adults), overweight (BMI of ≥85th–95th percentile in children or 25–29 kg/m2 in adults), and obesity (BMI of ≥95th percentile in children or ≥30 kg/m2 in adults) according to the U.S. Centers for Disease Control and Prevention guidelines (https://www.cdc.gov/growthcharts/). Overweight participants in our study included both overweight and obese individuals. TBW% was derived by dividing the TBW (L) value by body weight (kg).
The InBody s10 direct segmental multifrequency BIA device (InBody Co., Ltd.) was used in this study. Measurements were gathered in temperature-controlled offices while the patient sat on an examination table with their legs hanging and arms and legs abducted. Before measurement, study participants were asked to void and sit down for 10 to 15 minutes on the examination table. Touch-type electrodes were placed on participants’ feet near the ankles and hands near the wrists, and current frequencies of 50, 100, 500, and 1,000 kHz at five segments (right arm, left arm, right leg, left leg, and trunk) were applied for a total period of about 1.5 minutes until completion of the recording, which was indicated on the screen and with a beeping sound. The same BIA machine was used for data collection from all study participants.
We evaluated our cohort by broadly classifying them into four groups partly based on the ages during which the TBW is known to change [6,8]. As such, the study groups included a prepubertal group (3–10 years), pubertal group (11–20 years), adult group (21–60 years), and elderly group (≥61 years). Study results were analyzed using the NCSS version 11.0 (NCSS Statistical Software; NCSS, LLC, Kaysville, UT, USA). Student t test or the Mann-Whitney U test was used to study the quantitative variables between two groups, and Pearson product-moment correlation was used to study the correlation between BIA parameters.
Results
The study included 545 participants aged 3 to 98 years. The mean ages for various age groups were 6.6 ± 2.17 years (3–10-year age group), 14.4 ± 2.39 years (11–20-year age group), 35.3 ± 14.4 years (21–60-year age group) and 74.8 ± 9.1 years (≥61-year age group), respectively. Male and female participants totaled 258 and 287, respectively, while numbers of normal-weight and overweight participants totaled 256 and 289, respectively. There were significant differences in weight and BMI between the normal-weight and overweight participants across all age groups (all p < 0.001). Further details of the demographic data are shown in Tables 1 and 2.

Demographic details for various age groups
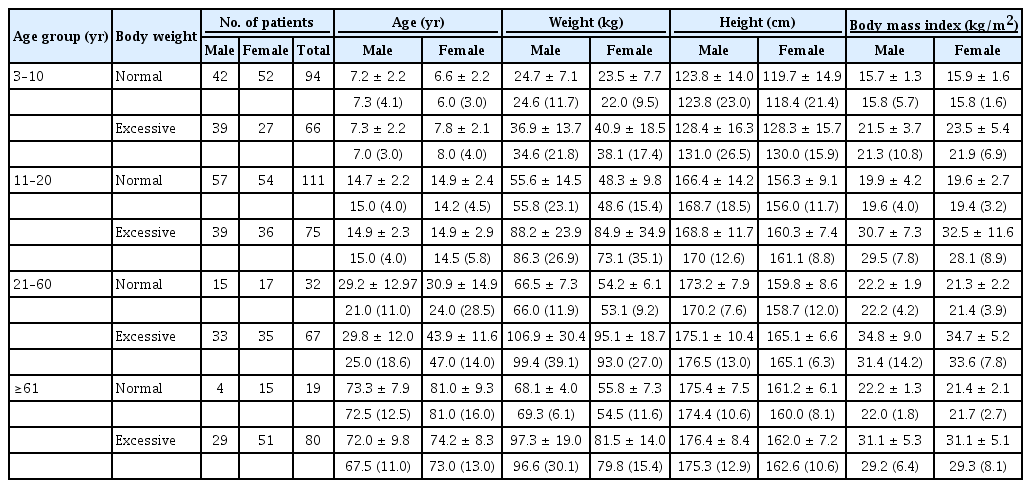
Demographic details based on weight
The mean TBW (L) in normal-weight females was significantly lower than that in normal-weight males across all age groups (p < 0.01) except the 3–10-year age group. Similarly, the mean TBW (L) was also significantly lower in overweight females compared to overweight males across all age groups (p < 0.01) except in the 3–10-year age group (Table 3).
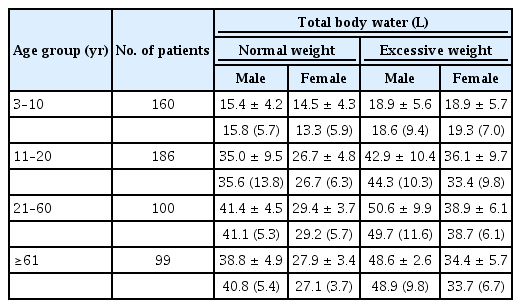
Total body water (L) in males and females with normal and excessive weight in each age group
As shown in Table 4 and Fig. 1, in normal-weight study participants, the TBW% was very similar at 62% between males and females in the 3–10-year age group. In males, it remained unchanged thereafter before decreasing to 57% in the ≥61-year age group. Conversely, in normal-weight females, the TBW% decreased significantly to 55% in the 11–20-year age group, remained relatively the same in the 21–60-year age group, then decreased to 50% in the ≥61-year age group.

Mean TBW (L)/BW (kg) in each group
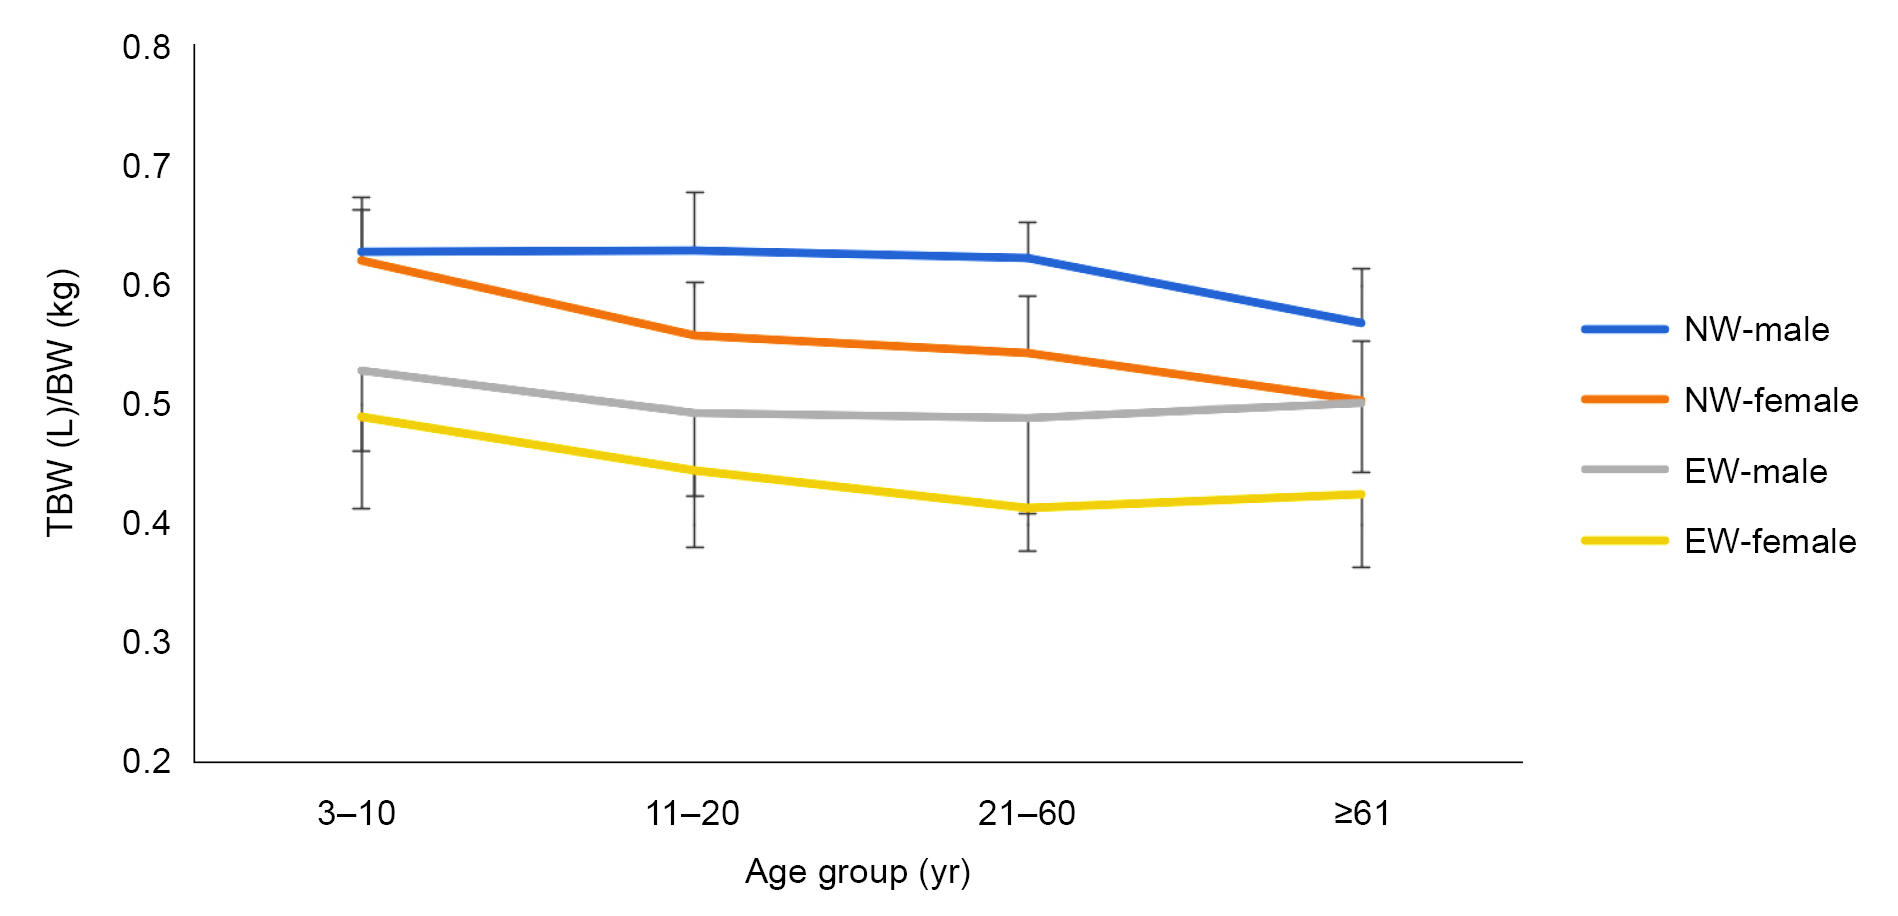
Trends in TBW (L) per BW (kg) at various age groups.
BW, body weight; NW, normal weight; EW, excessive weight including overweight and obesity; TBW, total body water.
In overweight study participants, the TBW% was lower for males as well as females in all age groups. In the 3–10-year age group, the TBW% was slightly higher for males (53%) compared to females (49%). Thereafter, it decreased in males in the 11–20-year age group (49%) before remaining fairly similar in the 21–60-year (49%) and ≥61-year (50%) age groups. In overweight females, it decreased slightly in the 11–20-year (45%) and 21–60-year (41%) age groups, with not much change thereafter (Table 4, (Fig. 1).
Discussion
It is well-known that TBW increases with growth and that the TBW% is reduced from about 80% at birth [17] to about 60% in adult men and 50% in adult women [18]. Very little data are available about the TBW% in the elderly population, although one study suggests it may be as low as 46% in males and 43% in females [19]. The changes in TBW% that occur with aging have been documented by previous studies, including those that used the dilution method [14]. However, no study to date has evaluated TBW% by any method across the full age spectrum of childhood to old age. This is likely because of the logistical limitations in studying all age groups and the complexity of methods that are not feasible to deploy in ambulatory clinic settings, particularly in young children and elderly people.
BIA made it possible for us to study TBW in ambulatory settings in participants ranging from 3 to 98 years of age. Our study revealed that the TBW% in normal-weight males changes very little from the age of 3 years to adult life (21–60 years), while normal-weight females showed a significant decrease of the TBW% in the 11–20-year age group. This is because of a relatively greater increase in body fat during pubertal growth in girls compared to boys [20]. Both sexes showed a steady decline of the TBW% in the ≥61-year age group to 57% in males and 50% in females, which is due to a reduction in muscle mass.
Our results are similar to those of studies that used dilution methods to measure TBW% values in different age groups [20–22]. Pierson and Lin reported a dramatic drop in TBW% from >0.75 at birth to <0.65 at around the age of 1 year in both boys and girls [23]. We did not study this age group because BIA is designed for application to children aged ≥3 years only. The same study also noted a steady decrease in TBW% to <0.6 in (both male and female) adolescents. In another study conducted by dilution method, Haschke [24] reported that the TBW% did not change significantly in males between 10 and 14 years of age, who presented an average TBW% of 0.64, which is similar to our result measured in normal-weight males of this age group. Novak [25] studied TBW% in adolescent boys and girls by dilution method, which showed an increase in boys from 0.621 (12–13 years) to 0.659 (17–18 years) but a reduction in girls, as seen in our study also, from 0.603 to 0.536 in the same age groups. Among normal-weight adults, a dilution study by Hume and Weyers [25] reported TBW% values of 0.602 ± 0.04 in males aged 40–69 years (n = 19) and 0.571 ± 0.08 in females aged 41–84 years (n = 17). Their study also recorded TBW% values in overweight adults, which were 0.524 ± 0.04 in males aged 35–71 years (n = 11) and 0.42 ± 0.05 in females aged 33–68 years (n = 13), respectively [25]. In another study conducted by dilution method, the TBW% in normal-weight males aged 32–67 years (n = 5) and females aged 30–67 years (n = 4) were 0.582 ± 0.04 and 0.494 ± 0.036, respectively [26].
The sex difference in TBW values among normal-weight individuals of various ages is well-known. Males have greater TBW values compared to females mainly because of their typically higher body weight and greater muscle mass. Similar differences exist in TBW% values between normal-weight males and females at all ages beyond early childhood. A higher TBW% in males compared to females is also attributed to the relatively increased fat-free mass, encompassing muscles and bones, found in men [27]. Our study also revealed that the TBW% was lower in all age groups in overweight (and obese) males and females compared to normal-weight participants. This is because excess body weight is the result of a relatively high percentage of body fat with a net decrease in fat-free mass and TBW for weight. Only 20% to 30% of body fat is water, while about 72% of the fat-free body mass is water [28].
As seen in our study, previous studies of adults have also revealed that overweight individuals have lower TBW% values and hence are hypohydrated compared to normal-weight individuals [15,29–31]. In our previous study of children and young adults, overweight individuals had a 16.5% higher mean TBW value for height and age and a 7.4% lower TBW value for weight and body surface area compared to normal-weight individuals [16]. Unlike in study subjects with normal weights, no further decrease in TBW% was noted in the present study in overweight males as well as females aged ≥61 years. Lower TBW% values in overweight and obese people are particularly important because obesity is increasing worldwide. More research is needed to study the impact of lower TBW% in overweight individuals and elderly people who have many other risk factors for dehydration.
BIA is not a reference method for measuring TBW and its use could be seen as a study limitation. However, as mentioned in the introduction section of this paper, the reliability of data collected by BIA has been validated by an increasing number of studies [32–34]. Furthermore, our study showed that TBW% measurement by BIA correlates with previously published studies of various age groups that used reference methods. BMIs in overweight study subjects aged ≥61 years of either sex were lower than those of younger age groups, which may have resulted in slightly higher TBW% values in this age group.
To our knowledge, this is the only study that offers a full profile on TBW% values from early childhood to old age, and we believe it provides a better perspective on age-related changes in TBW% and the potential risk of dehydration with aging. We were unable to recruit more normal-weight elderly participants because of a greater prevalence of obesity in the community and our study exclusion criteria, i.e., no diabetes or the use of medications (other than antihypertensives) in particular.
The accuracy of BIA in obese subjects has been questioned in the past [35]. In 2004, the European Society of Clinical Nutrition and Metabolism (ESPEN) recommended using BMI for TBW measurement only for individuals with BMIs of 16–34 kg/m2 [6]. However, studies published after the publication of ESPEN guidelines have reported that BIA accurately estimates TBW in overweight and obese participants, and this may be due to the advent of multifrequency BIA methods [36]. Nonetheless, TBW% may not be an ideal method for measuring body water in the presence of obesity. Most studies using the dilution method did not study TBW% in terms of body weight, so no data are available on TBW% in obesity across all age groups. Lastly, a relatively higher mean age among subjects ≥61 years old in our study could indicate an inadvertent patient selection bias.
In conclusion, our study showed that TBW% in normal-weight males changes very little from early childhood to adult life compared to that in females, who showed a reduction in TBW% during the pubertal years. In normal-weight individuals of either sex, the TBW% decreases after the age of 60 years. In overweight individuals, the TBW% was lower in all age groups when compared to that of normal-weight individuals. Unlike in normal-weight study participants, however, no further reduction in TBW% was noted in either overweight males or females aged ≥61 years.
Notes
Conflicts of interest
All authors have no conflicts of interest to declare.
Funding
This work was supported by The Children’s Foundation (grant No. R2-2017-28; https://yourchildrensfoundation.org/) for Tej K. Mattoo.
Data sharing statement
The data presented in this study are available on request from the corresponding author.
Authors’ contributions
Conceptualization: HL, TKM
Data curation, Formal analysis, Methodology, Validation: HL
Funding acquisition: TKM
Investigation: All authors
Resources: EA, PP, TKM
Writing–original draft: HL, TKM
Writing–review & editing: TKM
All authors read and approved the final manuscript.
Acknowledgements
We thank Ms. Lisa Saigh and her colleagues at the Detroit St. Patrick Senior Center for their help with data collection.