Validation of operational definitions of mortality in a nationwide hemodialysis population using the Health Insurance Review and Assessment Service databases of Korea
Article information

Abstract
Background
Health Insurance Review and Assessment Service’s (HIRA) claims data have been used in studies of hemodialysis patients even though information about mortality is not provided in this database. Mortality analysis using HIRA data has been conducted using various operational definitions that have not been validated. This study aimed to validate operational definitions of mortality for maintenance hemodialysis patients that have been used when analyzing the Korean HIRA database.
Methods
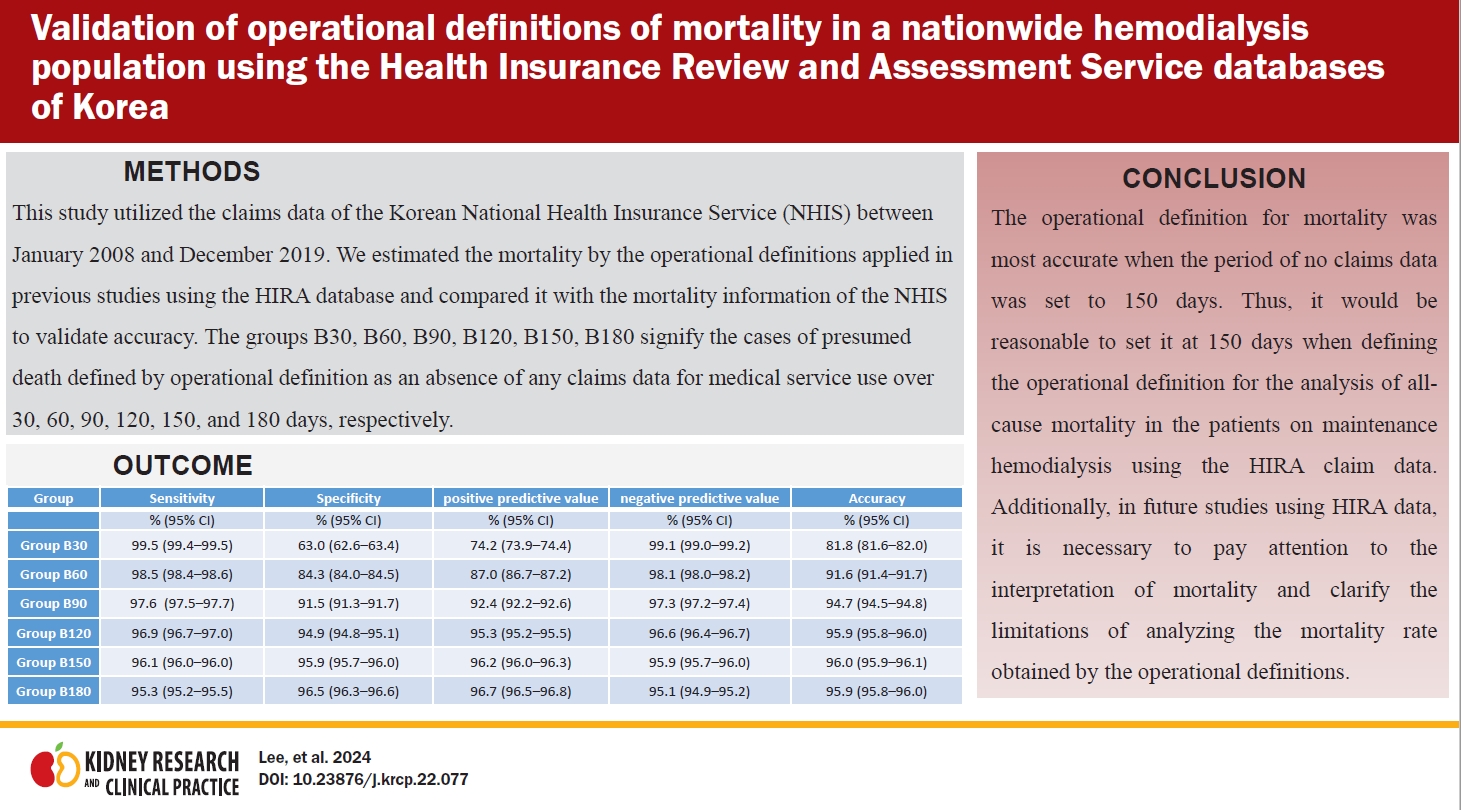
This study utilized claims data of the Korean National Health Insurance Service (NHIS) between January 2008 and December 2019. We estimated mortality based on operational definitions applied in previous studies using the HIRA database and compared it with NHIS mortality information to validate accuracy.
Results
A total of 128,876 patients who started maintenance hemodialysis between January 2009 and December 2019 were analyzed. The accuracy of estimated mortality was the highest at 96% in the group where mortality was defined as an absence of claims data for 150 days. If the period of no claims data was set to 90 days or less, there was a risk of overestimating the mortality for the entire study period. When it was set to 180 days or more, there was a risk of underestimating the mortality, as the follow-up time was close to the end of the study period.
Conclusion
When mortality analysis of maintenance hemodialysis patients is performed using HIRA data, it is most accurate to set the operational definition period as the absence of claims data for 150 days.
Introduction
National population-based studies using data from national health insurance systems can facilitate long-term tracking of the healthcare environment and the collected data can be used for numerous studies including outcome studies, epidemiological studies, and pharmacovigilance studies [1–3]. Korea has a universal, single-payer national health insurance system where the entire Korean population and healthcare providers are eligible to register for the national health insurance program comprising the National Health Insurance Service (NHIS) and Medical Aid [4,5]. In particular, the specific code (V001) assigned to hemodialysis (HD) patients is a useful tool to identify patients on maintenance HD in Korea, and several studies on this population have been conducted [6,7]. All medical claims for medical services issued by healthcare providers are reviewed and assessed by the Health Insurance Review and Assessment Service (HIRA), and the medical expenses are reimbursed by the National Health Insurance Cooperation (NHIC) [8]. Therefore, all medical claims data for medical services provided for dialysis patients enrolled in the national health insurance program or Medical Aid is stored and managed in the HIRA and NHIS databases. Using NHIS or HIRA databases, it is possible to identify every end-stage kidney disease (ESKD) patient within the entire Korean population and analyze the claims data of all ESKD patients on dialysis therapy.
Nevertheless, the HIRA database does not provide detailed information on mortality, whereas it can be obtained from the NHIS database. All-cause mortality is the most objectively measurable surrogate endpoint because it has minimal chance of being affected by bias in patient selection, missing data, or misclassification of the cause of death [9]. Although it is ideal to merge NHIS data with that from Statistics Korea to investigate the time of death as well as the cause of death [10–12], analysis of all-cause mortality is feasible based on mortality information from the NHIS database. In the Korean HD population, alternatively, studies on all-cause mortality have been conducted using HIRA data by defining all-cause mortality as death where no claims were made for a certain period of time such as 30 days, 90 days, or more than 180 days [13–16].
These operational definitions of mortality have been accepted based on the consensus that chronic dialysis patients would have died without the use of medical services for several months. However, this has yet to be verified. This study aimed to validate the operational definition period for mortality that has been used in the analyses of claims data in the HIRA database.
Methods
Data sources
This study utilized claims data in the NHIS database from January 2008 to December 2019. We collected demographic information, diagnostic codes based on the International Classification of Diseases, Revision 10 (ICD-10), procedure codes, and data on mortality of patients on maintenance HD. This study was approved by the Institutional Review Board (IRB) of Asan Medical Center (No. 2020-0576) and complied with the principles of the Declaration of Helsinki. Informed consent was waived by the IRB due to the anonymized and retrospective design of the study.
Data population
We defined ESKD patients as those with a diagnosis of chronic kidney disease (diagnosis code: N18 or N19) who underwent HD treatment (procedure code: O7020 or O9991) or those patients with the specific code of V001, indicating HD patients. We extracted claims data of maintenance HD patients who had HD treatment over 90 consecutive days between January 2008 and December 2019.
Study population
To identify incident HD patients aged over 19 years, we excluded patients less than 19 years old and patients who had a specific code for HD (V001) or procedure codes for HD (O7020, O9991) more than 90 days during the year before the initiation of HD treatment. Among them, we identified patients who started HD during the study period and maintained HD for at least 90 days. Patients who underwent kidney transplantation (KT) or peritoneal dialysis (PD) in the study period were also excluded. Therefore, we analyzed a total of 128,876 HD patients who continued HD over 90 days and remained on chronic HD till the end of the study period. Deceased patients, who were confirmed to be deceased during the study period based on analysis of the Certificate Database of NHIS, were assigned to group A. Deceased patients defined according to the period of absence of any claims data for medical service use were assigned to group B. A flow diagram for the selection of the study population is provided in Fig. 1.
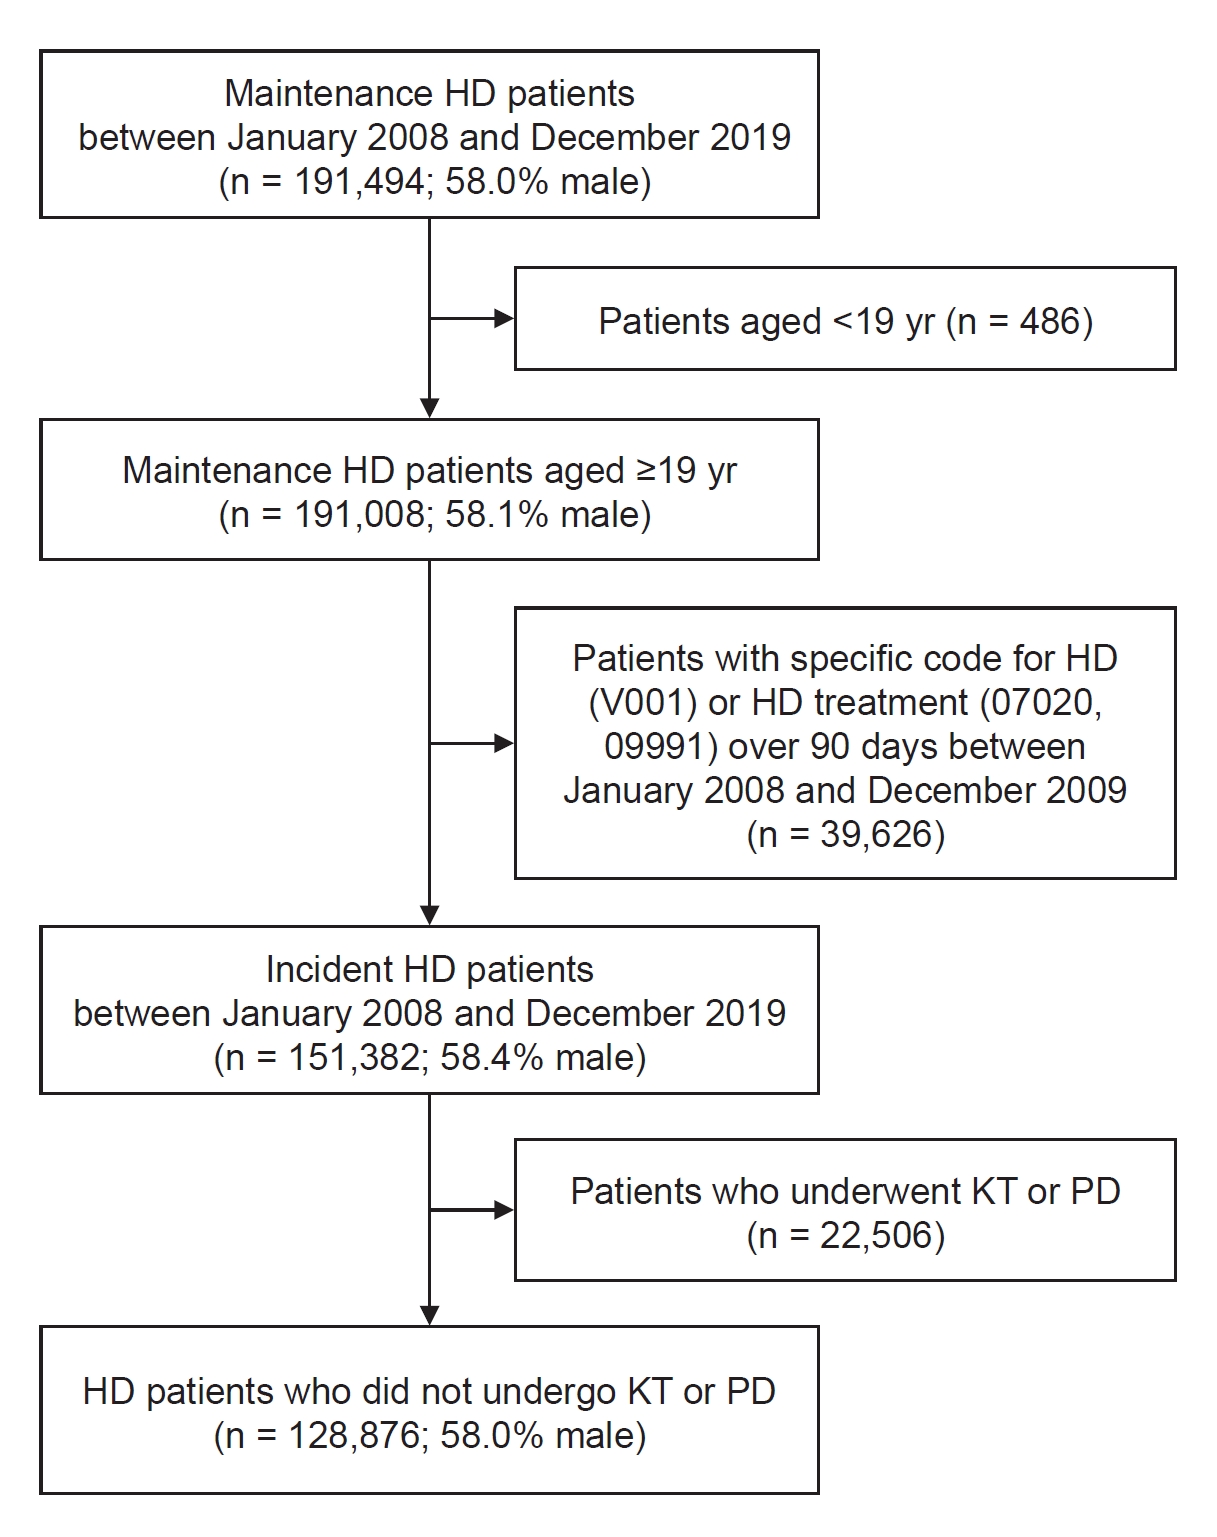
Diagram of the study cohort.
HD, hemodialysis; KT, kidney transplantation; PD, peritoneal dialysis.
Definitions
Patients on maintenance HD were defined as ESKD patients who underwent HD over 90 days. Mortality in group A was defined as patient death as identified in the NHIS database. In group B, mortality by operational definitions was defined as the absence of any claims data for medical service use over 30, 60, 90, 120, 150, and 180 days. Namely, groups B30, B60, B90, B120, B150, B180 comprised patients with presumed deaths defined by operational definition as the absence of any claims data for medical service use over 30, 60, 90, 120, 150, and 180 days, respectively. Mortality date by operational definition was defined as the first date of the period of the absence of any medical claims data for medical service use. If mortality was not identified at the end of the study period, December 2019, it was regarded as censored data. Patients who underwent KT or PD were defined as those who had codes related to KT (Z940, R3280) or procedure codes for PD (O7061, O7062, O7071, O7072) during the study period.
Statistical analysis
Demographic data are presented as frequencies in the case of categorical variables or as means and standard deviations or medians and interquartile ranges (IQRs) in the case of continuous variables. Sensitivity, specificity, positive predictive value (PPV), negative predictive value (NPV), and overall accuracy were calculated according to a 2 × 2 contingency table (Table 1). Patients’ survival probabilities were assessed by Kaplan-Meier survival analysis. Statistical analyses were performed using SAS Enterprise Guide version 7.1 (SAS Institute).

Two-by-two contingency table regarding the agreement in death classification between the NHIS and no insurances claims data for a specific period
Results
There were 151,382 (58.4% male) incident dialysis patients on maintenance HD between January 2009 and December 2019. Among these, 128,876 patients (58.0% male) had not undergone PD or KT. Mean follow-up period was 3.26 ± 2.8 years (median, 2.61 years; IQR, 0.97–4.93 years) and mean age was 66.09 ± 13.8 years. Among the total 128,876 patients, 66,520 deaths were identified in the NHIS data during the study period; these cases were assigned to group A. The all-cause mortality of groups during the study period is presented in Table 2. The total mortality of group B30 during the study period was 89,277, which was the largest difference compared with that of group A (n = 66,520), whilst the smallest difference was noted in group B150 (n = 66,514).

Mortality of incident patients on maintenance hemodialysis according to group classification
Sensitivity, specificity, PPV, NPV, and overall accuracy were calculated by comparing mortality between the A and B groups (Table 3). In groups B120, B150, and B180, accuracy was more than 95%, with group B150 showing the highest accuracy.

Sensitivity, specificity, PPV, NPV, and accuracy of groups defined based on operational definitions of mortality
We performed survival analysis based on Kaplan-Meier analysis; survival curves are depicted in Fig. 2. Mortality was overestimated in groups B30 and B60 compared to the registration information present in the NHIS data (group A). Group B90 had a greater risk of mortality rate overestimation than groups B120, B150, B180 as well as the lowest overall accuracy (Fig. 3).
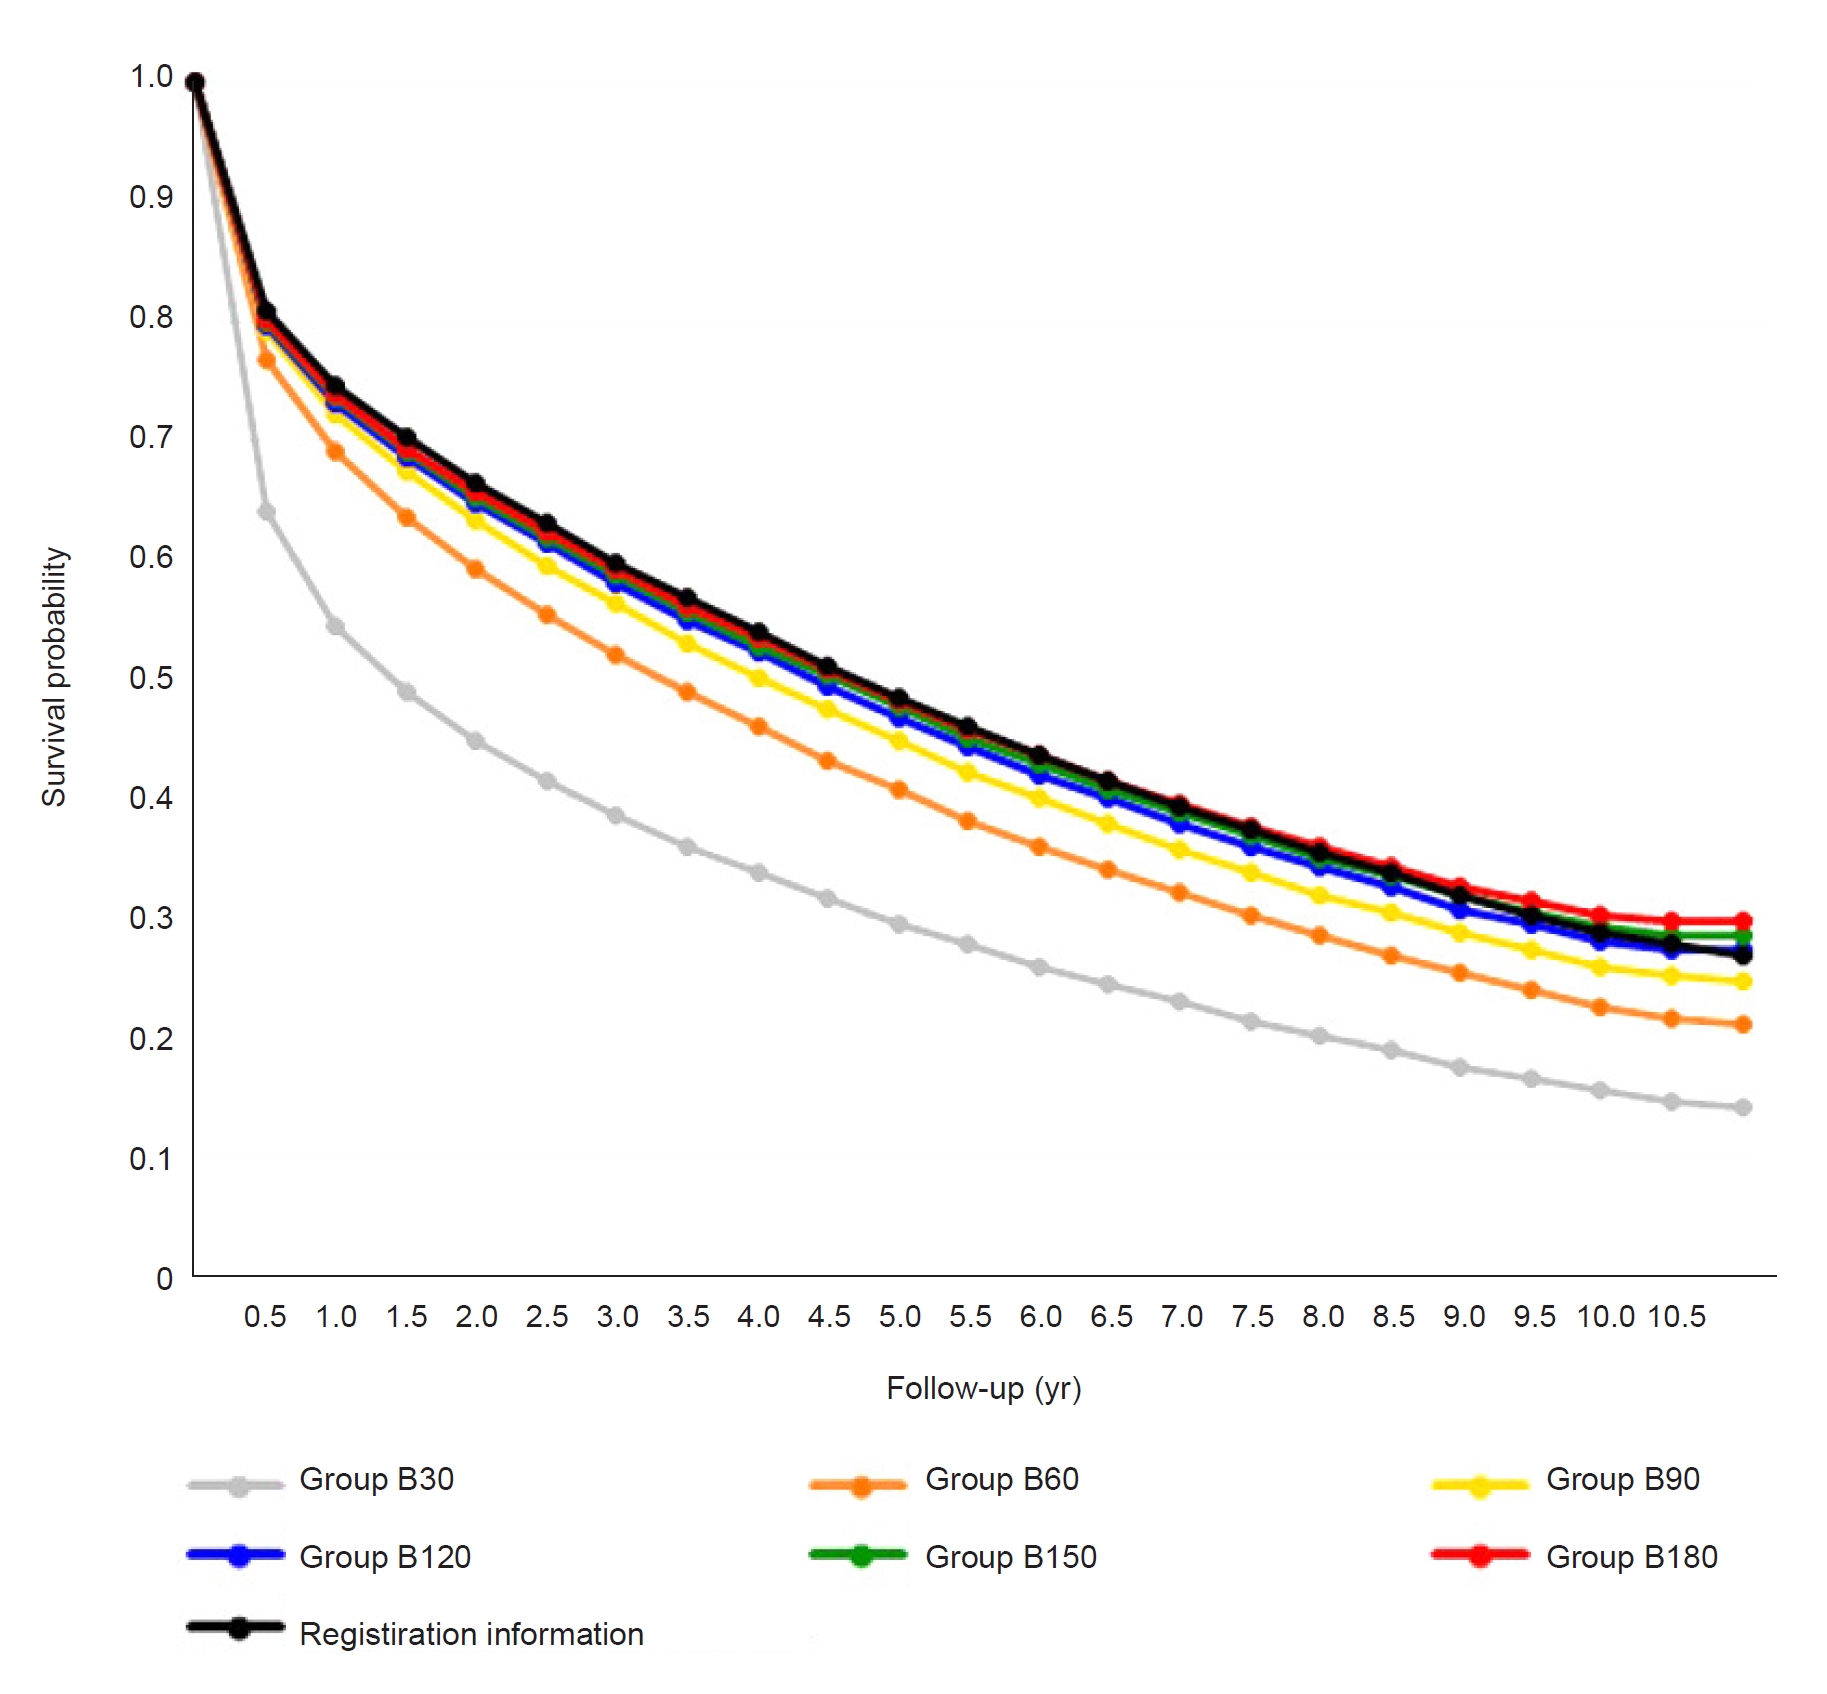
Survival curves for all groups.
Registration information; the survival curve of group A is the reference. Groups B30, B60, B90, B120, B150, and B180 are patient groups with presumed deaths defined by operational definition as the absence of any claims data for medical service use over 30, 60, 90, 120, 150, and 180 days, respectively.
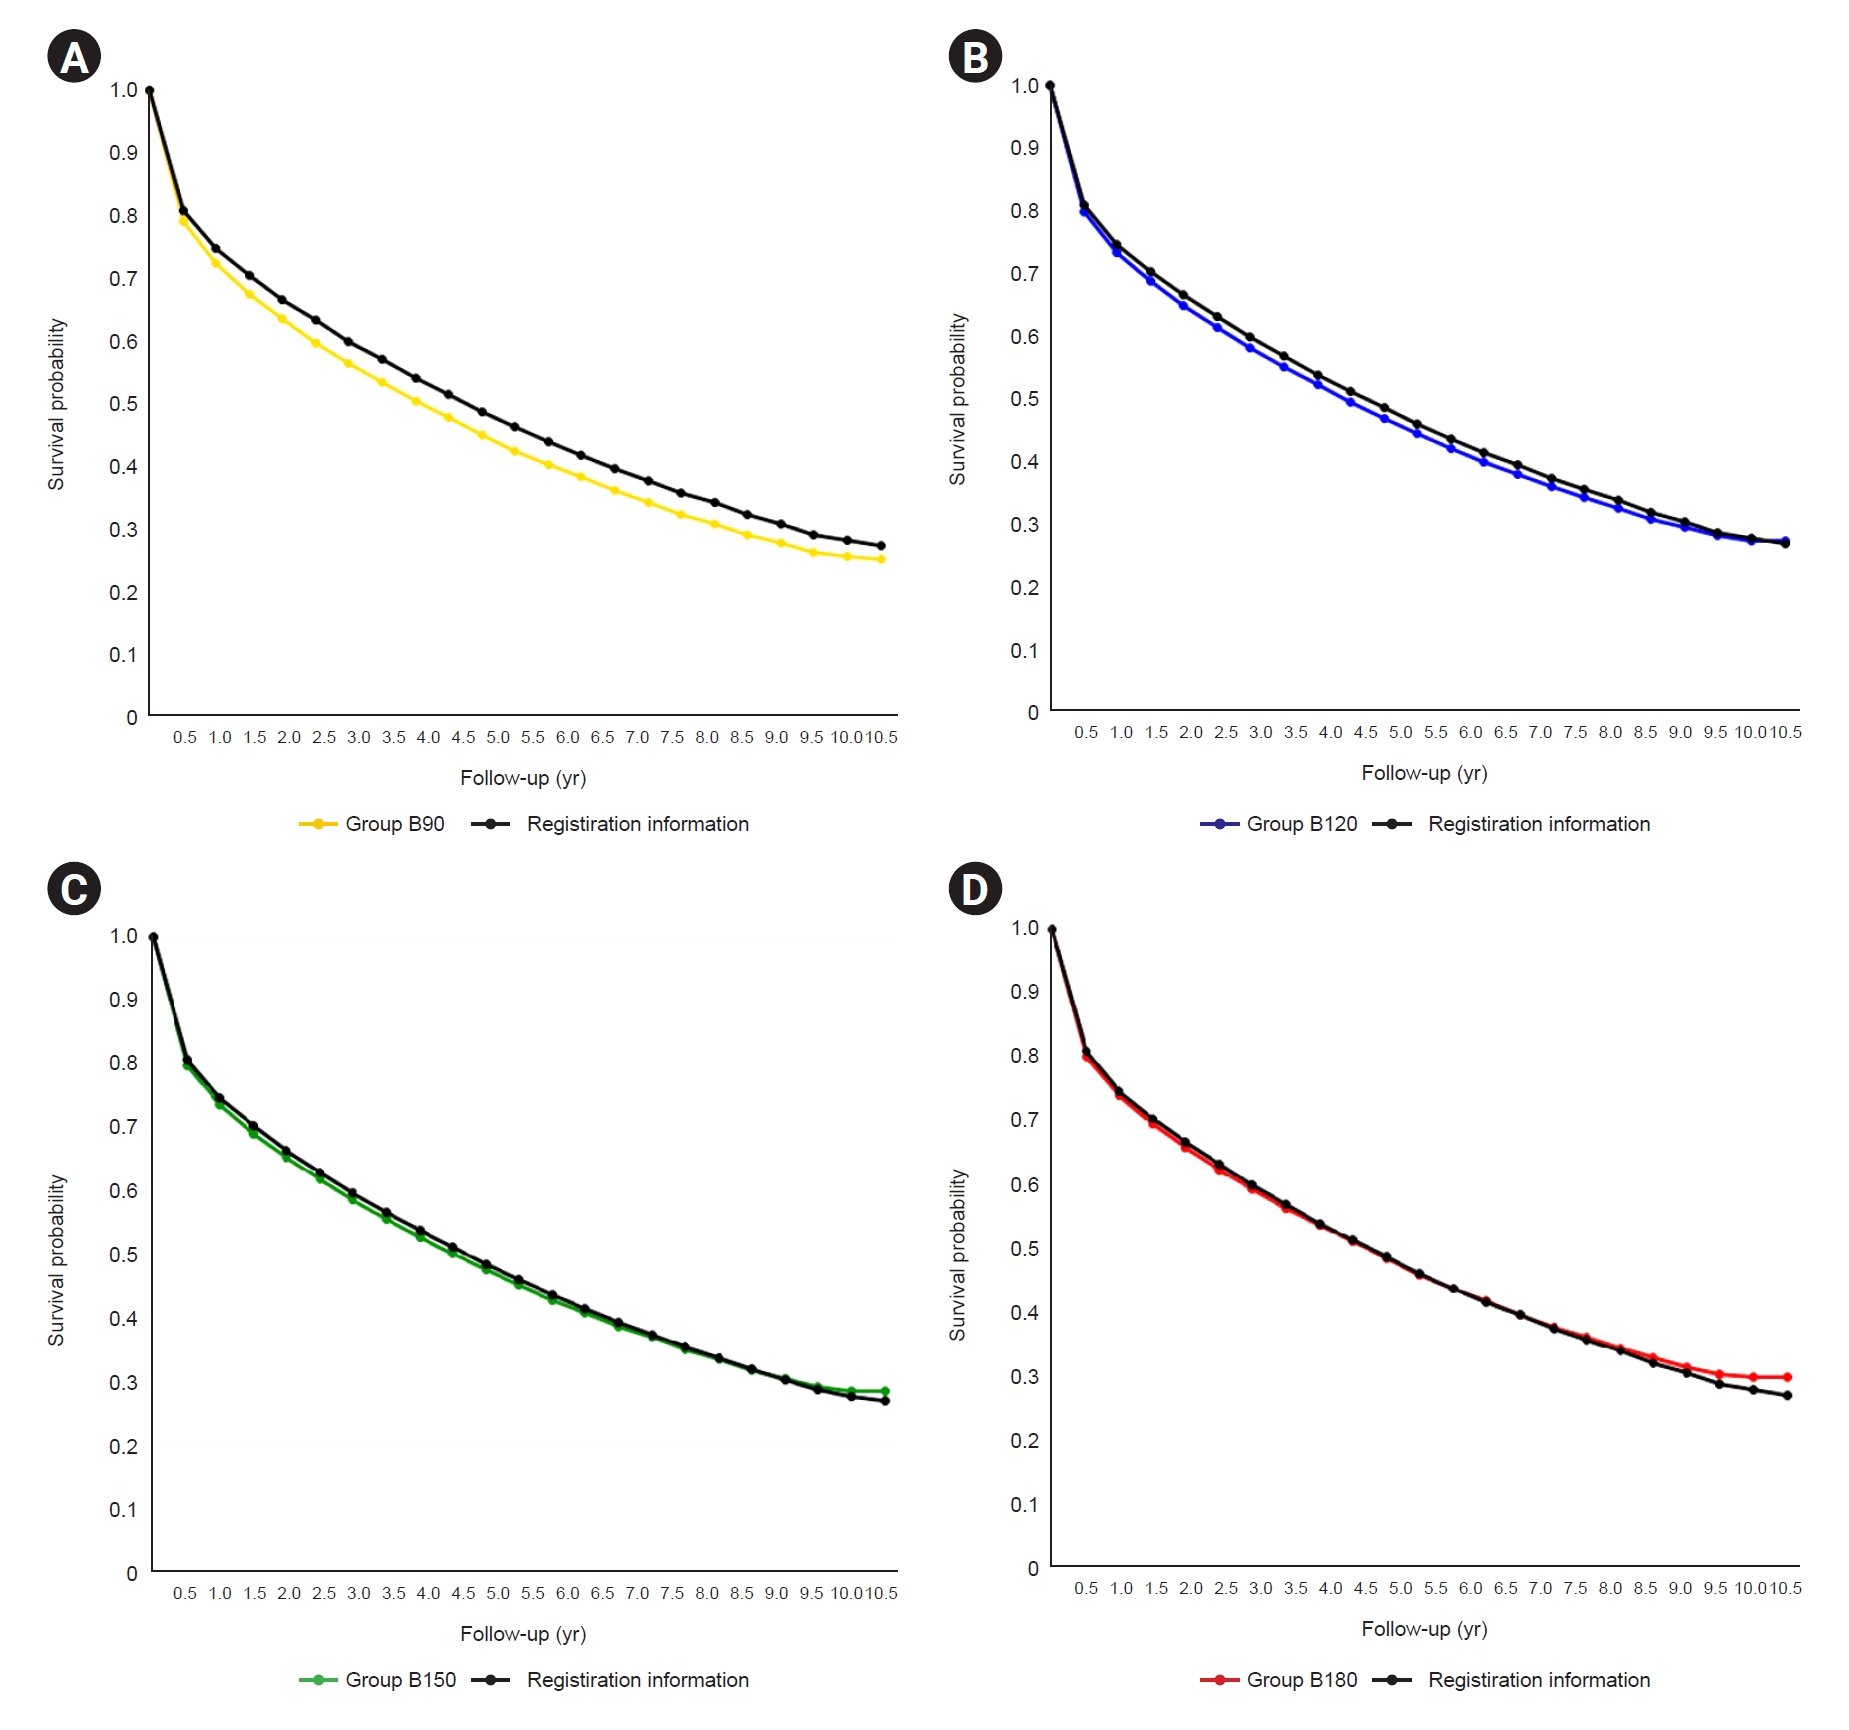
Comparison of the survival curves of groups based on operational definitions of mortality with that of the group with mortality defined based on registration information (group A).
(A) Comparison of the survival curve of group B90 with that of group A. (B) Comparison of the survival curve of group B120 with that of group A. (C) Comparison of the survival curve of group B150 with that of group A. (D) Comparison of the survival curve of group B180 with that of group A. Registration information; the survival curve of group A was set as the reference. Groups B90, B120, B150, and B180 are patient groups with presumed deaths defined by operational definition as the absence of any claims data for medical service use over 90, 120, 150, and 180 days, respectively.
Compared to the mortality dates for group A, the mortality dates of groups B120, B150, and B180 were identical to those of group A in 88.3%, 88.5%, and 88.6% of deceased patients, respectively. Median difference in mortality date between group A and groups B120 (IQR, 1–14), B150 (IQR, 1–13), and B180 (IQR, 1–12) was 3 days.
The probabilities of a difference of a week or less between the mortality dates for group A and B patients were 95.7%, 95.9%, and 96.0% for groups B120, B150, and B180, respectively (Table 4).

Comparison of differences in mortality dates among groups B120, B150, and B180 relative to group A
Discussion
Despite the usefulness of claims data from the health insurance system, analysis of data from NHIS and HIRA databases poses some unique challenges. NHIS data are difficult to access, and HIRA data do not provide detailed mortality information. Given that all-cause mortality is a surrogate endpoint and the hardest objectively measurable outcome, its unavailability in the HIRA data is a disadvantage. To analyze NHIS data, it is necessary to visit one of a limited number of analyzing centers that can only be accessed during the daytime for a limited period, an untenable situation for the majority of physicians in clinical practice. Conversely, the HIRA database provides more favorable accessibility with no daytime access restrictions and can be analyzed in one’s own office via remote access at any time.
To study patients on maintenance HD, nephrologists have applied operational definitions to HIRA data by interpreting the absence of any claims data as death [13–16].
Clinically, it is very hard for ESKD patients on maintenance HD to survive over several months without using any medical services. However, when analyzing HIRA data using an operational definition of death, a patient who is alive may be misclassified as dead in some circumstances, including cases where insurance eligibility was suspended for a period due to long-term overseas stay, emigration, or long-term nonpayment of health insurance premiums. It is not clear how much these exceptional cases affect the agreement between mortality from the NHIS database and presumed mortality from the HIRA database when mortality analysis of HIRA data is performed using operational definitions.
Our study findings indicate that when a period of no claims data of 150 days was used, it provided the most accurate estimate of mortality rate based on NHIS data. The period of 30 days was most sensitive but also least accurate because, in Korea, healthcare centers only report monthly claims data to the HIRA. When the period of no claims data was defined as 90 days or less, the possibility of mortality rate overestimation was high. If mortality is defined by as long as possible a period of no claims data, mortality may be underestimated despite a high PPV. This is because the longer the period of no claims data, the longer the immortal time at the end of the follow-up period. This implies that if the period of no claims data is too long, the patient’s death is reflected with less sensitivity, resulting in low accuracy. This effect was more pronounced as longer the survival duration (Fig. 3). Therefore, when the period of no claims data was set to 90 days or less, there was a high risk of overestimating the mortality rate during the entire study period. Conversely, when it was set to 180 days or more, there was a risk of underestimating the mortality rate.
We investigated the difference between mortality date estimated by each operational definition and that of the NHIS database. In this study, an operational definition of mortality date was considered as the first date of the period that the patient had not used any medical services according to each definition. There was a median difference of 3 days between the date of death in the NHIS data and that of groups B120, B150, and B180 (IQR of 1–14, 1–13, and 1–12, respectively). These results appear to reflect the characteristics of patients on maintenance HD who regularly undergo HD treatment at least every 2 to 3 days.
Mortality dates of groups B120, B150, and B180 were identical to those in the NHIS database in 88.3%, 88.5%, and 88.6% of cases, respectively, and for cases where the mortality date was estimated by the operational definition, there was a difference of a week or less in the mortality date from that of the NHIS in 95.7%, 95.9%, and 96.0% of cases, respectively. These results imply that judicious establishment of operational definitions can provide reliable outcomes in mortality analysis using Korean HIRA data.
This study had several limitations. First, this study utilized the Korean administrative database and the Korean national health insurance system, and thus cannot be generalized to other nations with different health insurance systems or administrative databases. Second, it is not feasible to investigate the cause of death using HIRA and NHIS databases, hence analysis based on the cause of death still requires merging of data from these databases with cause of death information from Statistics Korea. Last, the best accuracy of the applied operational definitions for all-cause mortality analysis in the present study was 96%; remaining inaccuracies should be further reduced by finding more optimal tools in future investigations.
In conclusion, the operational definition for mortality was most accurate when the period of no claims data was set to 150 days. Thus, absence of claims data for 150 days is an acceptable operational definition for the analysis of all-cause mortality in patients on maintenance HD when using HIRA claims data. Future studies using HIRA data should focus on the interpretation of mortality data and clarify the limitations of analyzing mortality rates obtained by operational definitions.
Notes
Conflicts of interest
All authors have no conflicts of interest to declare.
Funding
This work was supported by the Korean Society of Dialysis Access.
Data sharing statement
The data presented in this study are available with permission of the Korean National Health Insurance Service (NHIS).
Authors’ contributions
Conceptualization, Validation: DHL, HSL
Data curation: YJK, HK, HSL
Formal analysis: DHL, YJK, HK
Funding acquisition: HK, HSL
Investigation, Software: DHL, YJK, HSL
Methodology: All authors
Project administration: YJK
Resources: YJK, HK
Supervision, Visualization: HSL
Writing–original draft: All authors
Writing–review & editing: All authors
All authors read and approved the final manuscript.