Weight change and risk of depression in patients with diabetic kidney disease: a nationwide population-based study
Article information

Abstract
Background
Several studies have reported that depression is prevalent in patients with diabetes or chronic kidney disease. However, the relationship between weight changes and the risk of depression has not been elucidated in patients with diabetic kidney disease (DKD).
Methods
From the Korean National Health Insurance Service database, we selected 67,866 patients with DKD and body weight data from two consecutive health examinations with a 2-year interval between 2009 and 2012. Weight change over 2 years was categorized into five groups: ≥–10%, <–10% to ≥–5%, <–5% to <5%, ≥5% to <10%, and ≥10%. The occurrence of depression was monitored via the codes of International Statistical Classification of Diseases, 10th revision through the end of 2018.
Results
During the 5.24-year follow-up, 17,023 patients with DKD developed depression. Weight change and the risk of depression had a U-shaped relationship: patients with ≥–10% weight change (hazard ratio [HR], 1.12) and those with ≥10% weight change (HR, 1.11) showed higher HRs for depression than those with <–5% to <5% weight change, even after adjusting for several confounding factors. In the subgroup analyses, the risk of depression tended to increase as weight gain or weight loss increased in all subgroups.
Conclusion
Both weight loss and weight gain increased the risk of depression in patients with DKD.
Introduction
Diabetes is one of the leading causes of chronic kidney disease (CKD) and end-stage kidney disease worldwide [1,2]. Because diabetic kidney disease (DKD) is a heterogeneous disease with various overlapping etiologic pathophysiologies [3], it is well recognized that DKD has a poorer prognosis than CKD without diabetes. Anemia develops earlier in the course of disease progression in patients with DKD than in those with nondiabetic CKD [4]. In addition, the rates of mortality from cardiovascular disease and infection are higher in patients with DKD than in those with CKD from other causes [5,6]. In Korea and the United States, end-stage kidney disease is attributed to diabetes in nearly 50% of cases [1,2].
Patients with chronic illnesses such as diabetes and CKD are more likely to have or develop mental health problems than people without such conditions. In particular, patients with chronic diseases have a high risk of experiencing depression [7]. Alternatively, depression is a common complication of chronic diseases. Diabetes and CKD, which are representative chronic diseases, are also associated with an increased risk of depression. Depression is highly prevalent in patients with CKD [8–12], and even those with early-stage CKD have a high risk of depression [13]. The prevalence of depression in patients with CKD undergoing dialysis is 20% to 30%. Because depression is also common in patients with diabetes, the two diseases need to be managed together [14]. In particular, DKD, as a combination of two common chronic diseases, can be expected to cause not only a poor prognosis but also adverse effects on mental health. Therefore, early detection, treatment, and management of risk factors are necessary.
Several studies have reported that being overweight is a risk factor for depression [15]. Only a few studies have reported that being underweight might also increase the risk of depression [16]. In addition, although many studies have examined depression-related weight changes, few studies have considered whether weight changes can increase the risk of depression [17]. A recent study reported that body weight variability is related to the risk of depression in patients with type 2 diabetes, but it is unclear whether an increase or decrease in body weight is related to the risk of depression in DKD patients [18]. Therefore, we investigated the association between body weight change and the risk of depression in patients with DKD. To better elucidate the relationship between weight change and depression, we analyzed large-scale, nationally representative data from the Korean National Health Insurance System (NHIS).
Methods
Data source and study population
The Korean NHIS, which keeps an eligibility database (containing information on age, sex, socioeconomic variables, type of eligibility, and income level), a medical treatment database (based on claims submitted by medical service providers for medical expenses), a health examination database (containing the results of general health examinations and questionnaire surveys on lifestyle and behavior), and a medical care institution database (containing information on the types of medical care institutions and their locations, equipment, and number of physicians), makes a complete set of health information for 50 million Koreans available to researchers. The NHIS is managed by the government of Korea and enrolls approximately 97% of the Korean population, with the remaining 3% being covered by the Medical Aid program. The total claim rate for medical expenses is 100%. Therefore, only a few individuals from the Korean population are missing from the NHIS cohort. The Korean NHIS provides regular health examinations to the public. Those enrolled in the health insurance service are recommended to undergo health examinations at least biennially.
Identification of study subjects with diabetes and chronic kidney disease
In this study, we included participants with diabetes who underwent a health examination between 2009 and 2012 and also underwent a follow-up health examination 2 years later (Fig. 1). The index date was the date of the second health examination. Individuals aged <20 years were excluded. Subjects with a CKD diagnosis at both of the health examinations (with a 2-year interval between them) were recruited, and those with a history of malignancy or depression were excluded. After excluding participants with missing data, we enrolled 67,866 patients with DKD in this study. A detailed flowchart of the recruitment of study participants is provided in Fig. 1. The participants were followed up until they were diagnosed with depression, lost their health insurance eligibility, or the follow-up period ended (December 31, 2018). Diabetes was defined as follows: 1) having at least one claim per year for a prescription for antidiabetic medication with International Statistical Classification of Diseases, 10th revision (ICD-10) codes E11–E14 in the insurance claims data or 2) having a fasting plasma glucose level of ≥126 mg/dL in the health examination without a prescription for antidiabetic medication [19]. The following antidiabetic medications were considered diagnostic: sulfonylureas, metformin, dipeptidyl peptidase-4 inhibitors, thiazolidinediones, alpha-glucosidase inhibitors, meglitinides, and insulin. Patients with type 1 diabetes mellitus (ICD-10 code E10) were excluded from this study. CKD was defined as an estimated glomerular filtration rate (eGFR) of <60 mL/min/1.73 m2, as calculated by the Modification of Diet in Renal Disease (MDRD) formula.
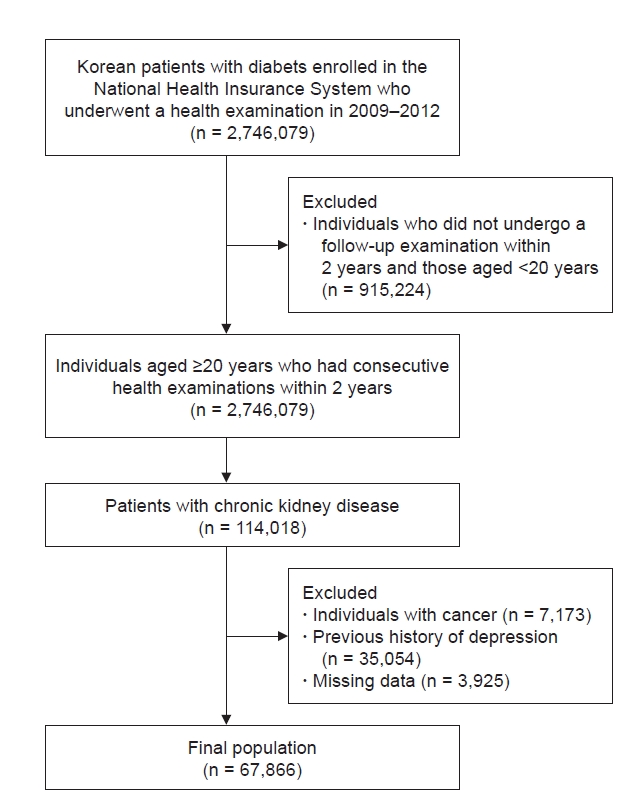
Flowchart of the study population.
Definitions of depression and other variables
Patients whose records contained ICD-10 code F32 or F33 during the follow-up period were defined as having a diagnosis of depression. The variables included in the health examinations, such as questionnaire items, laboratory data, and disease history, were described in our previous study [20]. Those variables were extracted from the results of the biennial health examinations provided to health insurance participants by the NHIS [21]. The hospitals that perform these health examinations are certified by the NHIS and subjected to regular quality control evaluations. The definitions of hypertension and dyslipidemia were taken from a previous study [20]. Data about smoking, alcohol consumption, and physical activity were obtained from the health examination questionnaires. Standardized self-reported questionnaires were used for alcohol consumption (none; mild, <30 g of alcohol/day; and heavy, ≥30 g of alcohol/day), and smoking status (never, former, and current). Regular physical exercise was defined as high-intensity activity ≥ 1 time/week or moderate-intensity activity ≥ 1 time/wk. Income level was divided into quartiles, and the lowest quartile was defined as low-income. Malabsorption disorders were identified by the ICD-10 codes for Crohn disease (K50), ulcerative colitis (K51), and intestinal malabsorption (K90). Weight change was estimated as the difference in weight between the consecutive health examinations with a 2-year interval and divided into the following five groups, as reported in previous studies: ≥–10%, <–10% to ≥–5%, <–5% to <5%, ≥5% to <10%, and ≥10% [22].
Statistical analyses
Continuous variables are presented as the mean ± standard deviation, and categorical variables are presented as number (percentage). Intergroup differences were estimated using the chi-square test or analysis of variance, as appropriate. The incidence rates of depression are presented per 1,000 person-years. A multivariable Cox proportional hazards regression analysis was used to estimate the hazard ratios (HRs) and 95% confidence intervals (CIs) for the risk of depression associated with body mass index (BMI) and weight change, with adjustment for age, sex, smoking, alcohol consumption, regular exercise, low-income status, use of insulin, number of oral hypoglycemic agents, duration of diabetes, previous history of hypertension or dyslipidemia, and previous body weight. A sensitivity analysis was performed by excluding patients diagnosed with depression within the first year of follow-up. Subgroup analyses were performed to assess the effect of modification on the risk of depression in patients with DKD according to age (<65 and ≥65 years), sex, history of hypertension, duration of diabetes (<5 and ≥5 years), presence of proteinuria, BMI (<25 and ≥25 kg/m2), use of insulin, number of oral hypoglycemic agents used (≥3), CKD stage (stage 3a with a glomerular filtration rate [GFR] of ≥45 to <60 mL/min/1.73 m2, stage 3b with a GFR of ≥30 to <45 mL/min/1.73 m2, stage 4 with a GFR of ≥15 to <30 mL/min/1.73 m2, and stage 5 with a GFR of <15 mL/min/1.73 m2, as calculated by the MDRD formula), and history of hospitalization. Interaction terms were added to test for effect modification across subgroups. Statistical analyses were performed using SAS (version 9.3; SAS Institute), and p < 0.05 was considered to indicate statistical significance.
Ethical approval
The requirement for ethical approval of this study was waived by the Institutional Review Board of Chonnam National University Hospital (No. CNUH-EXP-2021-321). The requirement for obtaining informed consent was also waived because the participants’ records and information were anonymized and de-identified before analysis. We received permission to use the database from the National Health Insurance Sharing Service (application No. REQ202103172-007).
RESULTS
Baseline characteristics of the study population
The baseline characteristics of the participants are shown in Table 1 according to weight change status. At baseline, the mean age of all patients (54.6% males) was 67.8 ± 9.7 years. The mean eGFR was 45.2 ± 14.4 mL/min/1.73 m2, and the mean BMI was 25.0 ± 3.3 kg/m2. The distribution of patients according to weight change during the 2-year period was as follows: 70.5% had <5% weight change (stable weight group); 4.4% had ≥–10% weight change; 13.8% had <–10% to ≥–5% weight change; 8.3% had ≥5% to <10% weight change; and 3.0% had ≥10% weight change. Participants in the stable weight group were younger, more likely to be smokers and consume alcohol, more likely to exercise regularly, and had a lower income and higher baseline eGFR than those in the other weight loss and gain groups. Participants in the stable weight group also tended to have a lower prevalence of hypertension and dyslipidemia. BMI, waist circumference, total cholesterol, and triglyceride levels all tended to decrease with weight loss and increase with weight gain.
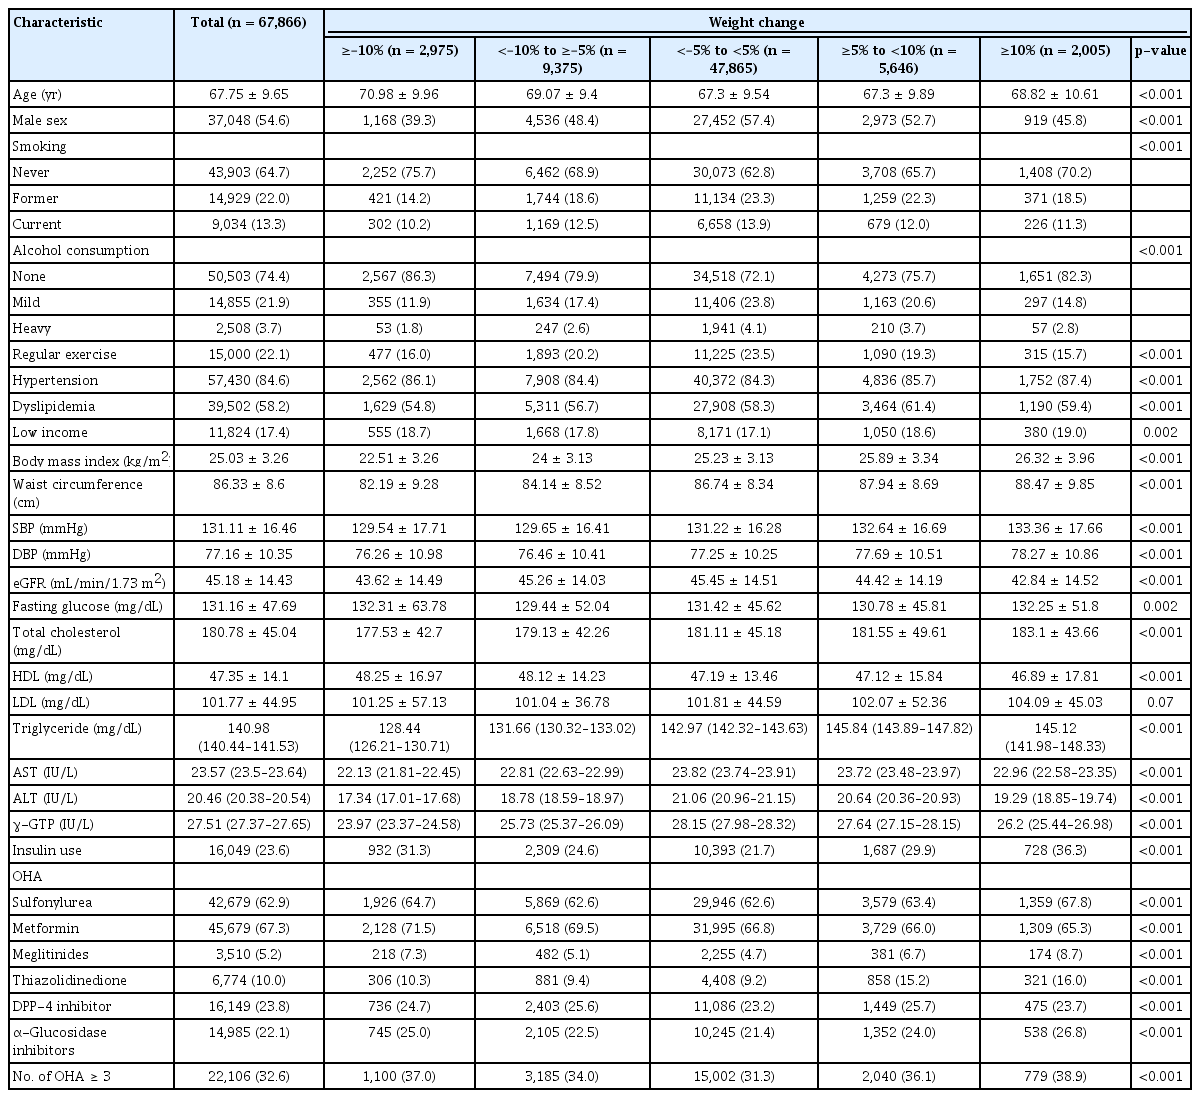
Baseline characteristics of the study population according to weight change status
Risk of depression by body mass index, weight change status in diabetic kidney disease
During the follow-up period (median, 5.24 years; interquartile range, 4.01–6.65 years), a total of 17,023 incident cases of depression were diagnosed. The associations between baseline BMI and the incidence and risk of depression in participants with DKD are described in Table 2. We did not find a significant relationship between baseline BMI and the risk of depression. Adjusting for available confounding factors did not alter that result.

Incidence rates and HRs for depression according to BMI category
The associations between weight change and the incidence and risk of depression in participants with DKD are described in Table 3 and Fig. 2. Compared with the group with a <5% weight change in either direction over 2 years, the incidence rate of depression increased as weight loss or gain increased in the other groups. The risk of depression increased as weight change increased, and both weight loss and weight gain were significantly associated with an increased risk of depression. This trend did not change even after adjusting for various confounding factors. After adjusting for the participants’ age, sex, smoking or alcohol consumption, comorbidities, duration of diabetes, antidiabetic medications, and baseline body weight (only in model 3), the adjusted HRs for depression increased to 1.07 (95% CI, 1.03−1.12) and 1.12 (95% CI, 1.04−1.20) in those with <–10% to ≥–5% weight change and ≥–10% weight change, respectively. Participants who gained weight also showed a significantly increased risk of depression (adjusted HR, 1.07 [95% CI, 1.01−1.13] in the ≥5% to <10% weight change group and 1.11 [95% CI, 1.02−1.21] in the ≥10% weight change group).

Incidence rates and HRs for depression according to weight change status
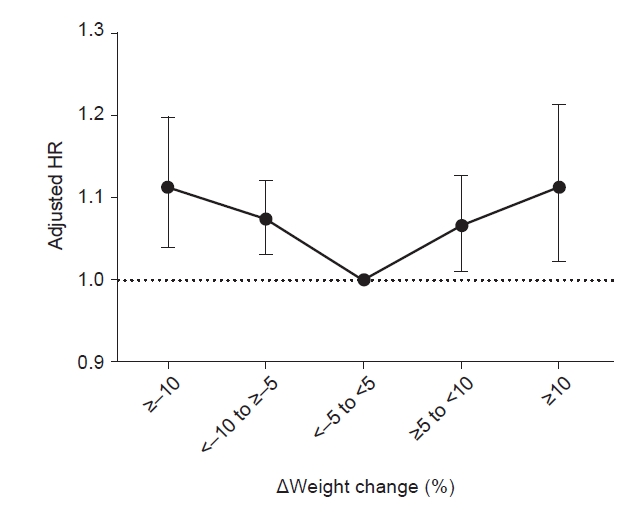
HRs (95% confidence intervals) for depression according to weight change status in diabetic kidney disease patients.
HR, hazard ratio.
We performed a sensitivity analysis to account for the possibility of reverse causality. The risk of depression in patients with DKD was analyzed after excluding participants diagnosed with depression within the first year of follow-up (Table 4). Compared with a group with <–5% to <5% weight change in 2 years, both weight gain and weight loss were still significantly associated with an increased risk of depression in patients with DKD.

Incidence rates and HRs for depression according to weight change status with a 1-year lag
Subgroup analyses of the risk of depression in diabetic kidney disease
We further analyzed the association between weight change and the risk of depression according to subgroups stratified by age, sex, BMI, presence of proteinuria, hypertension, diabetes duration, number of oral hypoglycemic agents, insulin use, and CKD stage (Fig. 3). In all subgroups, the risk of depression tended to increase as weight gain or loss increased. The status of obesity, based on a BMI of 25 kg/m2, had a significant effect on the relationship between weight change and the risk of depression (p for interaction = 0.02). In patients without obesity (BMI, <25 kg/m2), only weight loss showed a significant association with an increased risk of depression (adjusted HR, 1.09 [95% CI, 1.03−1.15] for <–10% to ≥–5% weight change and 1.12 [95% CI, 1.03−1.22] for ≥10% weight change). Weight gain was not associated with an increased risk of depression in patients without obesity. In obese patients (BMI, ≥25 kg/m2), both ≥–5% and ≥10% weight changes were significantly associated with an increased risk of depression (adjusted HR, 1.08 [95% CI, 1.01−1.16] for <–10% to ≥–5% weight change, 1.18 [95% CI, 1.02−1.37] for ≥–10% weight change, and 1.17 [95% CI, 1.05−1.30] for ≥10% weight change). CKD stage also had a significant effect on the relationship between weight change and the risk of depression (p for interaction = 0.001). In CKD stage 4 and 5 patients, weight gain tended to be associated with an increased risk of depression (adjusted HR, 1.38 [95% CI, 1.08−1.75] for ≥10% weight change in CKD stage 4 and 1.28 [95% CI, 0.93−1.77] for ≥10% weight change in CKD stage 5). In CKD stage 3b, the effect of weight gain on the risk of depression was less than that in stages 4 or 5. On the other hand, ≥–10% weight change significantly increased the risk of depression. The risk of depression associated with weight change did not differ according to the rest of the subgroups. Multicollinearity was not observed between the use of insulin or number of oral hypoglycemic agents and the duration of diabetes (Supplementary Table 1, available online).
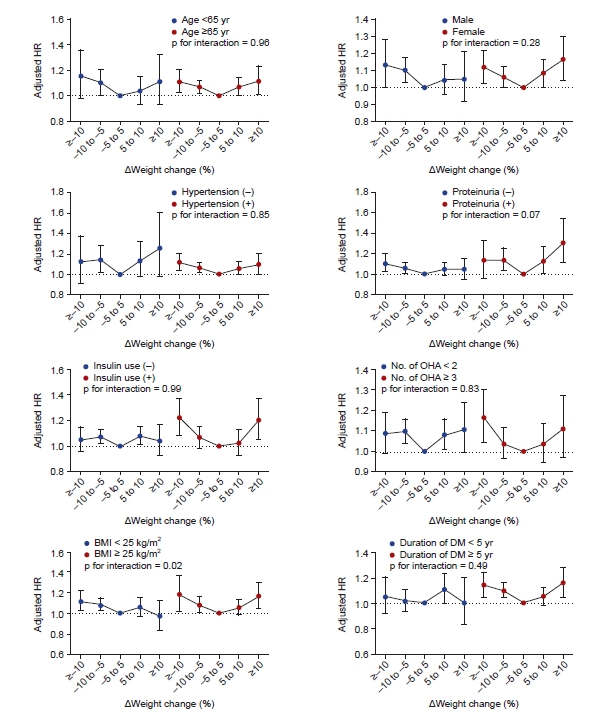
HRs (95% confidence intervals) for depression according to weight change status in subgroups.
BMI, body mass index; DM, diabetes mellitus; HR, hazard ratio; OHA, oral hypoglycemic agents.
We analyzed whether weight change affects the risk of depression in DKD patients according to the presence or absence of hospitalization. In DKD patients without a history of hospitalization, a weight gain or loss of 5% to 10% correlated with a significant increase in the risk of depression (Supplementary Table 2, available online). Patients with a weight gain or loss of 10% or more showed a tendency toward an increased risk of depression, but that finding was not statistically significant. In addition, comorbidities such as malabsorption disorders might have changed the effect of weight change on the risk of depression, so we analyzed that possibility. Although about 1,400 malabsorption patients were excluded from that analysis, the effect of weight change on the risk of depression did not change (Supplementary Table 3, available online).
DISCUSSION
In this nationwide population-based study, we investigated the relationship between BMI or weight change and the risk of depression. Our results show a U-shaped association between weight change and the risk of depression. Weight change of <–10% to ≥–5% and ≥–10% over 2 years increased the risk of depression by approximately 7% and 12%, respectively, compared with maintaining a stable weight (within 5%). Similarly, a weight change of ≥5% to <10% and ≥10% over 2 years also increased the risk of depression by approximately 7% and 11%, respectively. On the other hand, baseline BMI did not show any significant association with the risk of depression.
Although numerous studies have investigated the relationship between body weight and physical health, relatively few studies have examined the relationship between body weight and mental health. Several studies have confirmed a strong correlation between obesity and depression [15,23–26]. A meta-analysis of longitudinal studies showed that not only obesity (BMI, >30 kg/m2) but also being overweight (BMI, 25–30 kg/m2) increased the risk of depression (odds ratio [OR], 1.55 for BMI of ≥30 kg/m2 and 1.27 for BMI of 25 to <30 kg/m2). Conversely, depression was found to predict the development of obesity (OR, 1.58). Several researchers have hypothesized about the mechanisms underlying the pathophysiological link between obesity and depression. The first possible mechanism is the psychological effects of obesity. Given the cultural equation of a lean body with beauty, obesity can lower the self-esteem of obese individuals [27]. Similarly, the stigma toward individuals with obesity could contribute to the development of depression. Studies have shown that persons with obesity are treated differently in many social situations, including in marriage relationships [28]. Therefore, obesity can increase psychological distress, which can lead to depression. Another possible mechanism is the adverse effects of obesity on physical health. Obesity is a strong risk factor for diabetes and cardiovascular diseases [29,30]. Those diseases lead to a decrease in physical ability and quality of life. Furthermore, the associated increase in medical costs can cause economic problems [31]. Obesity induces an inflammatory state [32,33], and inflammation has been reported to be associated with depression [34–36]. In addition, obesity causes dysregulation of the hypothalamic–pituitary–adrenal axis [37,38], which is associated with the development of depression [39,40].
Although obesity and depression are strongly correlated, contrasting results have also been reported. However, results from studies about the relationship between underweight and the risk of depression are scarce and inconsistent. de Wit et al. [41] revealed a significant U-shaped association between BMI categories and depression in the general population of the Netherlands. In a meta-analysis of 76 longitudinal studies, both underweight and obesity increased the risk of depression [16]. In recent reports, underweight adolescents showed a tendency toward a depressed mood compared with their normal-weight peers [42,43]. In a study by McCrea et al. [44], the relationship between BMI and the risk of depression showed different patterns according to sex and age. In young women, the probability of having a mental disorder, including depression, increased with BMI. In contrast, in young men, the relationship was U-shaped, with high probabilities for both underweight and obese men. These associations diminished in the older age group. In another study, neither underweight nor obesity conferred a higher risk of depression than normal weight [45]. In this study, we evaluated the risk of depression according to baseline BMI and found that neither overweight nor underweight had a significant relationship with the risk of depression.
Therefore, we attempted to determine whether weight change, rather than BMI itself, is related to the risk of depression. The effect of dynamic weight changes on the occurrence of depression has been less studied than the effect of static weight status on depression. Singh et al. [17] reported that a weight gain of >2.5% of the baseline weight increased the risk of incident depression (OR, 1.30; 95% CI, 1.14–1.49) in middle-aged women. In that study, a loss of >2.5% in the baseline weight was significantly associated with an increased risk of incident depression in the age-adjusted analysis (OR, 1.25; 95% CI, 1.06–1.48); however, that result was not maintained after adjusting for confounding factors. A more recently published meta-analysis revealed that neither weight gain nor weight loss was associated with an increased risk of depression [16]. However, that meta-analysis included less than 10 studies in its analysis of the effect of weight change, and the study populations were rather heterogeneous. Our study showed somewhat different results from those previous studies. We found that both weight gain and weight loss were associated with an increased risk of depression. In addition, our analysis with a 1-year lag, performed to consider the effect of reverse causality, produced consistent results. We presume that our results differ from those of previous studies because our study population was limited to patients with DKD. As mentioned above, patients with DKD are expected to have a poor prognosis because DKD is a combination of two chronic diseases and is highly likely to be accompanied by various comorbidities. Furthermore, DKD progresses more quickly than other CKDs because its pathophysiology involves diverse pathways and extensive ranges. Therefore, weight changes are more likely to affect the mental health of patients with DKD than in the general population.
Recently, An et al. [18] reported that an increase in body weight variability in a Korean population with type 2 diabetes was associated with an increased risk of depression. Specifically, they found that high body weight variability in either direction was associated with an increased risk of depression in a CKD subpopulation similar to our study population. In this study, we examined whether a decrease or increase in body weight increased the risk of depression and further tested the effects of the width of body weight changes. As described above, we found that both decreases and increases in body weight were associated with an increase in the risk of depression, such that a greater weight change carried a greater risk of depression. Although it is difficult to directly compare the results of our study with those of An et al. [18], it seems true that changes in body weight have a negative effect on mental health in DKD patients.
We analyzed the association between weight changes and the risk of depression according to subgroups stratified by CKD stages and found the CKD stage had a significant effect on the relationship between weight change and the risk of depression. In advanced CKD patients (stages 4 and 5), weight gain tended to be associated with an increased risk of depression. In CKD stage 3b, a ≥10% weight change was found to significantly increase the risk of depression, but the effect of weight gain on the risk of depression was less than that in stages 4 or 5. Overall, weight gain appears to further increase the risk of depression as CKD advances. It can be assumed that the risk of developing depression increases when edema or weight gain occurs due to fluid retention in patients with poor renal function.
We also analyzed whether weight change in DKD patients affects the risk of depression according to hospitalization history because weight changes can occur rapidly in the hospital. In DKD patients without a history of hospitalization, a weight gain or loss of 5% to 10% correlated with a significant increase in the risk of depression. However, patients without a history of hospitalization who experienced a weight gain or loss of 10% or more showed a tendency toward an increased risk of depression but without statistical significance. For that reason, we estimate that patients who experienced a weight gain or loss of 10% or more were likely to have other physical conditions not counted in our data, and we assume that those diseases might have influenced this outcome.
Although this study provides important information about weight change and the risk of depression, it has several limitations. First, it was unclear whether the weight change in our patients, especially weight loss, was intentional. Intentional weight loss for health-related reasons, especially in patients with obesity, might have influenced the results of our study. Second, we identified the occurrence of depression using the relevant ICD-10 codes. However, that might have overestimated or underestimated the actual incidence of depression. Due to data limitations, we could not include the use of an antidepressant in the diagnostic criteria. In addition, among patients with diabetic neuropathy, there was a concern about over-diagnosing depression because tricyclic antidepressants are often used in the absence of depression. Similarly, we diagnosed DKD as diabetic patients with CKD (eGFR, <60 mL/min/1.73 m2). But without renal function decline, physicians do not usually enter a separate CKD diagnosis code for patients who have only proteinuria or those in the hyperfiltration phase of DKD, so they might have been excluded from the database when we chose our study population. Also, the operative definition of diabetes that we used here might have unintentionally excluded diabetes patients whose fasting blood glucose was below 126 mg/dL. Third, the effect of long-term weight change on the occurrence of depression might be different because the observation period for weight change in our study was relatively short. In addition, information about weight changes after the 2 years between health examinations was not considered in our analyses. Fourth, this study included only Koreans. Body weight is closely associated with socially accepted aesthetic standards, which could affect the incidence of depression. Therefore, the results of this study cannot be extended to other countries or races. Despite those limitations, our study has some strengths. This study included the largest ever sample size, although we limited the target population to patients with DKD, which is a group at high risk of depression. In addition, our study had a longitudinal design. Also, we minimized the possibility of reverse causality by performing an analysis with a 1-year lag. To our knowledge, this is the first study to examine the relationship between weight change and depression in a nationwide population.
In conclusion, both weight loss and weight gain increased the risk of depression in patients with DKD. But only weight loss, not weight gain, increased the risk of depression in nonobese DKD patients. Therefore, patients with DKD who experience weight loss or weight gain need to be informed about the possibility of depression. In addition, not only medical treatment but also psychological support should be provided to those patients.
Notes
Conflicts of interest
All authors have no conflicts of interest to declare.
Funding
This work was supported by a National Research Foundation of Korea (NRF) grant funded by the Korean government (Ministry of Science and ICT) (NRF-2022R1C1C1007573) and by a grant (BCRI22080) from Chonnam National University Hospital Biomedical Research Institute.
Data sharing statement
Anonymized data are publicly available from the National Health Insurance Sharing Service and can be accessed at https://nhiss.nhis.or.kr/bd/ab/bdaba000eng.do.
Authors’ contributions
Conceptualization: HSC, TRO, SHS, MK, CSK, EHB, SKM, SWK
Data curation, Formal analysis: BK, KDH
Funding acquisition: HSC, SWK
Supervision: SWK
Writing–original draft: HSC
Writing–review & editing: HSC, TRO, SHS, MK, CSK, EHB, SKM, SWK
All authors read and approved the final manuscript.
Supplementary Materials
Supplementary data are available at Kidney Research and Clinical Practice online (https://doi.org/10.23876/j.krcp.21.294).