


Introduction
Hypertension (HTN) is a well-known risk factor for cardiovascular disease (CVD) and chronic kidney disease (CKD) [1,2]. The kidney is one of the major organs damaged by high blood pressure (BP), and hypertensive nephrosclerosis is the predominant cause of CKD [3,4]. Furthermore, the incidence of HTN is directly proportional to a decline in renal function [5,6]; thus, early detection and proper management of HTN is needed to reduce the risk of CKD and its related complications. In 2017, the American College of Cardiology/American Heart Association suggested a lower threshold for HTN defined as systolic BP (SBP) ≥ 130 mmHg or diastolic BP (DBP) ≥ 80 mmHg [7]. The decrease in threshold was largely influenced by the Systolic Blood Pressure Intervention Trial (SPRINT), which found that maintaining SBP < 120 mmHg clearly reduced CVD risk [8].
Although intensive BP control can lower CVD risk and mortality, the results of large randomized controlled trials (RCTs) have raised concerns that strict BP control can produce an increased risk of CKD [8–10]. Moreover, RCTs have usually been conducted in individuals with high CVD risk who are already taking antihypertensive medications. Therefore, deciding when to begin BP control medication in individuals with a low CVD risk remains to be determined. Early BP control interventions might not reduce or could even harm renal function, but late intervention can increase the risk of CKD, CVD, and the mortality associated with those conditions. Previous observational studies have suggested that prehypertension is associated with an increased CKD risk in the general population, but those studies defined prehypertension according to a variety of criteria or included patients on antihypertensive medications [11–14].
Thus, substantial uncertainty remains regarding the best BP level for CKD prevention, particularly among individuals without underlying kidney disease who are not taking antihypertensive medication. Therefore, we examined the association between BP and incident CKD risk in a large Korean population who had not taken any antihypertensive medication.
Methods
Study population
In this study, we used data from the Korean Genome and Epidemiology Study (KoGES), a prospective community-based cohort study of people living in urban and rural areas. The study profile and methods used have already been described [15,16]. In brief, the KoGES study population consisted of 10,030 individuals aged 40 to 69 years. From 2001 to 2014, participants underwent serial medical examinations and completed a biennial self-administered questionnaire about their health, lifestyle, and diet. We excluded individuals with no follow-up visits (n = 974); without baseline serum creatinine level or proteinuria data (n = 29); with an estimated glomerular filtration rate (eGFR) < 60 mL/min/1.73 m2, proteinuria 1+, or a history of underlying kidney disease at baseline (n = 625); taking antihypertensive medications at baseline (n = 898); or with a history of CVD at baseline (n = 161). Thus, 7,343 subjects who provided written informed consent voluntarily participated in this study (Supplementary Fig. 1, available online).
This study was carried out in accordance with the ethical principles of the Declaration of Helsinki and was approved by the Ethics Committee of the Korean Health and Genomic Study at the Korea National Institute of Health and the Institutional Review Board of Soonchunhyang University Hospital (No. 2019-03-022).
Data collection
Demographic and socioeconomic data were collected at baseline. Height and body weight were measured following standard methods with the patient wearing light clothes, and body mass index (BMI) was determined as kg/m2. Educational status was divided into three categories: low, lower than middle school; intermediate, middle school; and high, higher than middle school. Income status was classified into three categories: low, <$850 per month; intermediate, >$850 to <$1,700 per month; and high, >$1,700 per month. Smoking status was divided into three categories: current smokers, former smokers, and never smokers. Diabetes mellitus (DM) was defined as fasting glucose ≥126 mg/dL, post-load glucose ≥ 200 mg/dL after a 75-g oral glucose tolerance test, hemoglobin A1c ≥ 6.5%, a medical history of DM, or the use of oral medication or insulin. Subjects with a history of dyslipidemia or using lipid-lowering medications were defined as having dyslipidemia. Blood samples were collected after overnight fasting. Urine samples were collected in the morning after the first voiding and were assessed for the presence of protein using a dipstick. Proteinuria was defined as 1+ or greater.
Subgroup category according to the systolic BP and diastolic BP
Using a mercury sphygmomanometer, trained nurses measured BP after the subjects had been in a relaxed state for at least 10 minutes in a sitting position. The arm with the higher reading was used. The participants were divided into six categories according to SBP (<100, 100–119, 120–129, 130–139, 140–159, and ≥160 mmHg) and five categories according to DBP (<70, 70–79, 80–89, 90–99, and ≥100 mmHg).
Outcome measures
The primary outcome was incident CKD, which was defined as eGFR of <60 mL/min/1.73 m2 or the development of proteinuria at least twice during follow-up. The eGFR was calculated using the Chronic Kidney Disease Epidemiology Collaboration equation [17]. The secondary outcome was incident CVD, which was defined as newly diagnosed or prescribed medications for myocardial infarction, coronary artery disease, congestive heart failure, cerebrovascular disease, or peripheral artery disease during follow-up.
Statistical analysis
Continuous variables are expressed as means ± standard deviations, and categorical variables are expressed as numbers and percentages. Continuous data were tested for homogeneity of variances using Levene’s test. When variances were not homogeneous, Welch’s analysis of variance was used to assess differences among BP groups, with a Tukey or Games-Howell post-hoc analysis, as appropriate. The Cochran-Armitage trend test was used for categorical variables. A Kaplan-Meier analysis was used to estimate CKD-free survival, and a log-rank test was used to determine significant differences between survival curves. We used Cox proportional hazards regression analyses to determine the relationship between BP and incident CKD. We also investigated the influence of time-dependent covariates. Details of the variables included and the consecutive models are provided in Supplementary Table 1 (available online). The nonlinear relationship between the CKD hazard ratio (HR) and the baseline or time-varying BP was evaluated using restricted cubic spline curves. In all survival analyses, right-censoring occurred due to administrative censoring, death, loss to follow up, or the initiation of antihypertensive medication during follow-up. For all analyses, p < 0.05 was considered statistically significant. Statistical analyses were performed using R version 4.0.2 (R Foundation for Statistical Computing, Vienna, Austria).
Results
Baseline characteristics
The baseline characteristics of the eligible participants according to their SBP categories are presented in Table 1. The mean age of the subjects was 51 ± 9 years, and 3,736 of them (50.9%) were female. The mean eGFR was 94 ± 13 mL/min/1.73 m2. The prevalence of DM was 5%. BP was measured five times on average during the follow-up period, and the mean SBP and DBP were 122 ± 17 mmHg and 82 ± 11 mmHg, respectively. Participants in the higher baseline SBP groups were more likely than others to be older and have higher BMI, lower educational levels, and lower-income levels and less likely than others to be current smokers. Moreover, the high SBP group had higher levels of serum fasting glucose, total cholesterol, triglycerides, hemoglobin, and serum albumin and lower eGFR. These trends were similar among the DBP groups (Supplementary Table 2, available online).
Incidence of chronic kidney disease according to blood pressure
During a median follow-up period of 10 years (interquartile range, 6–12 years), 603 incident CKD events (8.2%) occurred, and the crude incidence rate was 9.67 (95% confidence interval [CI], 8.92–10.48) per 1,000 person-years. During follow-up, 2,028 participants were censored when they started taking antihypertensive medication, and their median follow-up period was 6 years (interquartile range, 4–9 years). The CKD incidence tended to increase significantly in the higher baseline SBP and DBP groups (p for trend <0.001, both) (Supplementary Table 3, available online).
Relationship between blood pressure and incident chronic kidney disease
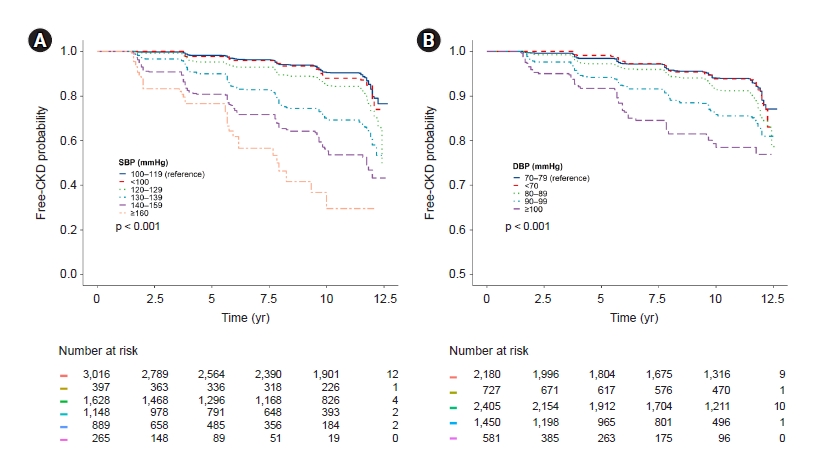
The Kaplan-Meier survival curves show a statistically significant difference in incident CKD between the BP groups. When comparing the groups using SBP 100–119 mmHg as the reference, the cumulative CKD-free survival rate was significantly lower in all the groups with SBP ≥ 120 mmHg (log-rank test p < 0.001 for all) (Fig. 1A). When comparing the groups using DBP 70–79 mmHg as the reference, all the DBP groups ≥ 80 mmHg showed a significantly lower cumulative CKD-free survival rate (log-rank test p < 0.001 for all) (Fig. 1B). In the multivariable Cox proportional hazard regression models with baseline data, both SBP ≥ 120 mmHg and SBP < 100 mmHg (HR, 1.66; 95% CI, 1.08–2.54; p = 0.02) were associated with a significantly increased CKD risk compared with the SBP 100–119 mmHg group (Table 2). Similarly, a significantly increased risk of CKD was observed in the DBP ≥ 80 mmHg and DBP < 70 mmHg groups (HR, 1.44; 95% CI, 1.04–2.01; p = 0.03) compared with the DBP 70–79 mmHg group. However, when we treated BP as a time-varying variable, the increased CKD risk in the lowest BP group disappeared. In the time-varying multivariable Cox analysis, significant increases in CKD risk were observed only with SBP 130–139 mmHg (HR, 1.39; 95% CI, 1.10–1.77; p = 0.007), 140–159 mmHg (HR, 1.79; 95% CI, 1.40–2.28; p < 0.001), and ≥160 mmHg (HR, 3.22; 95% CI, 2.35–4.40; p < 0.001). In the DBP groups, increased CKD risks were observed with DBP 90–99 mmHg (HR, 1.88; 95% CI, 1.48–2.37; p < 0.001) and ≥100 mmHg (HR, 4.30; 95% CI, 3.20–5.76; p < 0.001) (Table 2). The stepwise modeling of these Cox regression analyses is presented in Supplementary Tables 4 and 5 (available online). Collectively, a significantly increased CKD risk was observed in patients with SBP ≥ 130 mmHg and DBP ≥ 90 mmHg.
Sensitivity analyses
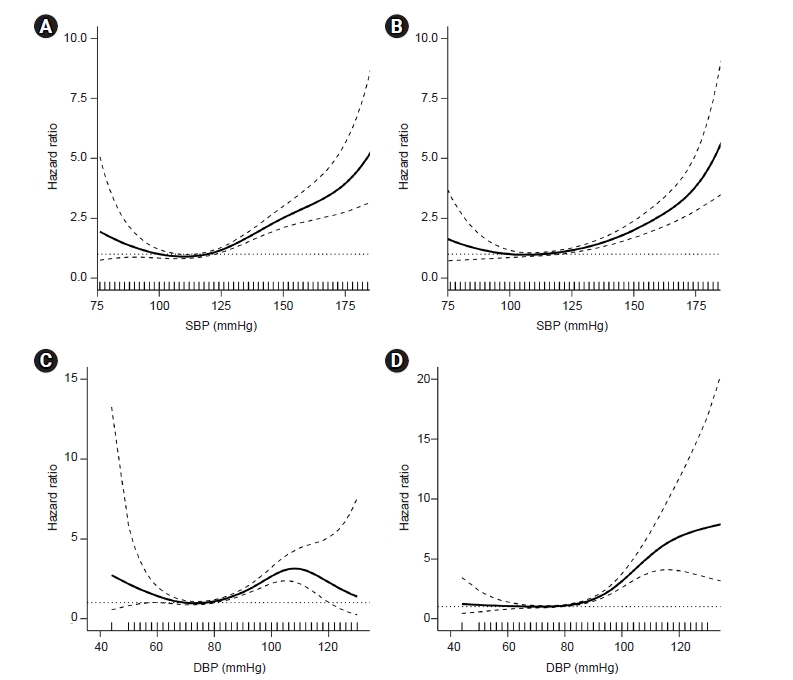
We further conducted a sensitivity analysis in which baseline and time-varying BPs were treated as continuous variables to assess the consistency of our findings. When evaluating the nonlinear relationship between BP and CKD risk using restricted cubic spline models, the CKD risk increased incrementally with higher baseline and time-varying SBPs (Fig. 2A, B). The CKD risk tended to increase with SBP < 100 mmHg, but that was not significant due to wide CIs. Similarly, CKD hazards gradually increased with higher baseline and time-varying DBPs (Fig. 2C, D). The lowest CKD hazard was shown in people with a time-varying SBP between 100 and 119 mmHg, and that CKD hazard was nearly constant in those with a time-varying DBP < 80 mmHg.
Subgroup analyses
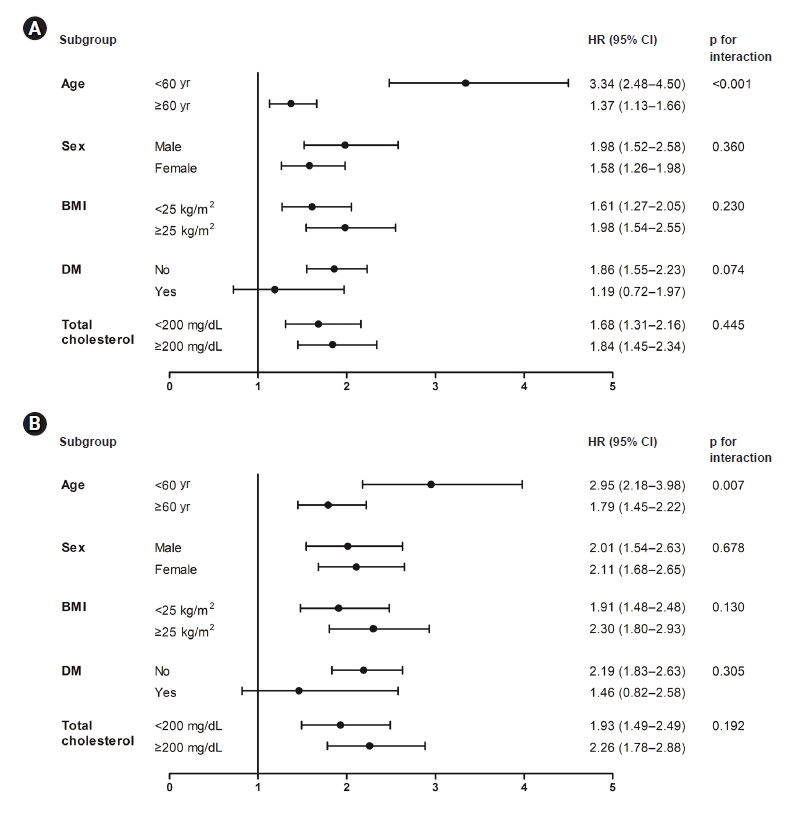
In subgroup analyses, we assessed interactions between time-varying BPs and stratified subgroups (time-updated age, sex, time-updated BMI, baseline DM, and time-updated total cholesterol) using a likelihood ratio test. Subjects were categorized into two groups based on SBP ≥ 130 mmHg and DBP ≥ 90 mmHg, both of which are associated with increased CKD risk. The association of SBP and DBP with incident CKD was consistent across all subgroups (Fig. 3). However, age had a significant interaction with the relationship between time-varying BP and incident CKD. The CKD risk increased significantly in both age groups (<60 years and ≥60 years), but the risk in the subgroup of patients aged <60 years was higher.
Relationship between blood pressure and incident cardiovascular disease
Because the BP thresholds associated with an increased CVD risk might differ from those associated with CKD risk, we also analyzed the incident CVD risk according to BP. During follow-up, 404 CVD events (5.5%) occurred, and the crude incidence rate was 7 (95% CI, 6–7) per 1,000 person-years. The multivariable Cox proportional hazard regression analysis for incident CVD is presented in Table 3. Consistent with incident CKD, time-varying SBP 130–139 mmHg (HR, 1.61; 95% CI, 1.19–2.18; p = 0.002), 140–159 mmHg (HR, 2.34; 95% CI, 1.72–3.17; p <0.001), and ≥160 mmHg (HR, 2.88; 95% CI, 1.84–4.50; p < 0.001) were significantly associated with increased CVD risk compared with SBP 100–119 mmHg. Results were similar in the DBP groups; a significant increase in incident CVD risk was observed with time-varying DBP 90–99 mmHg (HR, 1.69; 95% CI, 1.26–2.25; p < 0.001) and ≥100 mmHg (HR, 3.31; 95% CI, 2.34–4.70; p < 0.001) compared with DBP 70–79 mmHg.
Discussion
Using data from 7,343 subjects not taking antihypertensive medications, we demonstrated a graded association between time-varying BP and CKD development. Compared with the reference categories of SBP 100–119 mmHg and DBP 70–79 mmHg, CKD risk increased from SBP ≥ 130 mmHg and DBP ≥ 90 mmHg. Those BP thresholds were consistent when evaluating the association between BP and CVD risk. These results indicate that BP control interventions in treatment-naïve individuals should start when the SBP or DBP reaches 130 mmHg or 90 mmHg, respectively, to prevent CVD and CKD.
Several observational studies have shown that an increase in SBP is associated with a substantial risk of CKD in the general population [11,18–23]. However, considerable uncertainty remains about the SBP level that leads to CKD. The SBP threshold associated with increased CKD risk has been reported as 120–140 mmHg in previous studies. This inconsistency among studies can largely be explained by differences in the baseline characteristics of the various study populations. Importantly, because the aforementioned studies included subjects without regard to the use of antihypertensive medications, a substantial proportion of those subjects used antihypertensive drugs at baseline or during follow-up. It is noteworthy that the relationship between BP and patient outcomes can vary depending on the use of antihypertensive medications. A previous study reported that the association between BP and cardiorenal death was J-shaped in users of antihypertensive medications, whereas the association was linear in non-users [24]. In that study, the risk of end-stage kidney disease was significantly higher in antihypertensive users than in non-users, even if they were in the same BP categories. Therefore, previous observational studies cannot be used to identify a BP threshold associated with an increased CKD risk in treatment-naïve individuals. In this study, we began by excluding patients taking antihypertensive medications at baseline. However, excluding all subjects who started taking antihypertensive medication during follow-up can lead to selection bias. Therefore, we included those subjects at baseline and censored them when they started taking antihypertensive medications during follow-up. As a result, we found that SBP ≥ 130 mmHg and DBP ≥ 90 mmHg are indications for HTN management to prevent CKD in treatment-naïve individuals.
The relationship between baseline BP and CKD was J-shaped; however, after accounting for time-varying risk factors, that association disappeared, and CKD risk remained similar among subjects with BP lower than the threshold values. A J- or U-shaped relationship between BP values and CVD was previously reported [25,26]. In addition, some studies have shown a linear association between BP and CKD [23,24], whereas other studies found that those with low BP did not have a lower risk of CKD [21,27]. The high risk of CKD or CVD in people with low BP could be a result of a cardiovascular burden that produces both low BP and adverse outcomes. In this study, we included subjects with a low CVD risk and excluded those with a history of CVD or CKD. Importantly, a meta-analysis of 7 RCTs using time-updated BP values showed that the J-shaped association between low BP at baseline and mortality during follow-up was explained by poor health conditions, not BP-specific events [28]. In our study, the low SBP (<100 mmHg) group had lower BMI, albumin, and hemoglobin levels than the subjects in other groups, indicating poor nutritional status. Thus, although the detrimental nutritional status could contribute to low baseline BP and a high risk of CKD, a time-dependent analysis might mitigate the confounding effect of nutritional status on the relationship between BP and CKD. This discrepancy between baseline and time-varying BPs in our study was in agreement with the results of a previous large observational study conducted in Hong Kong [29]. Nevertheless, our results do not support the linear association between BP and CKD presented in large observational studies [23,24]. Therefore, further large observational studies and meta-analyses are needed to identify whether ‘the lower the better’ concept can be applied to treatment-naïve individuals with a low risk of CVD.
Although high SBP has been reported to be associated with both renal and cardiovascular complications [30–32], reports regarding its effects on CKD and CVD risks have conflicted. The SPRINT study reported that intensive SBP control, targeted to 120 mmHg, was associated with a reduction in the risk of CVD [8]. However, no favorable effect of intensive BP control on CVD events was found in the Action to Control Cardiovascular Risk in Diabetes (ACCORD) study [9]. Importantly, both SPRINT and ACCORD reported that more patients without baseline CKD in the intensive SBP control group experienced eGFR reduction [10]. However, those results cannot be applied to treatment-naïve individuals because those RCTs were conducted for patients with a high CVD risk who had already taken antihypertensive medications. We examined the relationship between BP and CVD as a secondary outcome in our study and found that the BP thresholds associated with increased CKD and CVD risks were the same: SBP ≥ 130 mmHg and DBP ≥ 90 mmHg. These findings suggest that SBP ≥ 130 mmHg or DBP ≥ 90 mmHg should be the points to begin BP control intervention in treatment-naïve individuals. Due to the nature of our study, we cannot provide an ‘optimal target’ BP that will reduce CKD or CVD risks. Therefore, further RCTs are warranted to establish appropriate BP targets for reducing both CKD and CVD risk in the treatment-naïve population.
In our study, the relationship between SBP and CKD was more pronounced in participants younger than 60 years than in those older than 60 years. Although the prevalence of HTN and CKD increases with age [33,34], conflicting results have been reported about the age-specific relationship between CKD and SBP. Previous studies have reported that older patients with HTN had a prominent [35], similar [11], or attenuated [36,37] risk of CKD compared with younger patients. This discrepancy might be caused by differences in patient characteristics, statistical methods, or whether the use of antihypertensive medication was considered. Interestingly, previous large cohort studies have reported that the relationships between BP and several CVD outcomes were robust in young adults and tended to attenuate with increasing age [1,36,38]. Therefore, because CKD and CVD share common risk factors, the age-specific risk of CKD might be similar to the risk of CVD. The high risk of CKD in subjects <60 years might be caused by low awareness and treatment rates of HTN [39]. However, we excluded subjects treated with antihypertensive medication at baseline and censored those newly treated during the follow-up period. Therefore, our findings indicate that more efforts should be made to improve the detection and management of HTN, especially in people aged <60 years.
The strengths of our study include a well-validated, representative cohort consisting only of individuals not taking antihypertensive medication. This stringent approach helped us to show a correct and natural course of CKD development in subjects who had not taken antihypertensive medications. Moreover, our cohort had a long follow-up duration, and changes in risk factors over time were considered through the use of time-varying covariates. Nevertheless, this study also has some limitations. First, our observational study cannot exclude the possibility of residual confounding by unmeasured variables, despite our comprehensive adjustment for confounders. Second, some misclassification could arise because BP was measured biennially and was not measured using 24-hour ambulatory monitoring [40], and the assessment of antihypertensive and CVD medication intake was based on participants’ self-report questionnaires. However, the use of time-varying covariates at least partly compensates for the possibility of those measurement errors. Third, we had no data to explain why participants did not take antihypertensive medications, even though they met the criteria for HTN. They might have been advised to make lifestyle modifications, have declined medication intake, or been lost to follow up. Finally, our results might not be applicable to other countries with various races and socioeconomic statuses because our study involved only Koreans.
In conclusion, an SBP ≥ 130 mmHg or DBP ≥ 90 mmHg was associated with an increased risk of incident CKD in treatment-naïve individuals. Therefore, BP-lowering interventions should be considered when BP exceeds those thresholds to prevent CKD in treatment-naïve individuals.
 PDF Links
 PubReader
 ePub Link
 Full text via DOI
 Download Citation
 Supplement 1
 Print
Print


")


