Current characteristics of dialysis therapy in Korea: 2015 registry data focusing on elderly patients
Article information
Abstract
Because of increases in the elderly population and diabetic patients, the proportion of elderly among dialysis patients has rapidly increased during the last decades. The mortality and morbidity of these elderly dialysis patients are obviously much higher than those of young patients, but large analytic studies about elderly dialysis patients' characteristics have rarely been published. The registry committee of the Korean Society of Nephrology has collected data about dialysis therapy in Korea through an Internet online registry program and analyzed the characteristics. A survey on elderly dialysis patients showed that more than 50% of elderly (65 years and older) patients had diabetic nephropathy as the cause of end-stage renal disease, and approximately 21% of elderly dialysis patients had hypertensive nephrosclerosis. The proportion of elderly hemodialysis (HD) patients with native vessel arteriovenous fistula as vascular access for HD was lower than that of young (under 65 years) HD patients (69% vs. 80%). Although the vascular access was poor and small surface area dialyzers were used for the elderly HD patients, the dialysis adequacy data of elderly patients were better than those of young patients. The laboratory data of elderly dialysis patients were not very different from those of young patients, but poor nutrition factors were observed in the elderly dialysis patients. Although small surface area dialyzers were used for elderly HD patients, the urea reduction ratio and Kt/V were higher in elderly HD patients than in young patients.
Introduction
The number of end-stage renal disease (ESRD) patients under maintenance dialysis therapy has increased very rapidly in recent decades because of the increase of the elderly population and diabetic patients. The increase of dialysis patients in Korea was approximately 7–10% per year during several recent years, and the proportion of diabetic and elderly dialysis patients also increased [1], [2], [3], [4]. The mortality and morbidity of these elderly dialysis patients are obviously much higher than those of young patients, but a large analytic study about elderly dialysis patients' characteristics has rarely been published.
The Korean Society of Nephrology (KSN) performed a nationwide official survey program about dialysis therapy through an Internet online registry system. We, the registry committee of KSN, analyzed the characteristics, especially focused on elderly dialysis patients.
Methods of data collection
The Internet questionnaire for dialysis patient registration is run by KSN all year round, and it includes dialysis center information and patient personal medical information, including vascular access for hemodialysis (HD), dialysis adequacy performance data, erythropoietin (EPO) dose, phosphate binders, laboratory data, and rehabilitation status. The registry program also has a graphic evaluation function of dialysis adequacy: single-pool Kt/V (spKt/V), normalized protein catabolic rate (nPCR), and a peritoneal equilibrium test. Every KSN member can access anytime the dialysis adequacy data of their own dialysis center, which could be of some help for dialysis prescription. The KSN ESRD registry response rate with patients' individual data was 67.1% in 2015.
Dialysis data from the KSN ESRD patient registry
Prevalence and incidence of ESRD
At the end of 2015, the ESRD patient number in Korea was reported as 87,014, of which 62,634 were HD patients, 7,352 were peritoneal dialysis (PD), and 17,028 were kidney transplantation (KT) patients (Fig. 1A). The patient per million population was HD 1,216, PD 143, KT 331, and overall 1,689. In addition, the proportions of HD, PD, and KT among renal replacement modalities were 72%, 8%, and 20%, respectively, at the end of 2015 (Fig. 1B).
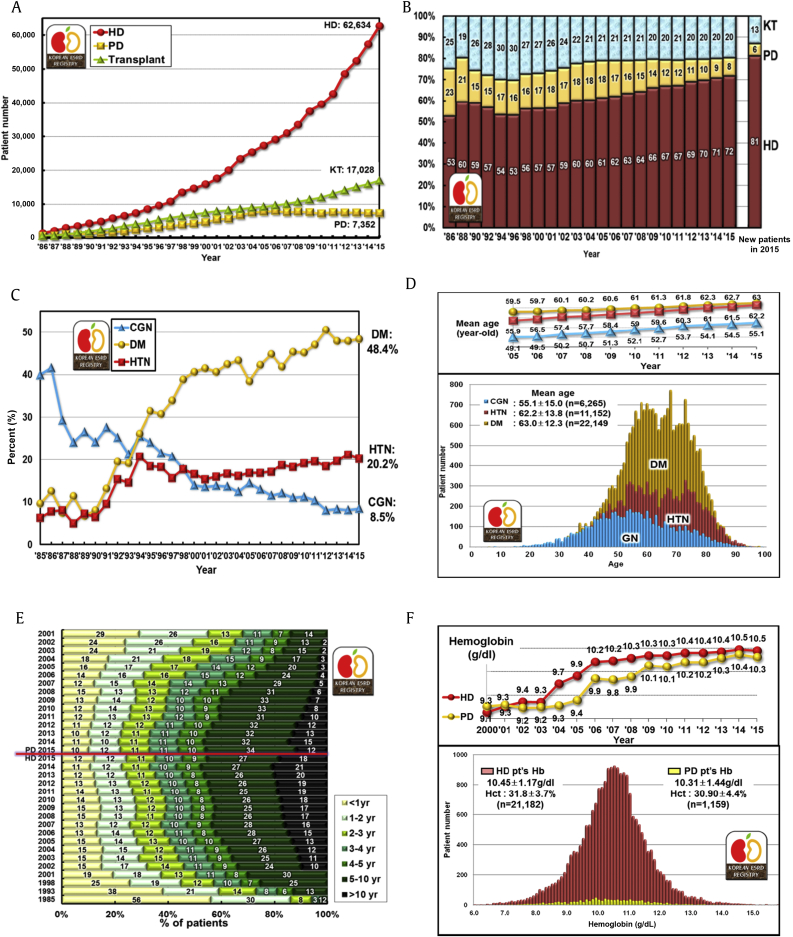
Dialysis prevalence and characteristics in Korea. (A) The number of patients with renal replacement therapy at the end of each year. (B) Proportion of renal replacement modalities, annual prevalence, and incidence. (C) The proportion changes of 3 major causes of ESRD. (D) Age distribution of dialysis patients according to underlying diseases. (E) Duration of maintenance HD and PD, and percent of estimated patient number according to the year. (F) Distribution of hemoglobin levels in HD and PD patients according to the year. CGN, chronic glomerulonephritis; DM, diabetic nephropathy; ESRD, end-stage renal disease; Hb, hemoglobin; Hct, hematocrit; HD, hemodialysis; HTN, hypertensive nephrosclerosis; KT, kidney transplantation; PD, peritoneal dialysis.
The number of new patients who initiated dialysis in 2015 was estimated at 12,865 (12,011 in HD, 854 in PD, and overall 250 per million population).
Underlying causes of ESRD
The most common underlying cause of ESRD was diabetic nephropathy, which accounted for 48.4% of new ESRD patients in 2015. The other common causes were hypertensive nephrosclerosis (20.2%) and chronic glomerulonephritis (8.5%). The proportion of diabetic patients in Korea was the highest in the world except for a couple of city states according to an international comparison published in the annual report of United States Renal Data System [5]. The diabetic patient proportion rapidly increased from 1990 to 2000 but slowly increased from 2000 to 2015 in Korea (Fig. 1C).
Dialysis centers and dialysis machines
The number of dialysis centers in Korea was 846, from which the non-KSN member centers (approximately 50 centers) had been excluded. The HD machine number was estimated to be 22,750 at the end of 2015. The average machine number per center was approximately 27, and the HD patients per HD machine ratio was 2.8. Approximately 44% of HD patients were under maintenance dialysis therapy at private clinics, 38% of patients were at a general hospital, and 18% of patients were at a university hospital. During the recent couple of years, the proportion of general hospitals was increasing because of the increase of dialysis facilities in nursing hospitals, which care mostly for elderly dialysis patients.
Dialysis patient characteristics
Gender ratio
The gender ratio (male vs. female) was 58%:42% in HD patients and 56%:44% in PD patients. The male dialysis patient number was much higher than female patient number in comparison to the general population. These ratios had no interval change during 20 years and were quite similar to the United States and Japan [5], [6].
ABO blood type
The ABO blood type ratio (A:B:AB:O) was 35%:27%:11%:27%, which was just the same as the general population.
Hepatitis B and C
Hepatitis B antigen positivity was 6%, and hepatitis C antibody positivity was 4% in HD patients in 2015. The percentages in PD patients were 6% and 3%, respectively.
Medical insurance status
Approximately 77% of dialysis patients were covered by national health insurance, and 19% were under medical aid programs in Korea at the end of 2015. The patients under medical aid were slowly decreasing.
Age
The average age of all dialysis patients was 60.8 ± 14.0 years in 2015, which had steadily increased from 55.2 years in 2005. The average age was 61.6 ± 13.8 years in HD patients and 55.7 ± 14.5 years in PD patients. The percentage of elderly patients (older than 65 years) was 41.9% in 2015, which had markedly increased from 28% in 2005. The average age of diabetic dialysis patients was 63.0 ± 12.3 years, that of hypertensive nephrosclerosis patients was 62.2 ± 13.8 years, and that of chronic glomerulonephritis patients was 55.1 ± 15.0 years in 2015 (Fig. 1D).
Duration of dialysis maintenance
Approximately 18% of HD patients were under dialysis therapy for more than 10 years, 27% for 5–10 years, and 12% for less than 1 year. Only 12% of PD patients were under dialysis for 10 years or more (Fig. 1E). In addition, approximately 9% of diabetic HD patients were under dialysis for over 10 years, but 26% of nondiabetic HD patients were under dialysis for 10 years or more. These data suggested that the survival of HD and nondiabetic patients was longer than that of PD and diabetic patients.
Body mass index
The average body mass index (the body weight in kilograms divided by square of the body height in meters) of HD patients was 22.3 ± 3.7 kg/m2 and that of PD patients was 24.1 ± 3.8 kg/m2 in 2015. These also had steadily increased from 21.4 and 23.2 kg/m2 in 2005.
Blood pressure
The mean arterial pressure was 99.6 ± 12.4 mmHg for HD patients and 98.2 ± 13.9 mmHg for PD patients in 2015. These mean arterial pressures had been decreasing from those of 2005, which were 104.9 and 100.4 mmHg. The mean pulse pressure (the difference between systolic blood pressure and diastolic pressure) of HD patients was 65.9 ± 17.8 mmHg, which was much higher than that of PD patients (53.6 ± 13.9 mmHg).
Dialysis therapy characteristics
Frequency of HD and hemodiafiltration
Approximately 91% of HD patients were under a thrice-per-week schedule; only 7% were under a twice-per-week schedule (Fig. 2A). The percentage had minimally changed from 2005. Hemodiafiltration therapy was still not popular, which was applied to only 15% of the HD patients.
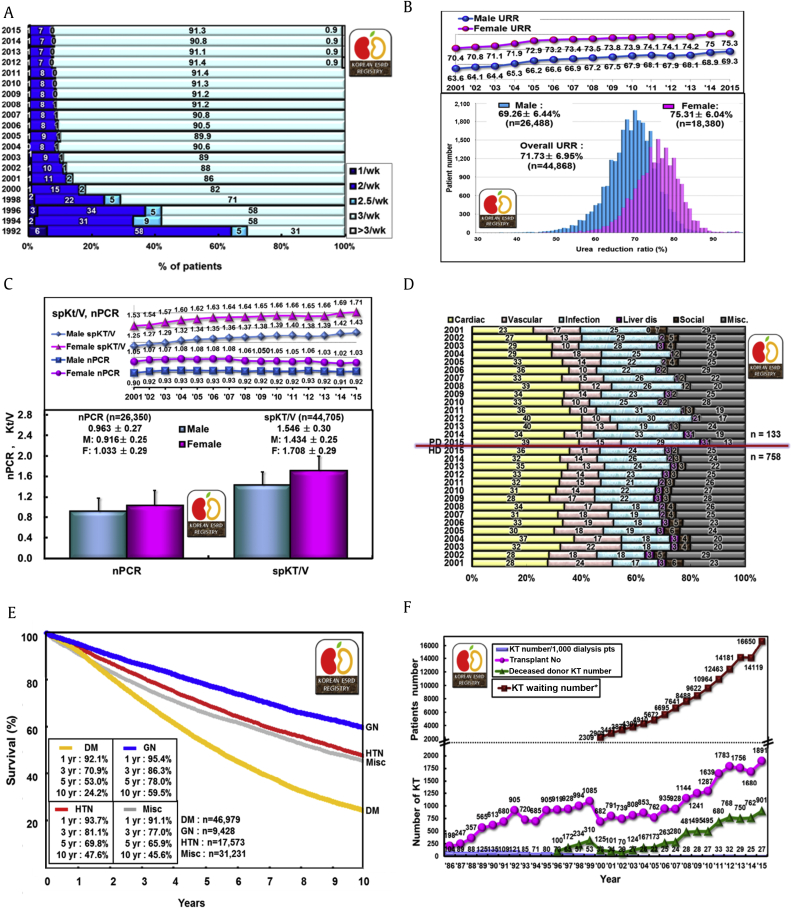
Dialysis characteristics. (A) Frequency of HD per week. (B) Distribution of URR of HD patients. Note the difference between males and females. (C) Dialysis adequacy parameters (nPCR and Kt/V) of HD patients. (D) Comparison of death causes, HD versus PD patients. (E) Patient survival rates according to underlying diseases (dialysis patients registered to Korean Society of Nephrology registry since 2001). (F) Annual number of KTs in Korea (including data from the Korean Network for Organ Sharing). *Surviving KT-waiting patient number at the end of each year. DM, diabetic nephropathy; ESRD, end-stage renal disease; F, female; GN, glomerulonephritis; HD, hemodialysis; HTN, hypertension; KT, kidney transplantation; M, male; Misc, miscellaneous; nPCR, normalized protein catabolic rate; PD, peritoneal dialysis; spKt/V, single-pool Kt/V; URR, urea reduction ratio.
Dialyzer and dialysate
The usage of large surface area dialyzers had been slowly increasing, but still 52% of HD patients received their dialysis therapy with a dialyzer of less than 1.5 m2 surface area, and a dialyzer with 1.5–2.0 m2 surface area was applied to 44% of HD patients. Bicarbonate dialysate was used for approximately 97% of HD patients, dialysate with glucose was used for 68% of HD patients, and low calcium dialysate was used for 6% of HD patients.
Vascular access
An autologous arteriovenous fistula (AVF) was used in 76% of HD patients, an arteriovenous graft shunt was used in 15%, and a subcutaneous tunneled catheter was used in 7% of HD patients. Approximately 45% of HD patients had an AVF on the left forearm, and 19% had a fistula on the left upper arm in 2015.
PD catheters
Approximately 39% of PD patients had a swan neck PD catheter, and 18% had a swan neck PD catheter with a coiled tip in 2015. The PD catheter was inserted by surgery in 63% and by trochar in 37% of newly started PD patients in 2015. The break-in period for a new PD catheter was approximately 2–3 weeks in 48% of new patients.
PD type and doses
An automated PD program was applied to approximately 27% of PD patients in 2015. Approximately 52% of PD patients used 8–10 L/d of dialysate.
Anemia and EPO therapy
The mean hemoglobin level of HD patients was 10.5 ± 1.17 g/dL and that of PD patients was 10.3 ± 1.44 g/dL in 2015 (Fig. 1F). More than 12,000 units/wk of EPO was injected to 31% of HD patients, but only 15% of HD patients had not used EPO. Among PD patients, only 24% used more than 12,000 units/wk of EPO and 21% had no EPO. For the purpose of this analysis, the darbepoetin (Nesp, Kyowa-Hakko-Kirin Korea) and methoxy polyethylene glycol-epoetin beta (Mircera, Roche Korea) were calculated by conversion factor of EPO.
Calcium and phosphorus control
The mean calcium level of HD patients was 8.90 ± 0.86 mg/dL and that of PD patients was 8.62 ± 0.92 mg/dL in 2015. The mean phosphorus level of HD patients was 4.84 ± 1.62 mg/dL and that of PD patients was 5.15 ± 1.64 mg/dL. The average parathyroid hormone (PTH) level of HD patients was 223.9 ± 240 pg/mL, but the PTH levels showed an extremely skewed right tail distribution, the most frequent value being approximately 30–100 pg/mL.
Calcium carbonate or calcium acetate was applied to 67% of HD patients, and sevelamer or lanthanum was applied to 12% of HD patients as phosphate binders. For PTH control, approximately 24% of HD patients were prescribed vitamin D, and cinacalcet was prescribed to only 2% of HD patients.
Miscellaneous laboratory data
The average albumin level of HD patients was 3.86 ± 0.47 g/dL and that of PD patients was 3.49 ± 0.51 g/dL in 2015. The average creatinine level of HD patients was 9.05 ± 3.1 mg/dL and that of PD patients was 10.28 ± 4.1 mg/dL. The average total cholesterol level of HD patients was 144.3 ± 36.2 mg/dL and that of PD patients was 167.3 ± 42.3 mg/dL. The average uric acid level of HD patients was 6.91 ± 1.7 mg/dL and that of PD patients was 6.79 ± 1.7 mg/dL. The average hemoglobin A1c level of diabetic HD patients was 6.75 ± 1.5% and that of diabetic PD patients was 6.64 ± 1.6 g/dL.
Dialysis adequacy
The overall urea reduction ratio of HD patients was 71.7 ± 6.95% in 2015. The average urea reduction ratio of male HD patients was 69.3 ± 6.4% and that of female patients was 75.3 ± 6.13%, which had been steadily increasing from 63.6% to 70.4% in male and female patients in 2001 (Fig. 2B). The nPCR of HD patients had a minimal change from 2001 to 2015 (male patients: from 0.90 to 0.92; female patients: from 1.05 to 1.03), but spKt/V steadily increased (males: from 1.05 to 1.43; females: from 1.53 to 1.71) (Fig. 2C).
Rehabilitation, comorbidity, and causes of death
At the end of 2015, approximately 36% of PD patients had a full-time job, but only 22% of HD patients had a full-time job. In contrast, 16% of HD patients and 11% of PD patients were dependent on daily living or in a bedridden state. The most common comorbid disease reported in 2015 was vascular diseases, which affected 48.3% of HD patients and 54.1% of PD patients. Coronary artery disease also affected 9.0% of HD patients and 6.8% of PD patients. The most common cause of death in HD patients was cardiac related (36%), and the next most common cause was infection (24%). Among PD patients, cardiac death occurred in 39%, and death due to infection occurred in 29% in 2015 (Fig. 2D).
Survival of dialysis patients
The 5-year patient survival rate of KSN-registered dialysis patients since 2001 was 60.4% in male patients and 63.3% in female patients. The 5-year diabetic patient survival rate was approximately 53%, which was significantly lower than that of the patients with underlying chronic glomerulonephritis (78%) or hypertensive nephrosclerosis (69.8%, Fig. 2E).
Kidney transplantation
According to data from the Korean Network for Organ Sharing, the number of KT in 2015 was 1,891, of which 901 were from deceased donors in Korea. The KT waiting patient number was 16,650 at the end of 2015 (Fig. 2F).
Characteristic of elderly dialysis patients
The percentage of elderly patients (65 years and older) was 41.9% in 2015, which had increased over 1 percentage point per year (Fig. 3A). The gender ratio (male to female) of elderly dialysis patients was 55%:45%, but the ratio in young (under 65 years) patients was 61%:39% (Fig. 3B).
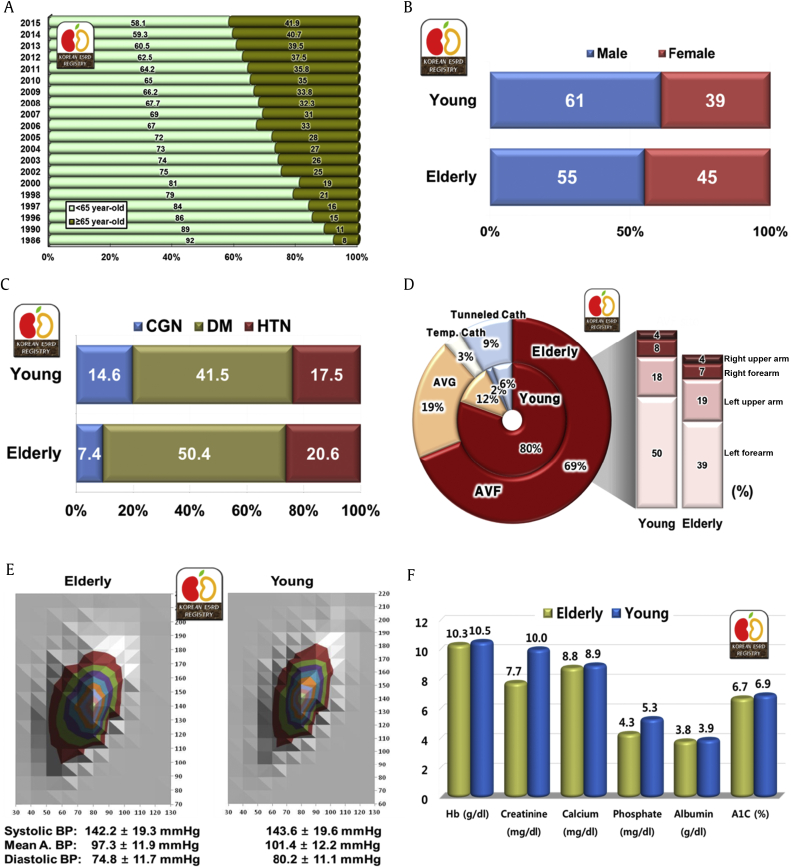
Characteristics of elderly dialysis patients (I). (A) Elderly dialysis patients' (older than 65 years) proportion according to year. (B) Gender ratio of elderly dialysis patients compared with young patients. Young, < 65 years and elderly, ≥ 65 years. (C) Causes of ESRD. (D) Vascular access of elderly hemodialysis patients. (E) Blood pressure comparison between elderly and young dialysis patients. Note the wide pulse pressure of elderly dialysis patients. (F) Various laboratory data comparison between elderly and young dialysis patients. ABP, arterial blood pressure; AVF, arteriovenous fistula; AVG, arteriovenous graft; BP, blood pressure; CGN, chronic glomerulonephritis; DM, diabetic nephropathy; ESRD, end-stage renal disease; Hb, hemoglobin; HTN, hypertensive nephropathy; temp. cath, temporary catheter..
Among the causes of ESRD in elderly dialysis patients, diabetic nephropathy had a much higher proportion (50.4%) than that in young dialysis patients (41.5%). The second and third causes of ESRD were hypertensive nephrosclerosis (20.6%) and chronic glomerulonephritis (7.4%); in contrast, the underlying disease proportions for young HD patients were 41.5%, 17.5%, and 14.6%, respectively.
The proportion of elderly dialysis patients with a HD catheter was 12% (subcutaneous tunneled catheter, 9% and temporary catheter, 3%), which was higher than that of young dialysis patients (8%). The proportion of elderly HD patients with a native vessel AVF as vascular access for HD was lower than that of young HD patients (69% vs. 80%); therefore, the proportion of elderly patients with an arteriovenous graft was also higher (19%) than that of young patients (12%). Among the AVF sites, the left forearm was the most frequent (39%) but much less than that of young patients (50%; Fig. 3D).
The mean systolic blood pressure in elderly dialysis patients was 142.2 ± 19.3 mmHg and the mean diastolic blood pressure was 74.8 ± 11.7 mmHg (mean arterial pressure was 97.3 ± 11.9 mmHg). The diastolic blood pressure distribution of elderly patients was a little wider than that of young patients (Fig. 3E).
Regarding laboratory data, the mean serum creatinine and phosphate levels of elderly patients were significantly lower than those of young patients (7.7 vs. 10.0 mg/dL and 4.3 vs. 5.3 mg/dL), and hemoglobin, calcium, albumin, and A1c levels were slightly lower than those of young dialysis patients (10.3 vs. 10.5 g/dL, 8.8 vs. 8.9 mg/dL, 3.8 vs. 3.9 g/dL, and 6.7 vs. 6.9%, respectively; Fig. 3F).
A dialyzer with 1.0–1.5 m2 surface area was most frequently used for elderly HD patients (58.6%), but dialyzers with larger surface area were used for young patients (1.5–2.0 m2; 46.1% and over 2.0 m2; 6.4%; Fig. 4A). However, the urea reduction ratio and spKt/V of elderly HD patients were higher than those of young patients (72.4% vs. 70.9% and 1.56 vs. 1.52). The nPCR of elderly patients was lower than that of young patients (0.93 vs. 0.97; Fig. 4B).
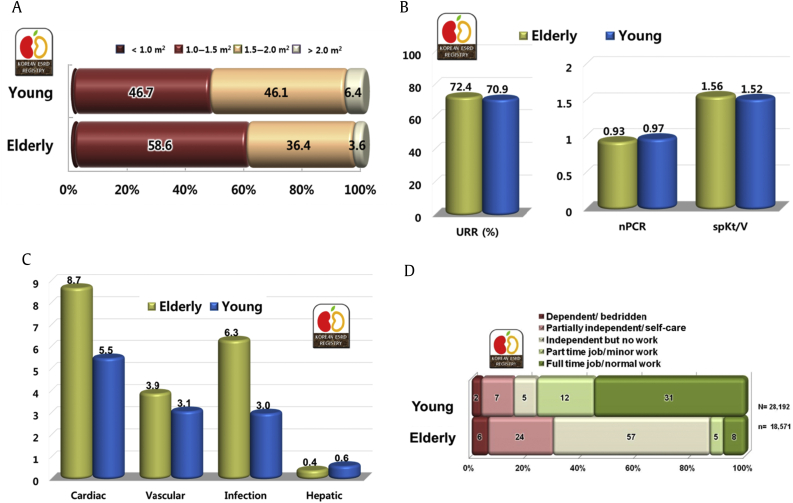
Characteristics of elderly dialysis patients (II). (A) Dialyzer surface area of elderly and young hemodialysis patients. (B) Hemodialysis adequacy comparison of elderly and young dialysis patients. (C) Complication prevalence rate comparison of elderly and young dialysis patients. (D) Rehabilitation status of elderly dialysis patients. ESRD, end-stage renal disease; nPCR, normalized protein catabolic rate; spKt/V, single-pool Kt/V; URR, urea reduction ratio.
Cardiac disease and infectious diseases were the most frequent comorbid diseases in elderly dialysis patients (8.7% and 6.3%), being much higher than the rates in young patients (Fig. 4C). As expected, the rehabilitation rate of elderly patients was much lower than that of young patients (for elderly dialysis patients with a full-time job, it was only 8%, but for young dialysis patients with a full-time job, it was 31%; Fig. 4D).
Discussion
In a brief summary of dialysis therapy in Korea during last decades, the HD patient number rapidly increased, and the proportion of elderly and diabetic patients among those HD patients also increased. Anemia control, blood pressure control, and adequacy of dialysis improved continuously, data of which were published in previous KSN ESRD reports [1], [2], [3], [4].
In this year's report of the KSN ESRD registry, the elderly dialysis patient characteristics were statistically materialized. As the elderly population in Korea rapidly increased, the elderly population proportion reached 13.1%, and the life expectancy at birth was estimated as 82.4 years in 2015 according to the government statistical service. However, the proportion of elderly was much higher in the disease population; the elderly proportion in dialysis patients gradually increased to about half of all dialysis patients. The increase of elderly dialysis patients was also associated with a newly launched health reimbursement system for affiliated dialysis facilities of nursing hospitals.
Another aspect of elderly dialysis patients was the underlying disease of diabetic nephropathy. The diabetic ESRD patient usually had the comorbidity of coronary vascular disease and was highly susceptible to infection also, which resulted in a quite lower survival rate than dialysis patients with other underlying causes. These findings were also observed in United States Renal Data System and Japanese dialysis data [5], [6]. The 5-year survival of diabetic dialysis patients was approximately 53% but that of chronic glomerulonephritis patients was 78% in the KSN ESRD registry since 2001 (Fig. 2E).
As expected, the vascular access was poor according to the AVF site (Fig. 3D), and smaller surface area dialyzers were used for the elderly HD patients. However, the dialysis adequacy of elderly patients was better than that of young patients likely because of the body mass difference.
The laboratory data on elderly dialysis patients were not much different from those of young patients, but the overall laboratory data that reflect nutritional status in a broad concept, such as hemoglobin, albumin, phosphate, and nPCR, were all lower than those of young patients, which is a point that dialysis medical staff should be aware of.
Conclusion
We, the KSN ESRD patient registration committee, have been performing ESRD patient registration continuously, and we present the data from 2015 in this report, especially about elderly (65 years and older) dialysis patients. The HD patient number has rapidly increased, as has the proportion of elderly and diabetic patients among HD patients during the last decade in Korea. Anemia control, blood pressure control, and adequacy of dialysis have also improved continuously as in previous KSN ESRD reports. The elderly dialysis patient proportion increased more rapidly and reached about half of all dialysis patients recently. More than half of elderly patients had diabetic nephropathy as the cause of ESRD, and approximately 21% of elderly dialysis patients had hypertensive nephrosclerosis. Although the vascular access was poor and small surface area dialyzers were used for the elderly HD patients, the dialysis adequacy data were better for elderly patients than young patients. The laboratory data of elderly dialysis patients were not much different from those of young patients, but poor nutrition factors were observed in the elderly dialysis patients.
Conflicts of interest
All authors have no conflicts of interests to declare.
References
Acknowledgments
The ESRD Registry Committee of the KSN thanks all the medical doctors and nurses of dialysis centers in Korea for participating in this registry.