| Kidney Res Clin Pract > Volume 40(1); 2021 > Article |
|
Abstract
Background
Methods
Results
Notes
Funding
This study was supported by the Young Investigator Research Grant from the Korean Nephrology Research Foundation (2019).
AuthorsŌĆÖ contributions
Conceptualization: JHJ, SHA
Data curation: JHJ
Formal analysis: JHJ, MMK, SHA
Funding acquisition: JHJ
Investigation: JHJ, SHA, JHS
Methodology: JHJ, SHA
Project administration: JHJ, SHA, JHS
Visualization: JHJ, MMK, SHA
WritingŌĆōoriginal draft: JHJ, SHA
WritingŌĆōreview & editing: JHJ, SHA, MMK, JHS
All authors read and approved the final manuscript.
Acknowledgments
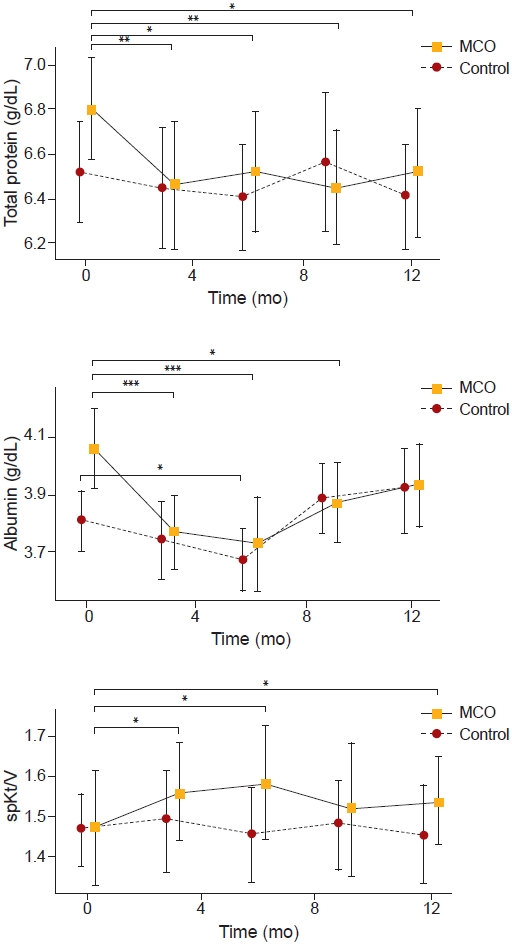
Figure┬Ā1.
The changes of total protein, albumin, and spKt/V over 12 months.

Figure┬Ā2.

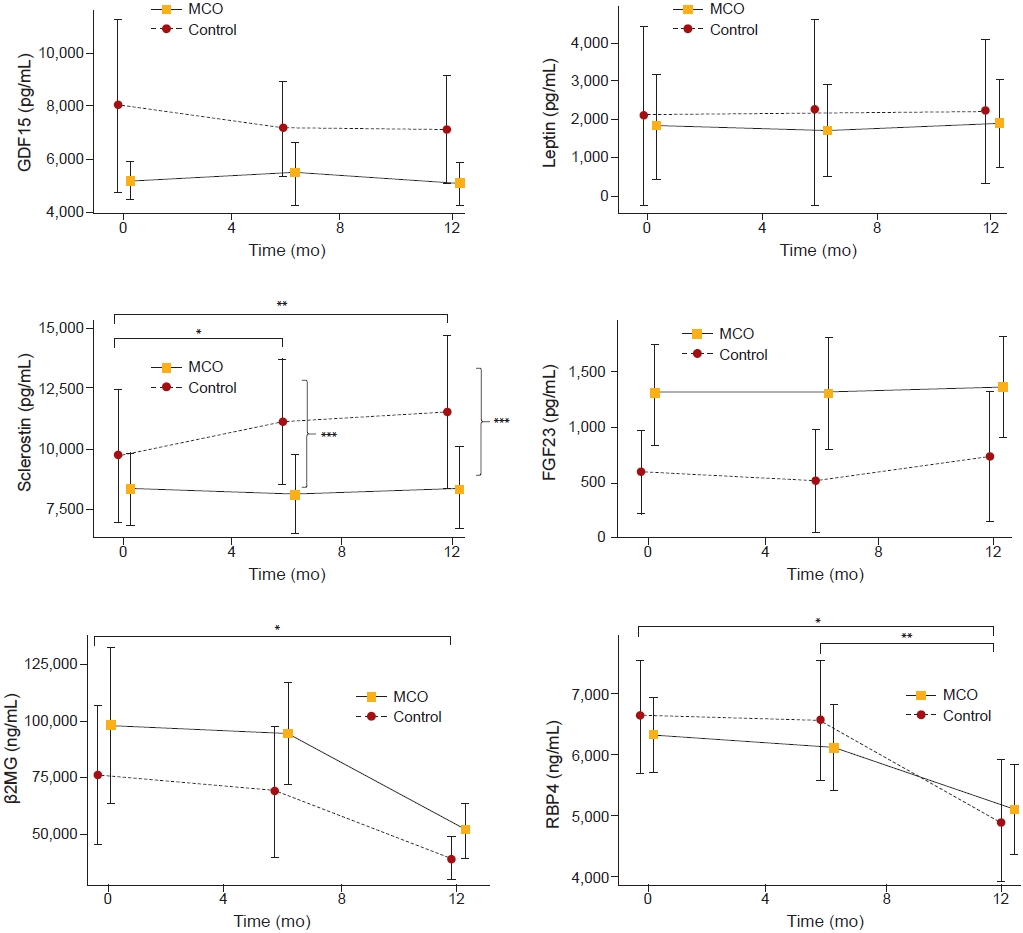
Figure┬Ā3.
The changes in predialytic levels of larger middle molecules over 12 months.

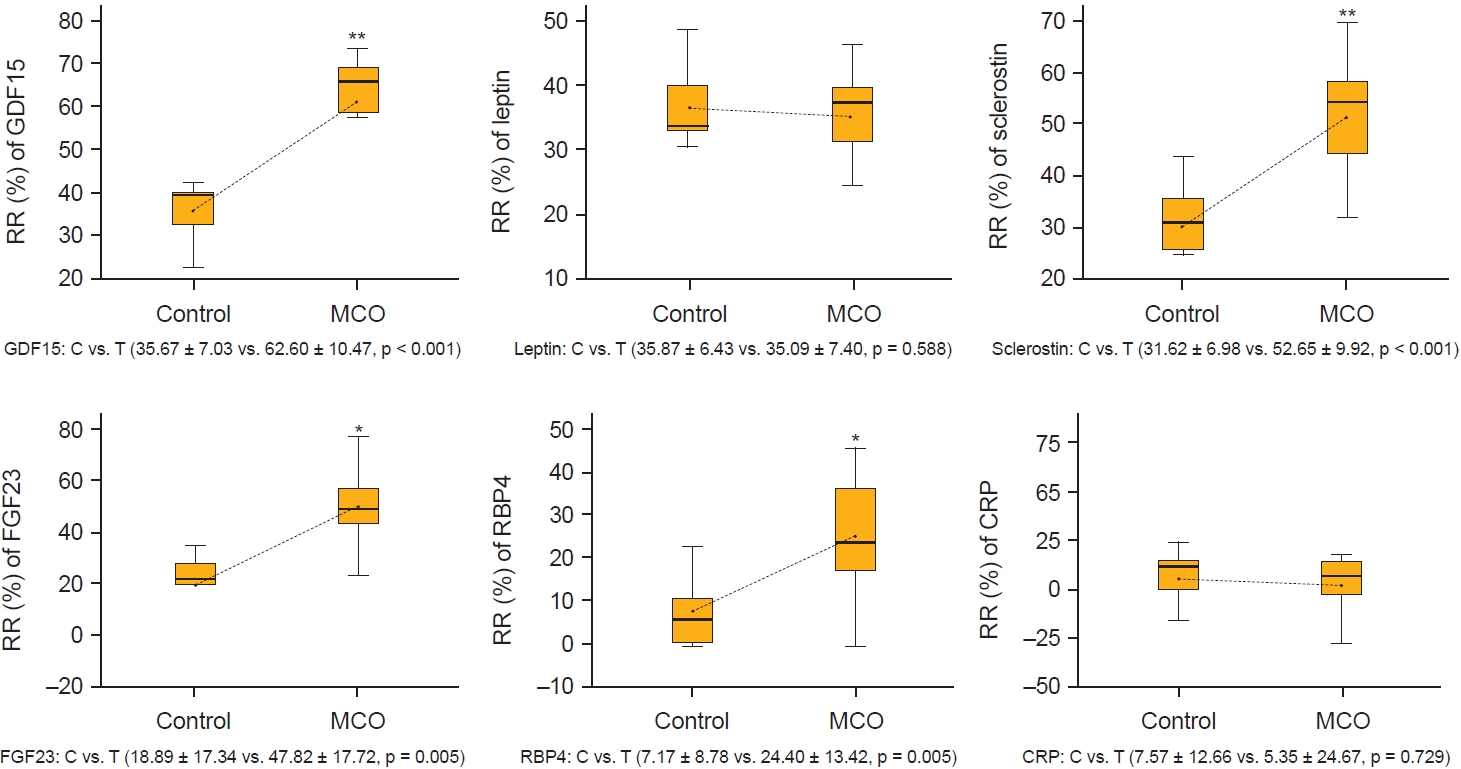
Figure┬Ā4.
The reduction ratios (RR) of larger middle molecules per session of hemodialysis at 12 months.

Figure┬Ā5.
The reduction ratios (RR) of small and middle molecules per session of hemodialysis at 12 months.

Table┬Ā1.
| Characteristic | Control group | MCO group | p-value |
|---|---|---|---|
| No. of patients | 18 | 16 | - |
| Sex, male:female | 13:5 | 9:7 | 0.180 |
| Age (yr) | 55.00 ┬▒ 7.57 | 47.88 ┬▒ 12.03 | 0.043* |
| HD duration (mo) | 35.00 (12.00ŌĆō66.25) | 36.00 (27.00ŌĆō65.50) | 0.557a |
| Frequency/wk | |||
| ŌĆā2 | 1 (5.6) | 1 (6.3) | 0.999b |
| ŌĆā3 | 17 (94.4) | 15 (93.8) | |
| Hypertension | 17 (94.4) | 14 (87.5) | 0.591b |
| Diabetes mellitus | 13 (72.2) | 9 (56.3) | 0.331 |
| Cv Cx | 4 (22.2) | 3 (18.8) | >0.999b |
| Cause | |||
| ŌĆāDMN | 13 | 9 | 0.454 |
| ŌĆāHN | 4 | 4 | |
| ŌĆāCGN | 0 | 2 | |
| ŌĆāPCKD | 1 | 1 | |
| Lab parameter | |||
| ŌĆāPTH (pg/mL) | 120.80 (68.46ŌĆō255.30) | 153.45 (102.20ŌĆō317.95) | 0.512a |
| ŌĆāCRP (mg/L) | 2.03 (0.87ŌĆō3.57) | 1.22 (0.64ŌĆō10.28) | 0.769a |
| ŌĆāAlbumin (g/dL) | 3.80 ┬▒ 0.22 | 4.07 ┬▒ 0.28 | 0.004* |
| ŌĆāTotal protein (g/dL) | 6.51 ┬▒ 0.44 | 6.80 ┬▒ 0.42 | 0.069 |
| ŌĆāHemoglobin (g/dL) | 10.31 ┬▒ 0.83 | 10.94 ┬▒ 1.73 | 0.237 |
| ŌĆāCalcium (mg/dL) | 9.22 ┬▒ 0.64 | 9.21 ┬▒ 0.64 | 0.877 |
| ŌĆāPhosphate (mg/dL) | 4.82 ┬▒ 1.46 | 6.31 ┬▒ 2.20 | 0.030* |
| ŌĆāspKt/V | 1.46 ┬▒ 0.18 | 1.47 ┬▒ 0.27 | 0.950 |
| ŌĆāFTI (kg/m2) | 9.14 ┬▒ 4.75 | 9.92 ┬▒ 3.48 | 0.263 |
| ŌĆāLTI (kg/m2) | 14.05 ┬▒ 2.47 | 14.56 ┬▒ 2.78 | 0.619 |
| ŌĆāOH (%ECW) | 17.63 ┬▒ 9.21 | 10.26 ┬▒ 11.22 | 0.030* |
| ŌĆāGDF15 (pg/mL) | 8,043.43 ┬▒ 3,491.54 | 5,245.67 ┬▒ 1,426.06 | 0.080 |
| Leptin (pg/mL) | 21,172.57 ┬▒ 25,480.09 | 18,146.72 ┬▒ 28,050.34 | 0.506a |
| ŌĆāSclerostin (pg/mL) | 9,606.6 ┬▒ 2,998.6 | 8,227.2 ┬▒ 3,082.9 | 0.322 |
| ŌĆāFGF23 (pg/mL) | 597.40 ┬▒ 405.35 | 1,294.05 ┬▒ 906.97 | 0.065 |
| ŌĆāRBP4 (ng/mL) | 66,522.00 ┬▒ 10,296.59 | 63,412.12 ┬▒ 13,115.55 | 0.582 |
| ŌĆā╬▓2MG (ng/mL) | 75,787.14 ┬▒ 32,591.76 | 97,553.53 ┬▒ 70,029.65 | 0.727a |
Data are expressed as number only, mean ┬▒ standard deviation, median (interquartile range), or number (%).
HD, hemodialysis; CGN, chronic glomerulonephropathy; CRP, C-reactive protein; Cv Cx, cardiovascular complications; DMN, diabetic nephropathy; ECW, extracellular water; FGF23, fibroblast growth factor 23; FTI, fat tissue index; GDF15, growth differentiation factor 15; HN, hypertensive nephropathy; LTI, lean tissue index; MCO, medium cut-off; OH, overhydration; PCKD, polycystic kidney disease; PTH, parathyroid hormone; RBP4, retinol-binding protein 4; spKt/V, single-pool Kt/V; ╬▓2MG, beta-2 microglobulin.
Table┬Ā2.
| Variable | Time from baseline (mo)┬Ā |
Mean change (95% CI) |
p-value within controla | p-value within MCOa | Adjusted mean difference between the groups (95% CI)c | p-value between groupsd | |
|---|---|---|---|---|---|---|---|
| Control group | MCO group | ||||||
| Phosphate (mg/dL) | 3 | ŌĆō0.178 (ŌĆō0.835 to 0.477) | ŌĆō0.406 (ŌĆō1.821 to 1.009) | 0.574 | 0.550 | 0.969 (ŌĆō0.291 to 2.228) | 0.127 |
| 6 | 0.553 (ŌĆō0.243 to 1.349) | ŌĆō0.206 (ŌĆō1.126 to 0.714) | 0.162 | 0.640 | ŌĆō0.202 (ŌĆō1.406 to 1.002) | 0.734 | |
| 9 | ŌĆō0.042 (ŌĆō0.698 to 0.613) | ŌĆō0.200 (ŌĆō1.293 to 0.893) | 0.894 | 0.702 | 0.556 (ŌĆō0.597 to 1.709) | 0.333 | |
| 12 | 0.642 (ŌĆō0.089 to 1.374) | ŌĆō0.463 (ŌĆō1.370 to 0.445) | 0.082 | 0.294 | ŌĆō0.572 (ŌĆō1.472 to 0.328) | 0.204 | |
| Calcium (mg/dL) | 3 | ŌĆō0.090 (ŌĆō0.350 to 0.171) | ŌĆō0.088 (ŌĆō0.378 to 0.203) | 0.479 | 0.531 | ŌĆō0.135 (ŌĆō0.476 to 0.205) | 0.423 |
| 6 | ŌĆō0.353 (ŌĆō0.745 to 0.040) | ŌĆō0.169 (ŌĆō0.478 to 0.140) | 0.075 | 0.262 | 0.097 (ŌĆō0.297 to 0.492) | 0.619 | |
| 9 | ŌĆō0.526 (ŌĆō0.858 to ŌĆō0.195) | ŌĆō0.656 (ŌĆō0.936 to ŌĆō0.377) | 0.004* | <0.001* | ŌĆō0.198 (ŌĆō0.513 to 0.117) | 0.210 | |
| 12 | ŌĆō0.547 (ŌĆō0.854 to ŌĆō0.241) | ŌĆō0.594 (ŌĆō0.929 to ŌĆō0.258) | 0.001* | 0.002* | ŌĆō0.011 (ŌĆō0.426 to 0.405) | 0.958 | |
| Hemoglobin (g/dL) | 3 | ŌĆō0.142 (ŌĆō0.658 to 0.374) | ŌĆō0.425 (ŌĆō0.961 to 0.111) | 0.570 | 0.121b | ŌĆō0.134 (ŌĆō0.941 to 0.672) | 0.736 |
| 6 | 0.058 (ŌĆō0.415 to 0.531) | ŌĆō0.331 (ŌĆō1.376 to 0.714) | 0.800 | 0.510 | ŌĆō0.161 (ŌĆō1.033 to 0.712) | 0.709 | |
| 9 | 0.016 (ŌĆō0.377 to 0.408) | ŌĆō0.594 (ŌĆō1.292 to 0.105) | 0.844b | 0.090 | ŌĆō0.502 (ŌĆō1.211 to 0.207) | 0.158 | |
| 12 | 0.047 (ŌĆō0.300 to 0.394) | ŌĆō0.344 (ŌĆō1.135 to 0.447) | 0.938b | 0.369 | 0.092 (ŌĆō0.567 to 0.752) | 0.777 | |
| Total protein | 3 | ŌĆō0.089 (ŌĆō0.272 to 0.094) | ŌĆō0.344 (ŌĆō0.526 to ŌĆō0.161) | 0.318 | 0.001* | ŌĆō0.191 (ŌĆō0.478 to 0.097) | 0.186 |
| (g/dL) | 6 | ŌĆō0.121 (ŌĆō0.291 to 0.049) | ŌĆō0.281 (ŌĆō0.489 to ŌĆō0.073) | 0.153 | 0.011* | ŌĆō0.063 (ŌĆō0.351 to 0.226) | 0.660 |
| 9 | 0.032 (ŌĆō0.203 to 0.266) | ŌĆō0.350 (ŌĆō0.569 to ŌĆō0.131) | 0.721 | 0.004* | ŌĆō0.263 (ŌĆō0.619 to 0.092) | 0.141 | |
| 12 | ŌĆō0.111 (ŌĆō0.297 to 0.077) | ŌĆō0.288 (ŌĆō0.506 to ŌĆō0.069) | 0.231 | 0.013* | ŌĆō0.052 (ŌĆō0.361 to 0.257) | 0.734 | |
| Albumin | 3 | ŌĆō0.090 (ŌĆō0.248 to 0.069) | ŌĆō0.313 (ŌĆō0.431 to ŌĆō0.194) | 0.250 | <0.001* | ŌĆō0.102 (ŌĆō0.318 to 0.115) | 0.345 |
| (g/dL) | 6 | ŌĆō0.163 (ŌĆō0.295 to ŌĆō0.031) | ŌĆō0.356 (ŌĆō0.490 to ŌĆō0.223) | 0.018* | <0.001* | ŌĆō0.127 (ŌĆō0.332 to 0.078) | 0.217 |
| 9 | 0.063 (ŌĆō0.072 to 0.199) | ŌĆō0.200 (ŌĆō0.353 to ŌĆō0.047) | 0.341 | 0.014* | ŌĆō0.137 (ŌĆō0.350 to 0.075) | 0.197 | |
| 12 | 0.095 (ŌĆō0.051 to 0.241) | ŌĆō0.138 (ŌĆō0.295 to 0.020) | 0.189 | 0.083 | ŌĆō0.147 (ŌĆō0.382 to 0.087) | 0.210 | |
| LTI (kg/m2) | 3 | ŌĆō0.032 (ŌĆō0.590 0.527) | ŌĆō0.475 (ŌĆō1.317 to 0.367) | 0.907 | 0.248 | ŌĆō0.162 (ŌĆō1.134 to 0.810) | 0.736 |
| 6 | ŌĆō0.084 (ŌĆō0.988 to 0.819) | ŌĆō0.881 (ŌĆō1.454 to ŌĆō0.309) | 0.847 | 0.005 | ŌĆō0.538 (ŌĆō1.626 to 0.550) | 0.321 | |
| 9 | ŌĆō0.369 (ŌĆō1.080 to 0.343) | ŌĆō0.150 (ŌĆō1.292 to 0.992) | 0.287 | 0.783 | ŌĆō0.118 (ŌĆō1.546 to 1.309) | 0.866 | |
| 12 | ŌĆō0.650 (ŌĆō1.360 to 0.060) | ŌĆō0.744 (ŌĆō1.492 to 0.005) | 0.070 | 0.066 | ŌĆō0.216 (ŌĆō1.270 to 0.838) | 0.679 | |
| FTI (kg/m2) | 3 | 38.316 (ŌĆō41.659 to 118.291) | 0.294 (ŌĆō0.525 to 1.112) | 0.334b | 0.456 | ŌĆō39.005 (ŌĆō135.068 to 57.057) | 0.414 |
| 6 | 1.232 (0.367 to 2.097) | 0.969 (0.117 to 1.820) | 0.008* | 0.028* | ŌĆō0.219 (ŌĆō1.564 to 1.126) | 0.742 | |
| 9 | 0.394 (ŌĆō0.728 to 1.515) | ŌĆō0.031 (ŌĆō1.662 to 1.599) | 0.466 | 0.679b | ŌĆō0.048 (ŌĆō2.100 to 2.004) | 0.962 | |
| 12 | 0.883 (0.147 to 1.620) | 0.981 (0.150 to 1.813) | 0.022* | 0.024* | 0.447 (ŌĆō0.701 to 1.595) | 0.432 | |
| OH (%ECW) | 3 | 1.668 (ŌĆō0.788 to 4.125) | 1.319 (ŌĆō3.362 to 5.999) | 0.171 | 0.557 | ŌĆō2.424 (ŌĆō7.076 to 2.229) | 0.296 |
| 6 | ŌĆō1.758 (ŌĆō5.512 to 1.996) | 0.681 (ŌĆō5.431 to 6.793) | 0.338 | 0.815 | ŌĆō1.448 (ŌĆō7.945 to 5.048) | 0.652 | |
| 9 | ŌĆō2.494 (ŌĆō6.528 to 1.540) | 0.213 (ŌĆō5.425 to 5.850) | 0.207 | 0.937 | 1.048 (ŌĆō5.157 to 7.253) | 0.732 | |
| 12 | ŌĆō0.842 (ŌĆō4.936 to 3.252) | 3.125 (ŌĆō3.382 to 9.632) | 0.671 | 0.163b | ŌĆō0.343 (ŌĆō6.270 to 5.584) | 0.907 | |
| spKt/V | 3 | 0.022 (ŌĆō0.057 to 0.102) | 0.092 (0.001 to 0.183) | 0.567 | 0.048* | 0.022 (ŌĆō0.097 to 0.140) | 0.712 |
| 6 | ŌĆō0.009 (ŌĆō0.086 to 0.068) | 0.115 (0.015 to 0.215) | 0.808 | 0.027 | 0.096 (ŌĆō0.033 to 0.226) | 0.140 | |
| 9 | 0.011 (ŌĆō0.054 to 0.075) | 0.046 (ŌĆō0.030 to 0.123) | 0.729 | 0.217 | 0.025 (ŌĆō0.084 to 0.134) | 0.645 | |
| 12 | ŌĆō0.015 (ŌĆō0.081 to 0.052) | 0.069 (ŌĆō0.123 to 0.150) | 0.639 | 0.041 | 0.068 (ŌĆō0.040 to 0.176) | 0.206 | |
| PTH (pg/mL) | 3 | 36.647 (ŌĆō11.606 to 84.901) | 102.893 (ŌĆō17.732 to 223.519) | 0.136b | 0.089b | 46.133 (ŌĆō50.287 to 142.554) | 0.336 |
| 6 | 30.532 (ŌĆō17.47078.533) | 38.051 (ŌĆō56.785 to 132.888) | 0.198 | 0.406 | 0.281 (ŌĆō109.516 to 110.077) | 0.996 | |
| 9 | 73.682 (ŌĆō3.298 to 150.662) | 162.109 (ŌĆō75.383 to 399.602) | 0.077b | 0.166b | 76.267 (ŌĆō138.308 to 290.843) | 0.474 | |
| 12 | 124.428 (6.765 to 242.093) | 163.216 (ŌĆō33.050 to 359.481) | 0.001b,* | 0.097b | ŌĆō28.583 (ŌĆō221.617 to 164.451) | 0.764 | |
| CRP (mg/L) | 3 | ŌĆō1.479 (ŌĆō2.872 to ŌĆō0.086) | 1.503 (ŌĆō4.874 to 7.880) | 0.039 | 0.569b | 3.530 (ŌĆō2.683 to 9.744) | 0.255 |
| 6 | ŌĆō0.586 (ŌĆō2.476 to 1.303) | ŌĆō2.641 (ŌĆō5.453 to 0.171) | 0.523 | 0.083b | ŌĆō0.772 (ŌĆō2.711 to 1.167) | 0.423 | |
| 9 | ŌĆō0.504 (ŌĆō1.609 to 0.601) | 0.068 (ŌĆō4.604 to 4.739) | 0.376b,* | 0.976 | 1.004 (ŌĆō3.043 to 5.051) | 0.616 | |
| 12 | ŌĆō0.683 (ŌĆō2.561 to 1.195) | ŌĆō0.963 (ŌĆō3.480 to 1.555) | 0.098b,* | 0.605b | 0.681 (ŌĆō2.311 to 3.672) | 0.645 | |
Table┬Ā3.
| Variable | Time (mo) |
Mean change (95% CI) |
p-value within controla | p-value within MCOa | Adjusted mean difference between the groups (95% CI)c | p-value between groupsd | |
|---|---|---|---|---|---|---|---|
| Control group | MCO group | ||||||
| GDF15 | 6ŌĆōbaseline | ŌĆō856.429 (ŌĆō3,232.594 to 1,519.736) | 254.667 (ŌĆō539.063 to 1,048.396) | 0.612 | 0.508 | 138.773 (ŌĆō1,785.977 to 2,063.524) | 0.544 |
| 12ŌĆōbaseline | ŌĆō889.286 (ŌĆō3,222.725 to 1,444.153) | ŌĆō118.111 (ŌĆō798.284 to 562.062) | 0.387 | 0.719 | ŌĆō593.600 (ŌĆō2,126.963 to 939.764) | 0.119 | |
| 12ŌĆō6 | ŌĆō32.857 (ŌĆō1,200.064 to 1,134.350) | ŌĆō372.778 (ŌĆō1,196.203 to 450.648) | 0.947 | 0.353 | ŌĆō1,063.359 (ŌĆō2,296.294 to 169.575) | 0.086 | |
| Leptin | 6ŌĆōbaseline | 829.714 (ŌĆō7,823.227 to 9,482.656) | ŌĆō933.239 (ŌĆō6,324.394 to 4,457.915) | 0.822 | 0.948b | ŌĆō2,229.025 (ŌĆō11,295.350 to 6,837.299) | 0.799 |
| 12ŌĆōbaseline | 1,051.286 (ŌĆō8,557.041 to 10,659.612) | 966.063 (ŌĆō8,405.512 to 10,337.640) | 0.798 | 0.267b | ŌĆō1,144.737 (ŌĆō14,473.017 to 12,183.543) | 0.841 | |
| 12ŌĆō6 | 221.571 (ŌĆō11,512.530 to 11,955.673) | 1,899.303 (ŌĆō4,885.581 to 8,684.188) | 0.965 | 0.199b | 562.211 (ŌĆō10,874.046 to 11,998.468) | 0.986 | |
| Sclerostin | 6ŌĆōbaseline | 1,437.1 (795.7 to 2,078.6) | ŌĆō188.9 (ŌĆō662.6 to 284.6) | 0.018b,* | 0.412 | ŌĆō1,616.7 (ŌĆō2,477.5 to ŌĆō755.9) | 0.001* |
| 12ŌĆōbaseline | 1,865.1 (875.6 to 2,854.6) | 135.3 (ŌĆō637.7 to 908.3) | 0.004* | 0.715 | ŌĆō1,646.9 (ŌĆō3,015.2 to ŌĆō278.7) | 0.033* | |
| 12ŌĆō6 | 428.0 (ŌĆō464.7 to 1,320.7) | 282.3 (ŌĆō247.7 to 812.3) | 0.285 | 0.276 | ŌĆō35.9 (ŌĆō1,098.2 to 1,026.3) | 0.952 | |
| FGF23 | 6ŌĆōbaseline | ŌĆō73.721 (ŌĆō336.639 to 189.196) | 14.018 (ŌĆō189.842 to 217.879) | 0.518 | 0.723b | 66.108 (ŌĆō321.391 to 453.607) | 0.637 |
| 12ŌĆōbaseline | 145.654 (ŌĆō174.767. 466.075) | 71.120 (ŌĆō202.381 to 344.621) | 0.309 | 0.590 | 25.928 (ŌĆō474.577 to 526.433) | 0.732 | |
| 12ŌĆō6 | 219.376 (ŌĆō48.828 to 487.580) | 57.102 (ŌĆō237.351 to 351.554) | 0.092 | 0.688 | 25.075 (ŌĆō466.596 to 516.745) | 0.385 | |
| RBP4 | 6ŌĆōbaseline | ŌĆō583.714 (ŌĆō12,401.678 to 11,234.249) | ŌĆō2,303.688 (ŌĆō8,207.863 to 3,600.488) | 0.908 | 0.419 | ŌĆō2,229.925 (ŌĆō12,792.592 to 8,332.742) | 0.648 |
| 12ŌĆōbaseline | ŌĆō17,337.286 (ŌĆō32,002.551 to ŌĆō2,672.020) | ŌĆō14,794.667 (ŌĆō21,606.880 to ŌĆō7,982.453) | 0.028* | 0.006b,* | 538.200 (ŌĆō10,878.671 to 11,955.072) | 0.977 | |
| 12ŌĆō6 | ŌĆō16,753.571 (ŌĆō27,344.178 to ŌĆō6,162.965) | ŌĆō12,334.400 (ŌĆō21,455.745 to ŌĆō3,219.055) | 0.008* | 0.012* | 597.652 (ŌĆō11,102.058 to 12,297.362) | 0.950 | |
| ╬▓2MG | 6ŌĆōbaseline | ŌĆō7,101.714 (ŌĆō23,190.394 to 8,986.965) | ŌĆō3,628.000 (ŌĆō34,071.355 to 26,815.355) | 0.322 | 0.803 | 17,504.945 (ŌĆō15,241.088 to 50,250.979) | 0.187 |
| 12ŌĆōbaseline | ŌĆō35,975.571 (ŌĆō67,157.403 to ŌĆō4,793.740) | ŌĆō61,236.067 (ŌĆō95,247.526 to ŌĆō27,224.607) | 0.030* | 0.001b,* | 1,085.527 (ŌĆō13,305.429 to 15,476.482) | 0.985 | |
| 12ŌĆō6 | ŌĆō28,873.857 (ŌĆō605,21.140 to 2,773.426) | ŌĆō51,036.667 (ŌĆō74,449.806 to ŌĆō27,623.527) | 0.067 | <0.0001* | 1,083.954 (ŌĆō14,389.169 to 16,557.078) | 0.964 | |
Table┬Ā4.
| ŃĆĆVariable |
ΔSclerostin |
|||
|---|---|---|---|---|
| Total | Control group | MCO group | ||
| ╬öP | r | 0.064 | 0.143 | ŌĆō0.229 |
| p | 0.767 | 0.760 | 0.376 | |
| n | 34 | 18 | 16 | |
| ╬öTotal protein | r | ŌĆō0.006 | 0.242 | ŌĆō0.107 |
| p | 0.978 | 0.601 | 0.682 | |
| No. | 34 | 18 | 16 | |
| ╬öAlbumin | r | 0.109 | ŌĆō0.424 | ŌĆō0.039 |
| p | 0.613 | 0.343 | 0.883 | |
| No. | 34 | 18 | 16 | |
| ╬öCa | r | 0.074 | ŌĆō0.758* | ŌĆō0.142 |
| p | 0.730 | 0.048* | 0.587 | |
| No. | 34 | 18 | 16 | |
| ╬öCRP | r | ŌĆō0.177 | ŌĆō0.234 | ŌĆō0.208 |
| p | 0.4080 | 0.613 | 0.423 | |
| No. | 34 | 18 | 16 | |
References
-
METRICS

- ORCID iDs
-
Seon-Ho Ahn

https://orcid.org/0000-0002-3482-1056Mi Mi Ko

https://orcid.org/0000-0002-5758-4655Ju Hung Song

https://orcid.org/0000-0002-8149-2195Jong Hwan Jung

https://orcid.org/0000-0002-1252-9679 - Related articles


 PDF Links
 PubReader
 ePub Link
 Full text via DOI
 Download Citation
 Print
Print


