


Introduction
According to the United States Renal Data System (USRDS), chronic kidney disease affects 12% of the general population [1]. The proportion of new end-stage renal disease patients who require renal replacement therapy has reached 357 per million. Peritoneal dialysis (PD) is an established modality among renal replacement therapies. In the United States, 185,000 patients have received PD [1].
Ultrafiltration failure and/or fibrosis of peritoneal membranes are the most significant hurdles to successful long-term PD [2]. Transforming growth factor-beta 1 (TGF-β1)-induced epithelial-to-mesenchymal transition (EMT) plays a key role in peritoneal membrane changes [3]. During EMT, peritoneal mesothelial cells lose their epithelial phenotype and acquire new mesenchymal characteristics. Because EMT is associated with excessive production of fibrous connective tissue, effectively attenuating EMT is important for maintaining PD. Icodextrin and bicarbonate/low-glucose degradation product dialysates have been introduced to overcome EMT; however, their effectiveness in suppressing EMT remains controversial [4–7].
Tranilast is a well-known anti-allergic drug used clinically for bronchial asthma, allergic rhinitis, hypertrophic scarring, and scleroderma [8–10]. Moreover, many studies have demonstrated that tranilast has anti-proliferative, anti-cancer, anti-oxidant, cardiovascular-protective, and immune-modulating effects [11], suggesting that it may be effective for treatment of various pathological conditions. Tranilast has also been demonstrated to suppress TGF-β1-induced EMT in renal tubular epithelial cells and tumor cells [12–14]. Similarly, Saito et al [15] recently reported that tranilast inhibited TGF-β1-induced fibrosis in human peritoneal mesothelial cells (HPMCs). Although these data suggest that tranilast may prevent EMT in peritoneal mesothelial cells, few studies have demonstrated these effects in an animal model [16].
Here, we evaluated the effects of tranilast on the EMT signaling pathway in both HPMCs and an animal model.
Methods
In vitro study
HPMC culture and treatment conditions
HPMCs were isolated as described previously [17]. Tissue collection was approved by the Institutional Review Board of Yeungnam University Medical Center (approval number: 2019-04-047). Informed consent was obtained from each participant. In vitro experiments were performed on cells after 1 to 2 passages. HPMCs were incubated with serum-free M199 medium for 1 day. Subsequently, the medium was substituted with M199 medium supplemented with 20% fetal bovine serum containing TGF-β1 (2.0 ng/mL, #240-B; R&D Systems, Minneapolis, MN, USA) with or without tranilast (100 μM; JW Pharm., Co., Seoul, Korea) for 1 or 7 days. In preliminary experiments, tranilast exhibited its maximum effect on TGF-β1-induced EMT at a concentration of 100 μM (Supplementary Fig. 1; available online).
Cytotoxicity assay
The cytotoxicity of tranilast was evaluated with the Cell Counting Kit-8 (CCK-8) (Abcam, Cambridge, MA, USA). HPMCs (10,000 cells) were grown in a 96-well plate for 24 hours and then were treated with tranilast (0, 25, 50, 100, 200, or 400 μM) for another 24 hours. The CCK-8 solution was added to each well, and optical density at 450 nm (OD450) was measured between 1 and 4 hours. The results of the cytotoxicity assay are shown in Supplementary Fig. 2.
Cell morphology and Western blotting
Cell morphology was analyzed with a phase-contrast microscope (Nikon DIAPHOT 300; Nikon, Tokyo, Japan), and images were captured with a digital camera (AxioCam HRC; Carl Zeiss, Göttingen, Germany).
Immunoblotting was performed as described previously [17]. Briefly, HPMCs were washed with cold phosphate-buffered saline, exposed to trypsin, and pelleted by centrifugation at 700g at 4°C. The pellets were resuspended in lysis buffer. The preparation was then clarified by centrifugation, and the supernatant was saved as the whole-cell lysate. The protein samples were mixed in sodium dodecyl sulfate (SDS) reducing buffer, boiled, electrophoresed through a 10% reducing SDS-polyacrylamide gel, and electroblotted in 20% methanol, 25 mM Tris, and 192 mM glycine onto a nitrocellulose membrane. The membranes were blocked in 5% (w/v) nonfat milk powder in Tris-buffered saline for 1 hour at room temperature.
The blots were incubated overnight with primary antibody at 4°C. The primary antibodies were β-actin (1:2,000 dilution, A1978; Sigma-Aldrich, St. Louis, MO, USA), mouse monoclonal anti-α-smooth muscle actin (α-SMA, 1:1,000 dilution, A5228; Sigma-Aldrich), mouse monoclonal anti-E-cadherin (1:1,000 dilution, 610181; BD Biosciences, Lexington, KY, USA), and the following antibodies from Cell Signaling Technology (Danvers, MA, USA), all at 1:1,000 dilution: rabbit monoclonal anti-glyceraldehyde 3-phosphate dehydrogenase (GAPDH, #2118), mouse monoclonal anti-Snail (#3895), rabbit monoclonal anti-phosphorylated-Smad2 (p-Smad2, #3108), mouse monoclonal anti-Smad2 (#3103), rabbit monoclonal anti-phosphorylated-Smad3 (p-Smad3, #8769), rabbit polyclonal anti-Smad3 (#9513), rabbit polyclonal anti-Smad4 (#9515), rabbit polyclonal anti-Smad6 (#9519), rabbit monoclonal anti-β-catenin (#9582), rabbit monoclonal anti-phosphorylated-Akt (p-Akt, #4060), and rabbit monoclonal anti-Akt (#4685). The secondary antibodies (goat anti-rabbit immunoglobulin (Ig) G-horseradish-peroxidase [A16096, Invitrogen; Thermo Fisher Scientific Inc., Waltham, MA, USA] and goat anti-mouse IgG-horseradish-peroxidase [sc-516102; Santa Cruz Biotechnology, Santa Cruz, CA, USA], both at 1:2,000 dilution) to each primary antibody were used, and an enhanced chemiluminescence system (Thermo Fisher Scientific Inc.) was used to detect the immunoreactive bands.
In vivo study
Animal experiments
Thirty-two male Sprague Dawley rats (200–250 g) were obtained from Orient Corporation (Seoul, Korea). All animal procedures were approved by the Institutional Review Board of Yeungnam University College of Medicine (approval number: YUMC-AEC2013-027) and were in accordance with the Guide for the Care and Use of Laboratory Animals. Peritoneal catheters were inserted as previously described [18]. Rats were divided into three treatment groups: 1) the control (C) group (n = 8), which underwent catheter implantation without infusions; 2) the PD group (n = 12), which received infusions with a 4.25% glucose-containing dialysate (Dianeal®; Baxter Healthcare, Woodlands, Singapore); and 3) the PD + tranilast group (n = 12), which received infusions with a 4.25% glucose-containing dialysate and cotreatment with tranilast. For 6 weeks, rats in the PD group and the PD + tranilast group received a total of 25 mL of 4.25% glucose-containing dialysate (twice daily). The infusions contained cefazolin (1 g/L) and amikacin (100 mg/L) as antibiotics. The tranilast-treated rats were fed a chow diet containing tranilast at a concentration of 0.8% (w/w).
Peritoneal membrane function test
Peritoneal membrane function was evaluated by a 4-hour peritoneal equilibrium test (PET) with 4.25% glucose-containing dialysate at 0 day and 6 week. After 4 hours, a sample of peritoneal dialysate was obtained by aspiration, and a sample of blood was obtained by heart puncture. The glucose mass transfer from the peritoneal cavity to the blood was assessed as reported previously [16].
Morphometric and immunohistochemical analyses of the peritoneum
At the end of 6 week, the rats were killed, and the parietal peritoneum of the abdominal wall was sampled for morphometric and histological analyses. The parietal peritoneum was assessed by hematoxylin and eosin (H&E) staining as previously described [17]. Fibrosis was visualized with Masson’s trichrome stain. Immunohistochemical staining experiments for α-SMA, fibronectin, and TGF-β1 were performed with rabbit polyclonal anti-α-SMA (ab5694; Abcam), rabbit monoclonal anti-fibronectin (ab199056; Abcam), and rabbit monoclonal anti-TGF-β1 [EPR21143] (ab215715; Abcam) primary antibodies, respectively.
Statistical analysis
Two rats in the C group that died during baseline PET were excluded from the analysis. IBM SPSS Statistics ver. 19.0 was used to analyze the data (IBM Corp., Armonk, NY, USA). Data are expressed as the mean and standard error of the mean. Groups were compared by the Kruskal–Wallis or Mann–Whitney rank-sum test. Differences between the two time points (initiation and six weeks) were compared by the Wilcoxon singed-rank test. A P value < 0.05 was considered significant.
Results
Tranilast attenuates TGF-β1-induced EMT in vitro
We evaluated the effects of tranilast on TGF-β1-induced EMT in vitro. As shown in Fig. 1, exposure of HPMCs to TGF-β1 downregulated the epithelial cell marker E-cadherin but upregulated the mesenchymal marker α-SMA and the EMT-inducing transcription factor Snail. Tranilast cotreatment significantly reversed each of these TGF-β1-induced changes.
Tranilast attenuates TGF-β1-induced morphological changes and signaling
The morphological changes in HPMCs from day 1 to 7 are shown in Fig. 2. TGF-β1 triggered cell contact losses and fibroblastoid morphological changes. These morphological changes were evident after 2 days, with greater deterioration during the subsequent days. On day 2, tranilast was administered at a dose of 1 to 100 μM, which attenuated the morphologic changes. A high dose of tranilast exhibited a sustained protective effect from day 2 to 7.
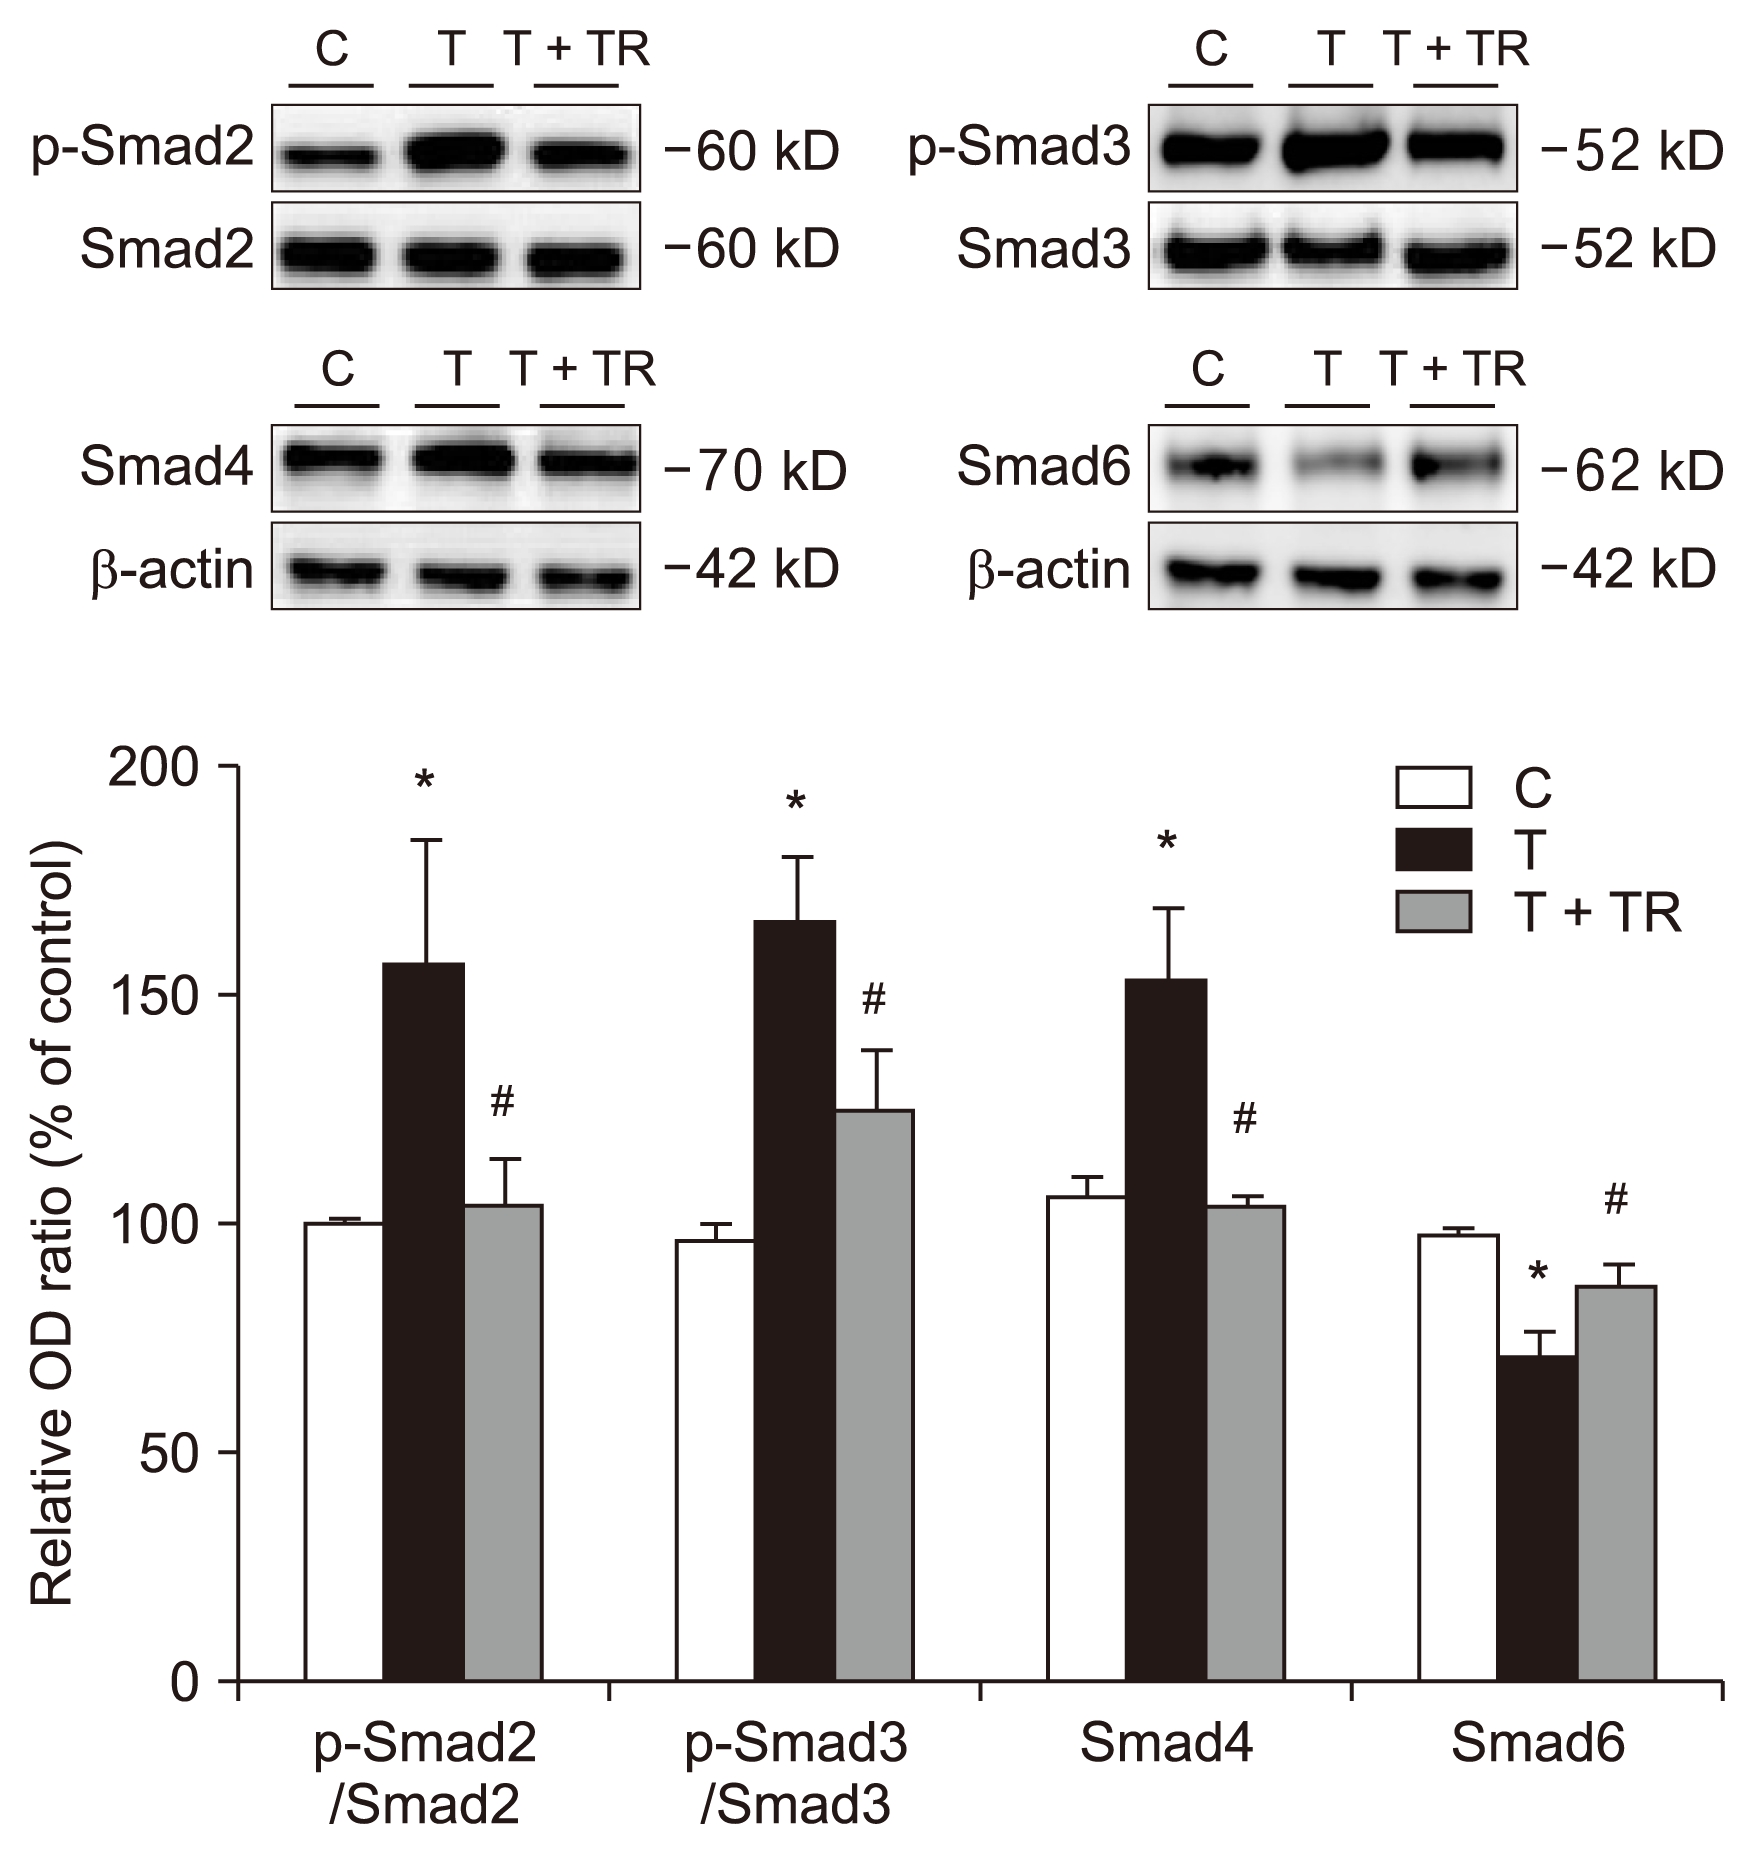
Tranilast attenuates TGF-β1-induced Smad, Akt, and β-catenin signaling
Treatment of HPMCs with TGF-β1 (24 hours) significantly increased the phosphorylation of Smad2 and Smad3 (Fig. 3). However, after cotreatment with tranilast, a significant decrease in TGF-β1-induced Smad2 and Smad3 phosphorylation was observed. Smad4 expression increased and Smad6 expression decreased in cells treated with TGF-β1, but tranilast reversed these effects.
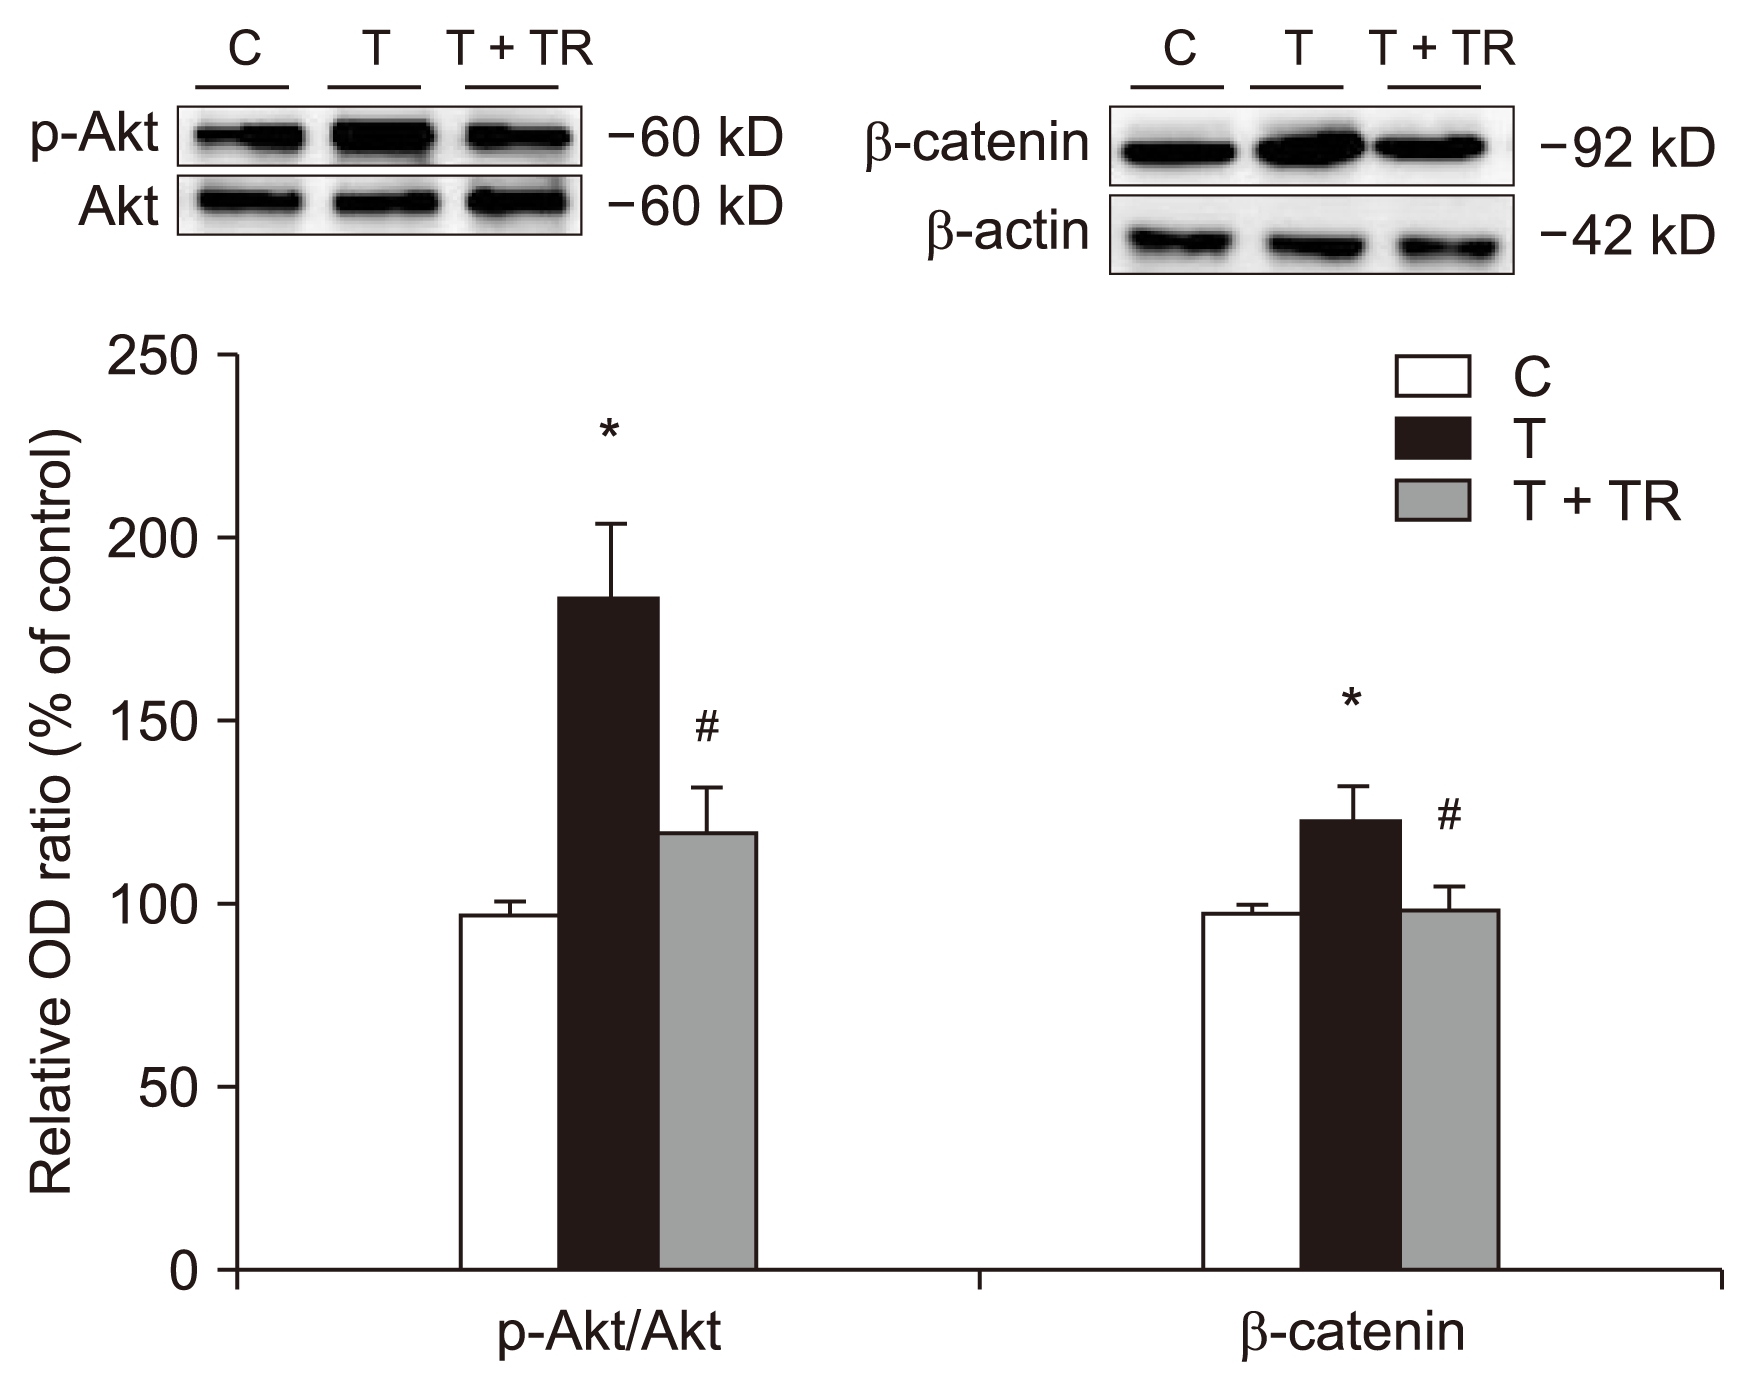
Fig. 4 shows a significant increase in phosphorylation of Akt in the presence of TGF-β1. TGF-β1 also increased the expression of β-catenin, an EMT-promoting transcriptional factor. Tranilast reduced these changes.
Tranilast protects against PD-induced glucose mass transfer change in vivo model
The body weights of the animals increased during the study; however, no significant differences were detected among the three groups (Table 1). There was no significant difference among the groups in glucose mass transfer at initiation of PD (day 0). However, after 6 weeks, the glucose mass transfer level was significantly higher than the baseline value (0 day) in the PD group but not in the C or PD + tranilast group (Table 1). These results revealed that tranilast attenuated EMT-related changes not only at the molecular level, but also at the functional level.
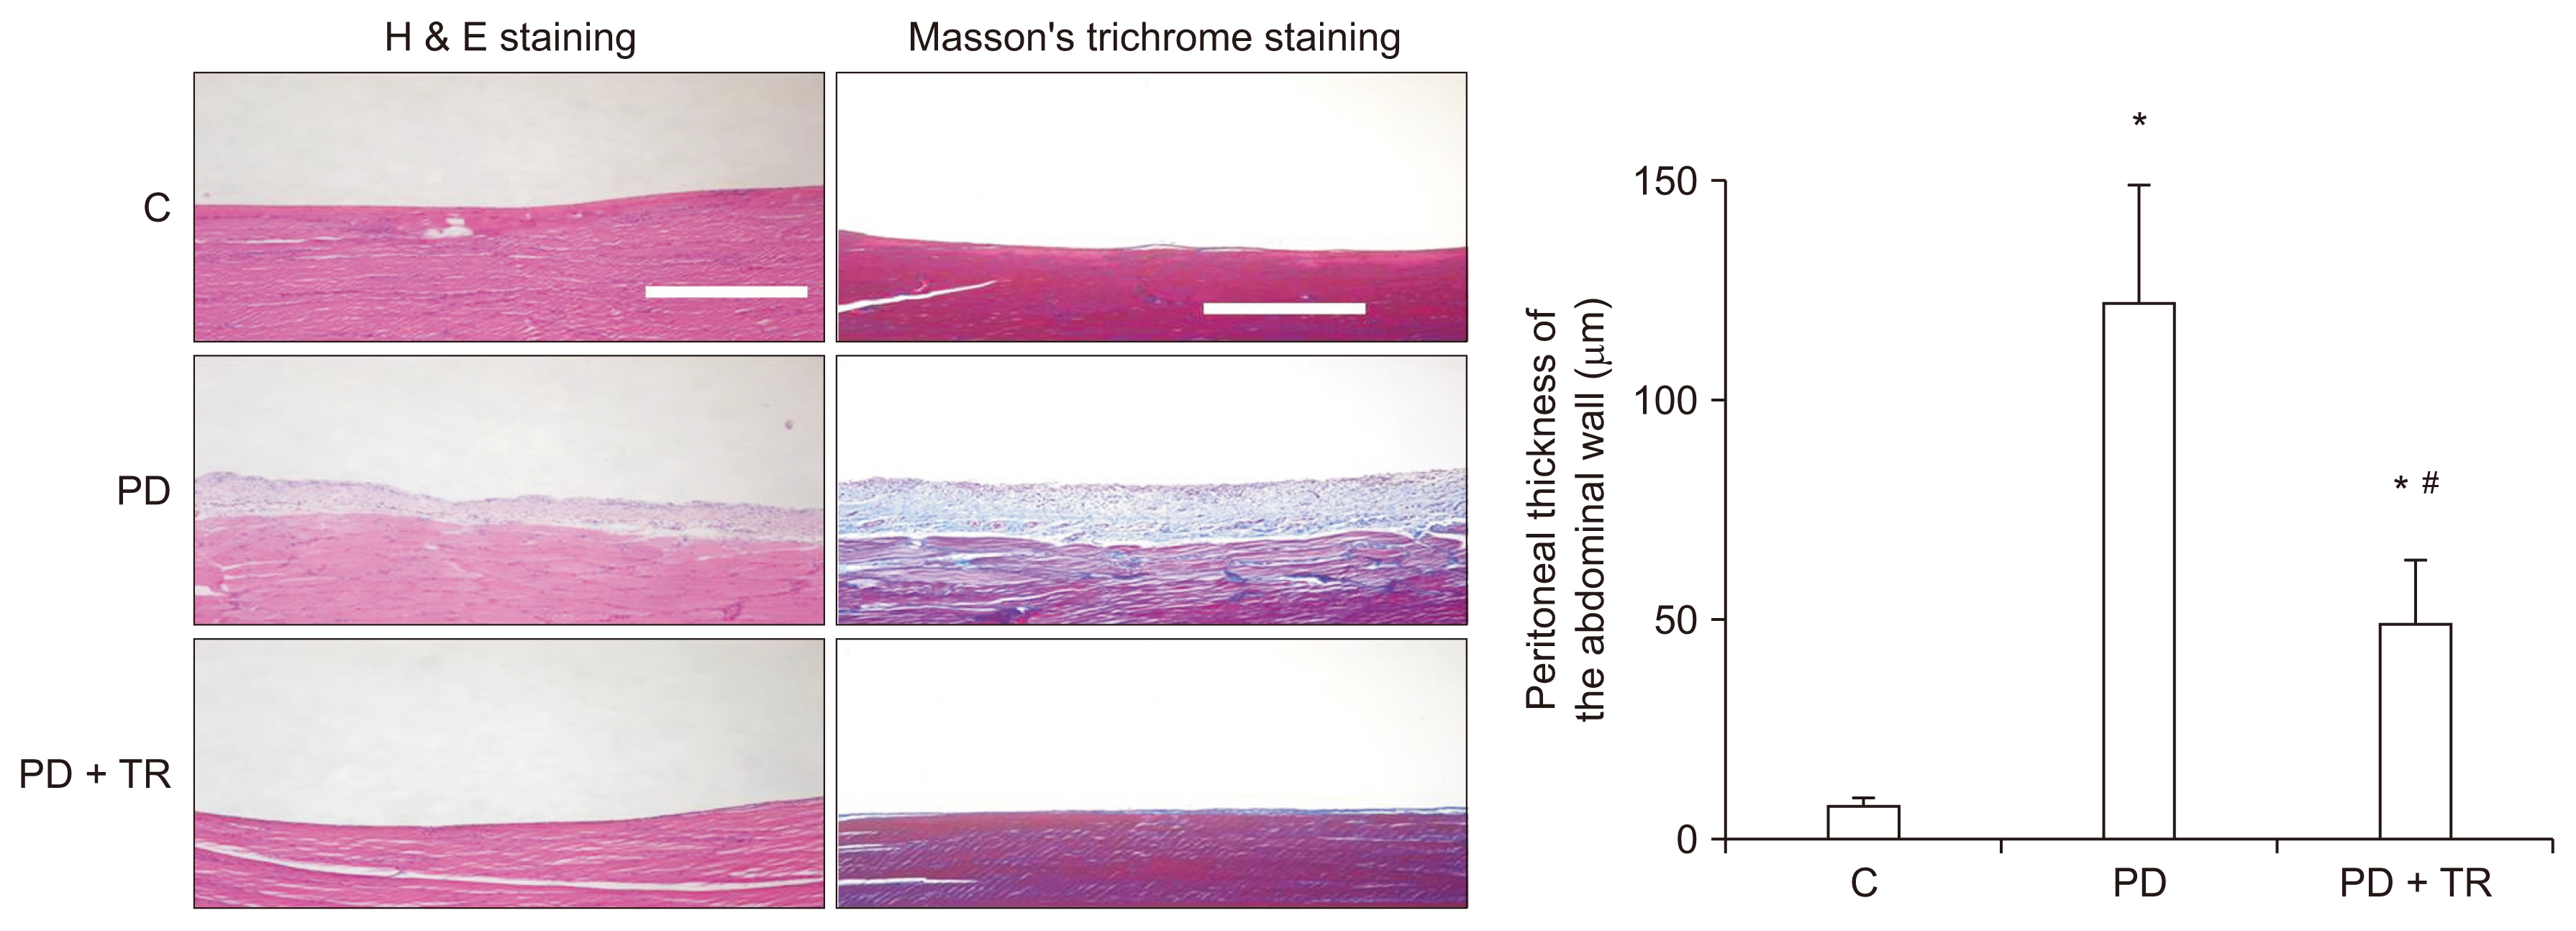
Tranilast attenuates PD-induced histopathological changes in vivo
After 6 weeks of experimental PD, the peritoneal membrane was significantly thicker in the PD group than in the C group, but this change was prevented by tranilast. In addition, deposition of collagen was greater in the PD group than in the C group, but cotreatment with tranilast suppressed this effect (Fig. 5).
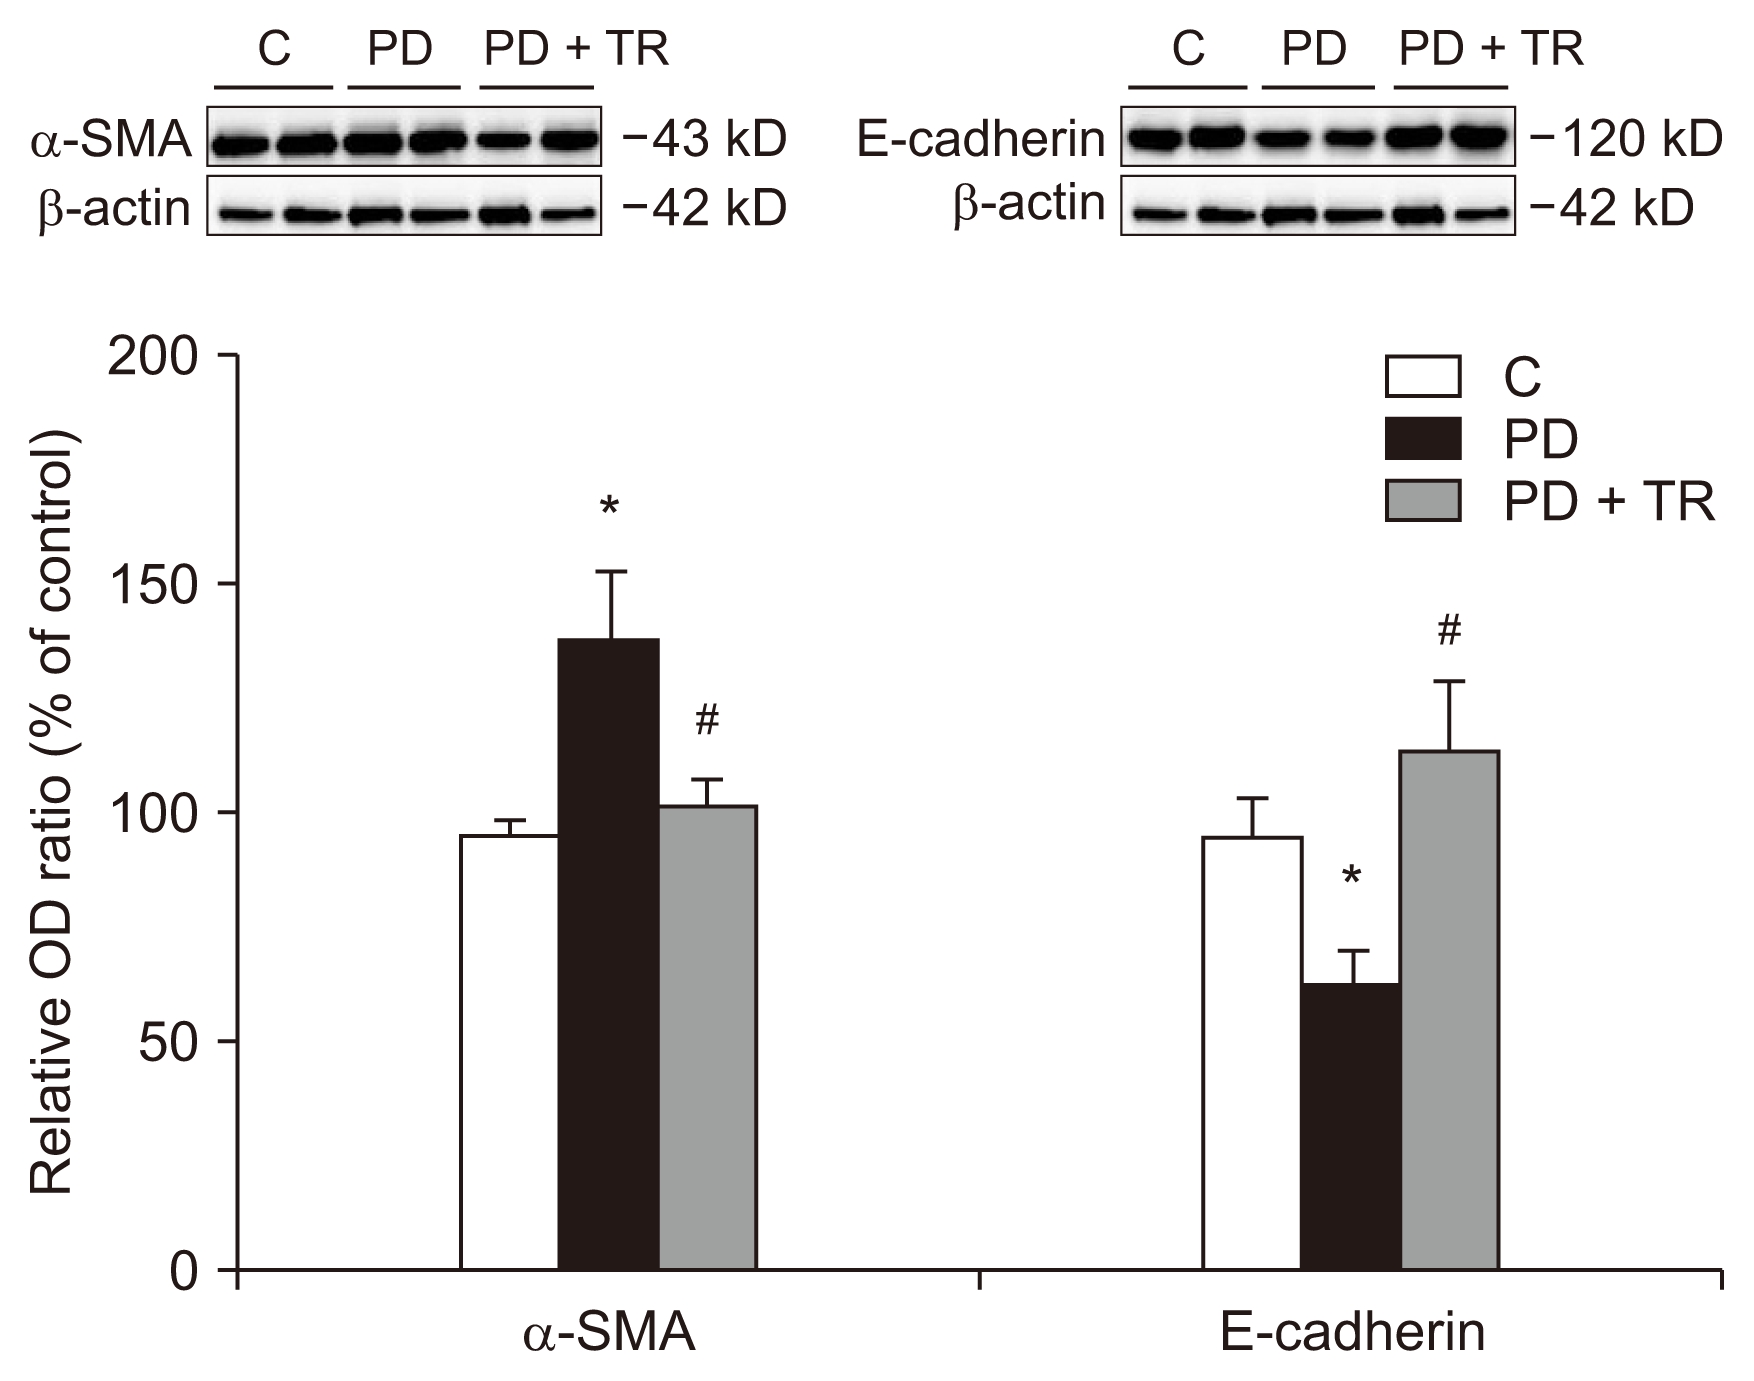
We also monitored the protein levels of the epithelial cell marker E-cadherin and the mesenchymal marker α-SMA in the peritoneal membrane (Fig. 6). Similar to the in vitro results, E-cadherin expression was lower and α-SMA expression was higher in the PD group than in the C group. Tranilast was able to reverse these changes.
To investigate the fibrotic response in the peritoneum after PD, we used immunohistochemistry to evaluate the expression of α-SMA, fibronectin, and TGF-β1 in parietal peritoneal tissues. The protein levels of α-SMA and fibronectin (fibrotic components) and TGF-β1 (a key signal of EMT and fibrosis) were greater in the PD group than in the C group. Treatment with tranilast reduced the changes in these markers. These findings extended the in vitro results by revealing that tranilast could also attenuate the TGF-β1 signaling pathway when it was induced by PD in vivo (Supplementary Fig. 3).
Discussion
Our results indicated that tranilast inhibits signaling pathways involving Smad and Akt/β-catenin, thereby suppressing the EMT in peritoneal mesothelial cells. In vivo, tranilast reduced the thickness of the peritoneal membrane and the expression of mesenchymal markers but increased the expression of an epithelial cell marker.
Glucose degradation products and/or advanced glycation end-products in dialysates can upregulate TGF-β1, which then induces EMT in peritoneal mesothelial cells [5,19]. TGF-β1 phosphorylates Smad2 and Smad3, which then bind separately to Smad4 to form a Smad complex [20]. This complex translocates to the nucleus, where it produces factors associated with EMT and regulates Smad6, an inhibitory Smad.
Tranilast was initially used to treat allergies and fibrotic disorders such as scleroderma and hypertrophic scarring [8–10]. Kaneko et al [16] reported that tranilast inhibited high-glucose-induced TGF-β1 mRNA production both in vitro and in vivo. Tranilast treatment also reduced the levels of fibrogenic factors in samples from three patients. However, these preliminary results did not include an examination of the affected signaling pathways. We demonstrated that tranilast suppressed the phosphorylation of Smad2 and Smad3, reduced Smad4 expression, and increased Smad6 expression. These data indicate that tranilast inhibits the TGF-β1-Smad pathway and attenuates EMT in peritoneal mesothelial cells. In addition, tranilast attenuated TGF-β1-induced morphologic changes, including loss of cell contacts. These effects were also demonstrated in vivo. PD significantly increased the thickness of the parietal peritoneum and deposition of collagen, but tranilast reduced these changes.
In addition to the Smad-dependent signaling pathway, other signaling cascades are activated by TGF-β1, including MAPK, Rho-like GTPase, and PI3K/Akt pathways [21,22]. TGF-β1 activates PI3K, which induces phosphorylation of Akt. Activated Akt increases the expression of β-catenin and Snail, which promotes the EMT phenotype [23]. In our study, tranilast inhibited not only the TGF-β1-induced Smad-dependent pathway, but also the PI3K/Akt pathway.
There have been many developments in interventions for peritoneal fibrosis and studies of associated mechanisms. Although TGF-β1 and/or the renin-angiotensin system are the classical mediators of peritoneal fibrosis, recent reports have revealed the significance of other signaling pathways in peritoneal fibrosis [24–28]. Ji et al [25] investigated the role of β-catenin, a cytoskeletal protein, in high-glucose dialysate-induced EMT pathology. They found that inhibiting β-catenin reversed the expression of high-glucose-induced EMT markers. In another study, high-glucose dialysate was reported to induce phosphorylation of glycogen synthase kinase (GSK)-3β and thus inhibit degradation of β-catenin [26]. Ultimately, this β-catenin signaling was implicated in EMT. Yan et al [26] investigated the association between high-glucose dialysate treatment and GSK-3β phosphorylation and demonstrated that tamoxifen downregulated the GSK-3β/β-catenin axis. Kazama et al [27] focused on the function of mast cells in progression of peritoneal fibrosis. They found that chronic kidney disease increased the number of mast cells in the peritoneum of rats, and that tranilast, a mast cell stabilizer, suppressed the progression of peritoneal fibrosis [27].
Recent studies have revealed the significance of microRNA-29 in the pathophysiology of fibrosis [28]. An inverse relationship between microRNA-29 and TGF-β1 expression has been demonstrated in a unilateral ureteral obstruction model and other cell types [28,29]. Although there are no data regarding the association between microRNA-29 and tranilast in HPMCs, Chuang and Khorram [30] reported that tranilast induced the expression of microRNA-29, which attenuated fibrotic marker levels in leiomyoma smooth muscle cells. These data reveal that tranilast is a therapeutic option for peritoneal fibrosis through various signaling pathways.
Our PET results demonstrated that 6 weeks of PD significantly increased glucose mass transfer. However, there was no significant difference in glucose mass transfer after 6 weeks in the group treated with tranilast. Thus, in addition to altering the molecular and morphologic responses to TGF-β1, tranilast also prevented the functional changes induced by PD.
In conclusion, this study demonstrated that tranilast can prevent EMT in rats with PD-induced peritoneal fibrosis, as well as in HPMCs treated with TGF-β1. The mechanism of action of tranilast involved regulating TGF-β1 signaling pathways. Thus, tranilast may be a therapeutic intervention to enable long-term PD.


 PDF Links
 PubReader
 Full text via DOI
 Download Citation
 Supplement 1
 Print
Print


")


