Approximation of bicarbonate concentration using serum total carbon dioxide concentration in patients with non-dialysis chronic kidney disease
Article information
Abstract
Background
We investigated the relationship between serum total carbon dioxide (CO2) and bicarbonate ion (HCO3−) concentrations in pre-dialysis chronic kidney disease (CKD) patients and devised a formula for predicting low bicarbonate (HCO3−< 24 mmol/L) and high bicarbonate (HCO3− ≥ 24 mmol/L) using clinical parameters.
Methods
In total, 305 samples of venous blood collected from 207 pre-dialysis patients assessed by CKD stage (G1 + G2, 46; G3, 50; G4, 51; G5, 60) were investigated. The relationship between serum total CO2 and HCO3− concentrations was analyzed using Pearson’s correlation coefficient. An approximation formula was developed using clinical parameters correlated independently with HCO3− concentration. Diagnostic accuracy of serum total CO2 and the approximation formula was evaluated by receiver operating characteristic curve analysis and a 2 × 2 table.
Results
Serum total CO2 correlated strongly with HCO3− concentration (r = 0.91; P < 0.001). The following approximation formula was obtained by a multiple linear regression analysis: HCO3− (mmol/L) = total CO2 − 0.5 × albumin − 0.1 × chloride − 0.01 × (estimated glomerular filtration rate + blood glucose) + 15. The areas under the curves of serum total CO2 and the approximation formula for detection of low bicarbonate and high bicarbonate were 0.981, 0.996, 0.993, and 1.000, respectively. This formula had superior diagnostic accuracy compared with that of serum total CO2 (86.6% vs. 81.3%).
Conclusion
Serum total CO2 correlated strongly with HCO3− concentration in pre-dialysis CKD patients. An approximation formula including serum total CO2 showed superior diagnostic accuracy for low and high bicarbonate compared with serum total CO2.
Introduction
Metabolic acidosis is a common complication of chronic kidney disease (CKD) and can lead to bone mineral loss, protein wasting, progression of renal dysfunction, and higher mortality risk [1–3]. Therefore, early detection and accurate diagnosis of metabolic acidosis are important to prevent CKD progression and increased risk of mortality.
In Japan, blood-gas analyzers are available in most hospitals. Therefore, clinical practice guidelines for CKD recommend measurement of bicarbonate ions (HCO3−) using samples of arterial/venous blood gases for assessment of metabolic acidosis in pre-dialysis CKD patients [4]. However, for these blood-gas analyses, a specific measurement device and syringe are required in addition to the blood samples used for biochemical analyses [5].
Serum total carbon-dioxide concentration (serum total CO2) can be measured readily, along with creatinine, urea, and electrolytes, using a biochemical analyzer in clinical settings [6]. Furthermore, values based on this measurement have been shown to be correlated strongly with HCO3− concentration in patients without renal impairment [7]. However, few studies have examined the relationship between serum total CO2 and HCO3− concentration in patients with renal impairment. Therefore, we analyzed the relationship between these two parameters in CKD patients who were not undergoing renal replacement therapy. Furthermore, we developed a new formula for approximation of HCO3− concentration using clinical parameters that included serum total CO2 and evaluated the diagnostic accuracy of the approximated values derived from this new formula.
Methods
Ethical approval of the study protocol
This study was carried out in accordance with the ethical principles contained within the Declaration of Helsinki. The study protocol was approved by the Ethics Committee of Saitama Medical Center, Jichi Medical University (No. S17-052; Saitama, Japan). The requirement of informed consent was waived, and an opt-out method was used due to the retrospective design of the study.
Inclusion and exclusion criteria
Inclusion criteria were (i) age > 20 years; (ii) stable outpatient with CKD stage G1 to 5; and (iii) simultaneous measurement of serum total CO2 and HCO3− concentration. Exclusion criteria were patients (i) undergoing dialysis therapy and (ii) who had undergone renal transplantation.
Study design
This was a single-center, retrospective, cross-sectional study. We analyzed patient data obtained from medical records from the Division of Nephrology, Saitama Medical Center, between April 2016 and March 2018. Laboratory data of blood tests and blood-gas tests obtained simultaneously were used for analyses.
The relationship between serum total CO2 and HCO3− concentration was analyzed using Pearson’s correlation coefficient. An approximation formula was developed by multiple linear regression analysis with independent factors correlated with HCO3− concentration. The relationship between HCO3− concentration approximated by our formula and actual HCO3− concentration was analyzed using Pearson’s correlation coefficient. The diagnostic accuracy of serum total CO2 and approximated HCO3− concentration for low and high bicarbonate levels was analyzed using receiver operating characteristic (ROC) curve analysis and a 2 × 2 table.
Laboratory methods
Blood and urinary parameters were determined by the Department of Clinical Laboratory, Saitama Medical Center. Samples of venous blood were collected in ethylenediamine tetraacetic acid (EDTA)-containing tubes from the brachial vein and centrifuged within 15 minutes to obtain serum. Serum total CO2 was measured within 15 minutes after centrifugation using an automated biochemical analyzer (JCA-BM6070; JEOL, Tokyo, Japan), as were the biochemical parameters hemoglobin, total protein, serum albumin, blood urea nitrogen, serum creatinine, sodium, potassium, chloride, calcium, phosphate, magnesium, and glucose. Serum total CO2 was determined by an enzymatic method using a commercial kit (Toyobo, Osaka, Japan).
Samples of venous blood for gas analyses were collected in a heparinized blood-gas syringe from the brachial vein simultaneously with samples for other blood tests. These samples were analyzed within 10 minutes to obtain values for pH and partial pressure of carbon dioxide (pCO2). Blood pH and pCO2 were measured using a blood-gas analyzer (Rapidlab-1265; Siemens Healthcare Diagnostics, Tarrytown, NY, USA). The HCO3− concentration was calculated from measured pH and pCO2 using the Henderson–Hasselbalch equation [8]:
The estimated glomerular filtration rate (eGFR) was calculated using a modified version of the Modification of Diet in Renal Disease formula set by the Japanese Society of Nephrology [9]:
Statistical analyses
Statistical analyses were performed using JMP v11 (SAS Institute, Cary, NC, USA). Data are the mean ± standard deviation for continuous variables and are count and percentage for categorical variables. Comparisons of component ratios among groups were performed using Fisher’s exact test with the Bonferroni correction. Comparisons of clinical parameters among groups were performed using the Kruskal–Wallis test with the Steel–Dwass test. Correlations between two variables were evaluated by Pearson’s correlation coefficient. Linear regression analysis was used to detect factors independently correlated with HCO3− concentration. Parameters that significantly correlated with HCO3− concentration in a simple linear regression analysis were included in a multiple linear regression analysis. An approximation formula involving serum total CO2 was determined using variables that independently correlated with HCO3− concentration in the multiple linear regression analysis. The diagnostic accuracy of serum total CO2 and approximated HCO3− concentration was examined using ROC curve analysis and a 2 × 2 table. The area under the curve (AUC), sensitivity, specificity, positive predictive value, negative predictive value, and accuracy were calculated for detection of low bicarbonate (HCO3− < 24 mmol/L) and high bicarbonate (HCO3− ≥ 24 mmol/L). For all tests, P < 0.05 was considered significant.
Results
Patient characteristics
The characteristics of patients and their medications were categorized by CKD stage (G1 + G2, G3, G4, G5) (Table 1). A total of 305 blood samples from 207 patients (139 males, 68 females; mean age, 64.7 ± 16.1 years) was obtained. The number of patients for each CKD stage was 46 for G1 + G2, 50 for G3, 51 for G4, and 60 for G5.

Comparison of patient characteristics and medications according to chronic kidney disease (CKD) stage
There were significant differences in age as well as use of corticosteroid, β-blocker, loop diuretic, sodium bicarbonate, potassium binder, phosphate binder, or inhibitor of the renin–angiotensin system (RAS) among groups categorized by CKD stage. Age was significantly lower in patients with CKD stage G1 + G2 than those with CKD stage G3, G4, or G5 (P < 0.001 for all).
The proportions of patients using a β-blocker (P < 0.005, G1 + G2 vs. G4 and G5), RAS inhibitor (P < 0.05, G1 + G2 vs. G4 and G5), loop diuretic (P < 0.001, G1 + G2 vs. G3, G4, and G5), thiazide diuretic (P < 0.005, G3 vs. G5), sodium bicarbonate (P < 0.05, G5 vs. G1 + G2 and G3), potassium binder (P < 0.01, G1 + G2 vs. G5), or phosphate binder (P < 0.05, G5 vs. G1 + G2 and G3) increased significantly with CKD stage. The percentage of patients using a corticosteroid decreased with CKD stage (P < 0.05, G1 + G2 vs. G5).
Correlation between serum total CO2 and HCO3− concentration
Fig. 1 shows the correlation between serum total CO2 and HCO3− concentration in each group categorized by CKD stage. Serum total CO2 was correlated with HCO3− concentration significantly and substantially in all patients (r = 0.91; P < 0.001), patients with CKD stage G1 + G2 (r = 0.88; P < 0.001), patients with CKD stage G3 (r = 0.84; P < 0.001), patients with CKD stage G4 (r = 0.89; P < 0.001), and patients with CKD stage G5 (r = 0.93; P < 0.001).
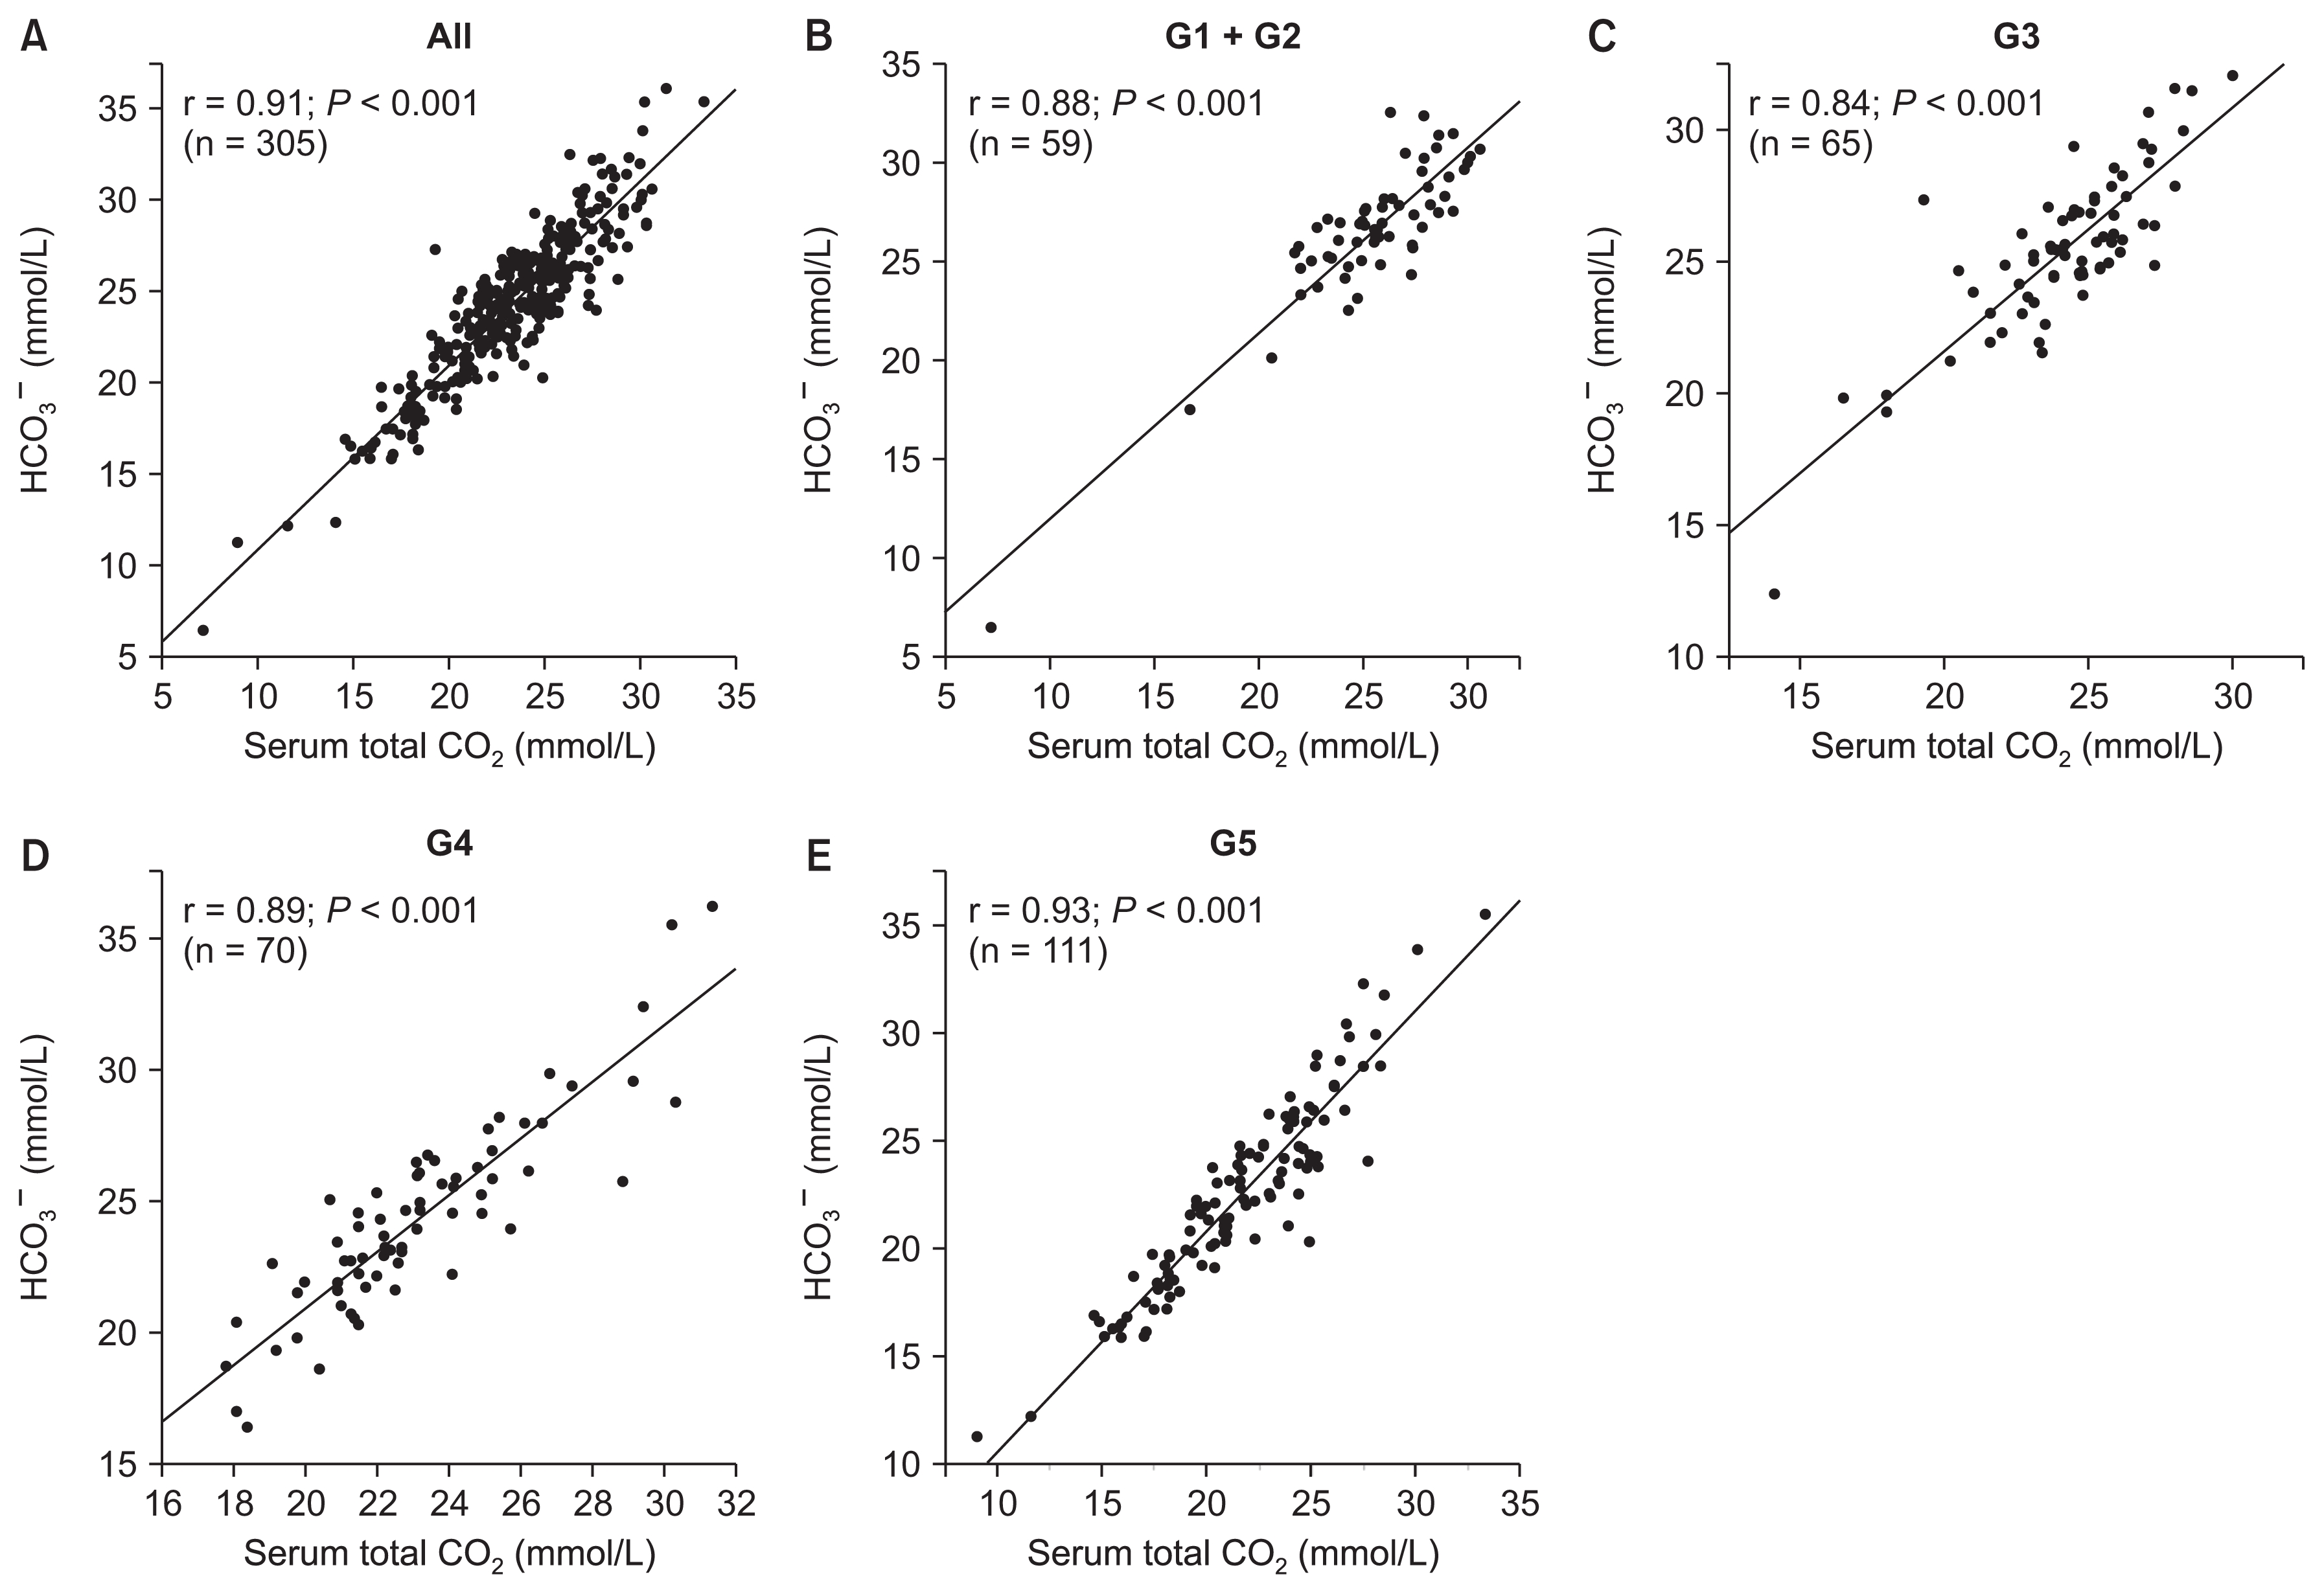
Relationships between serum total carbon dioxide (CO2) and measured bicarbonate ion (HCO3−) concentration according to chronic kidney disease (CKD) stage.
(A) All patients, (B) patients with CKD stage G1 + G2, (C) patients with CKD stage G3, (D) patients with CKD stage G4, (E) patients with CKD stage G5.
Formula for approximation of HCO3− concentration
A simple linear regression analysis showed that HCO3− concentration was significantly negatively correlated with age, blood urea nitrogen, potassium, chloride, phosphate, blood glucose, and use of an RAS inhibitor, sodium bicarbonate, potassium binder, or phosphate binder. The HCO3− concentration showed significant positive correlations with serum albumin, hemoglobin, eGFR, total calcium, serum total CO2, and use of a corticosteroid or aldosterone receptor antagonist. We performed a multivariate linear regression analysis using variables that showed a significant correlation with HCO3− concentration in the simple linear regression analysis (Table 2). The multiple linear regression analysis revealed that serum albumin (P = 0.006), eGFR (P = 0.047), chloride (P < 0.001), blood glucose (P = 0.004), and serum total CO2 (P < 0.001) were independently correlated with HCO3− concentration.

Simple and multiple linear regression analyses of the variables correlated with HCO3− concentration
An approximated HCO3− formula based on serum total CO2 was developed using variables that showed a significant correlation with HCO3− concentration in the multiple linear regression analysis:
Inputting the mean values of serum albumin, eGFR, chloride, blood glucose, and serum total CO2 into the model, the formula was simplified into a final version [10]:
Correlation between approximated HCO3− and measured HCO3− concentrations
Fig. 2 shows the correlation between approximated HCO3− concentration calculated by our formula and measured HCO3− concentration in each group categorized by CKD stage. The approximated HCO3− concentration was significantly correlated with the measured HCO3− concentration in all patients (r = 0.92; P < 0.001), patients with CKD stage G1 + G2 (r = 0.90; P < 0.001), patients with CKD stage G3 (r = 0.83; P < 0.001), patients with CKD stage G4 (r = 0.91; P < 0.001), and patients with CKD stage G5 (r = 0.94; P < 0.001).
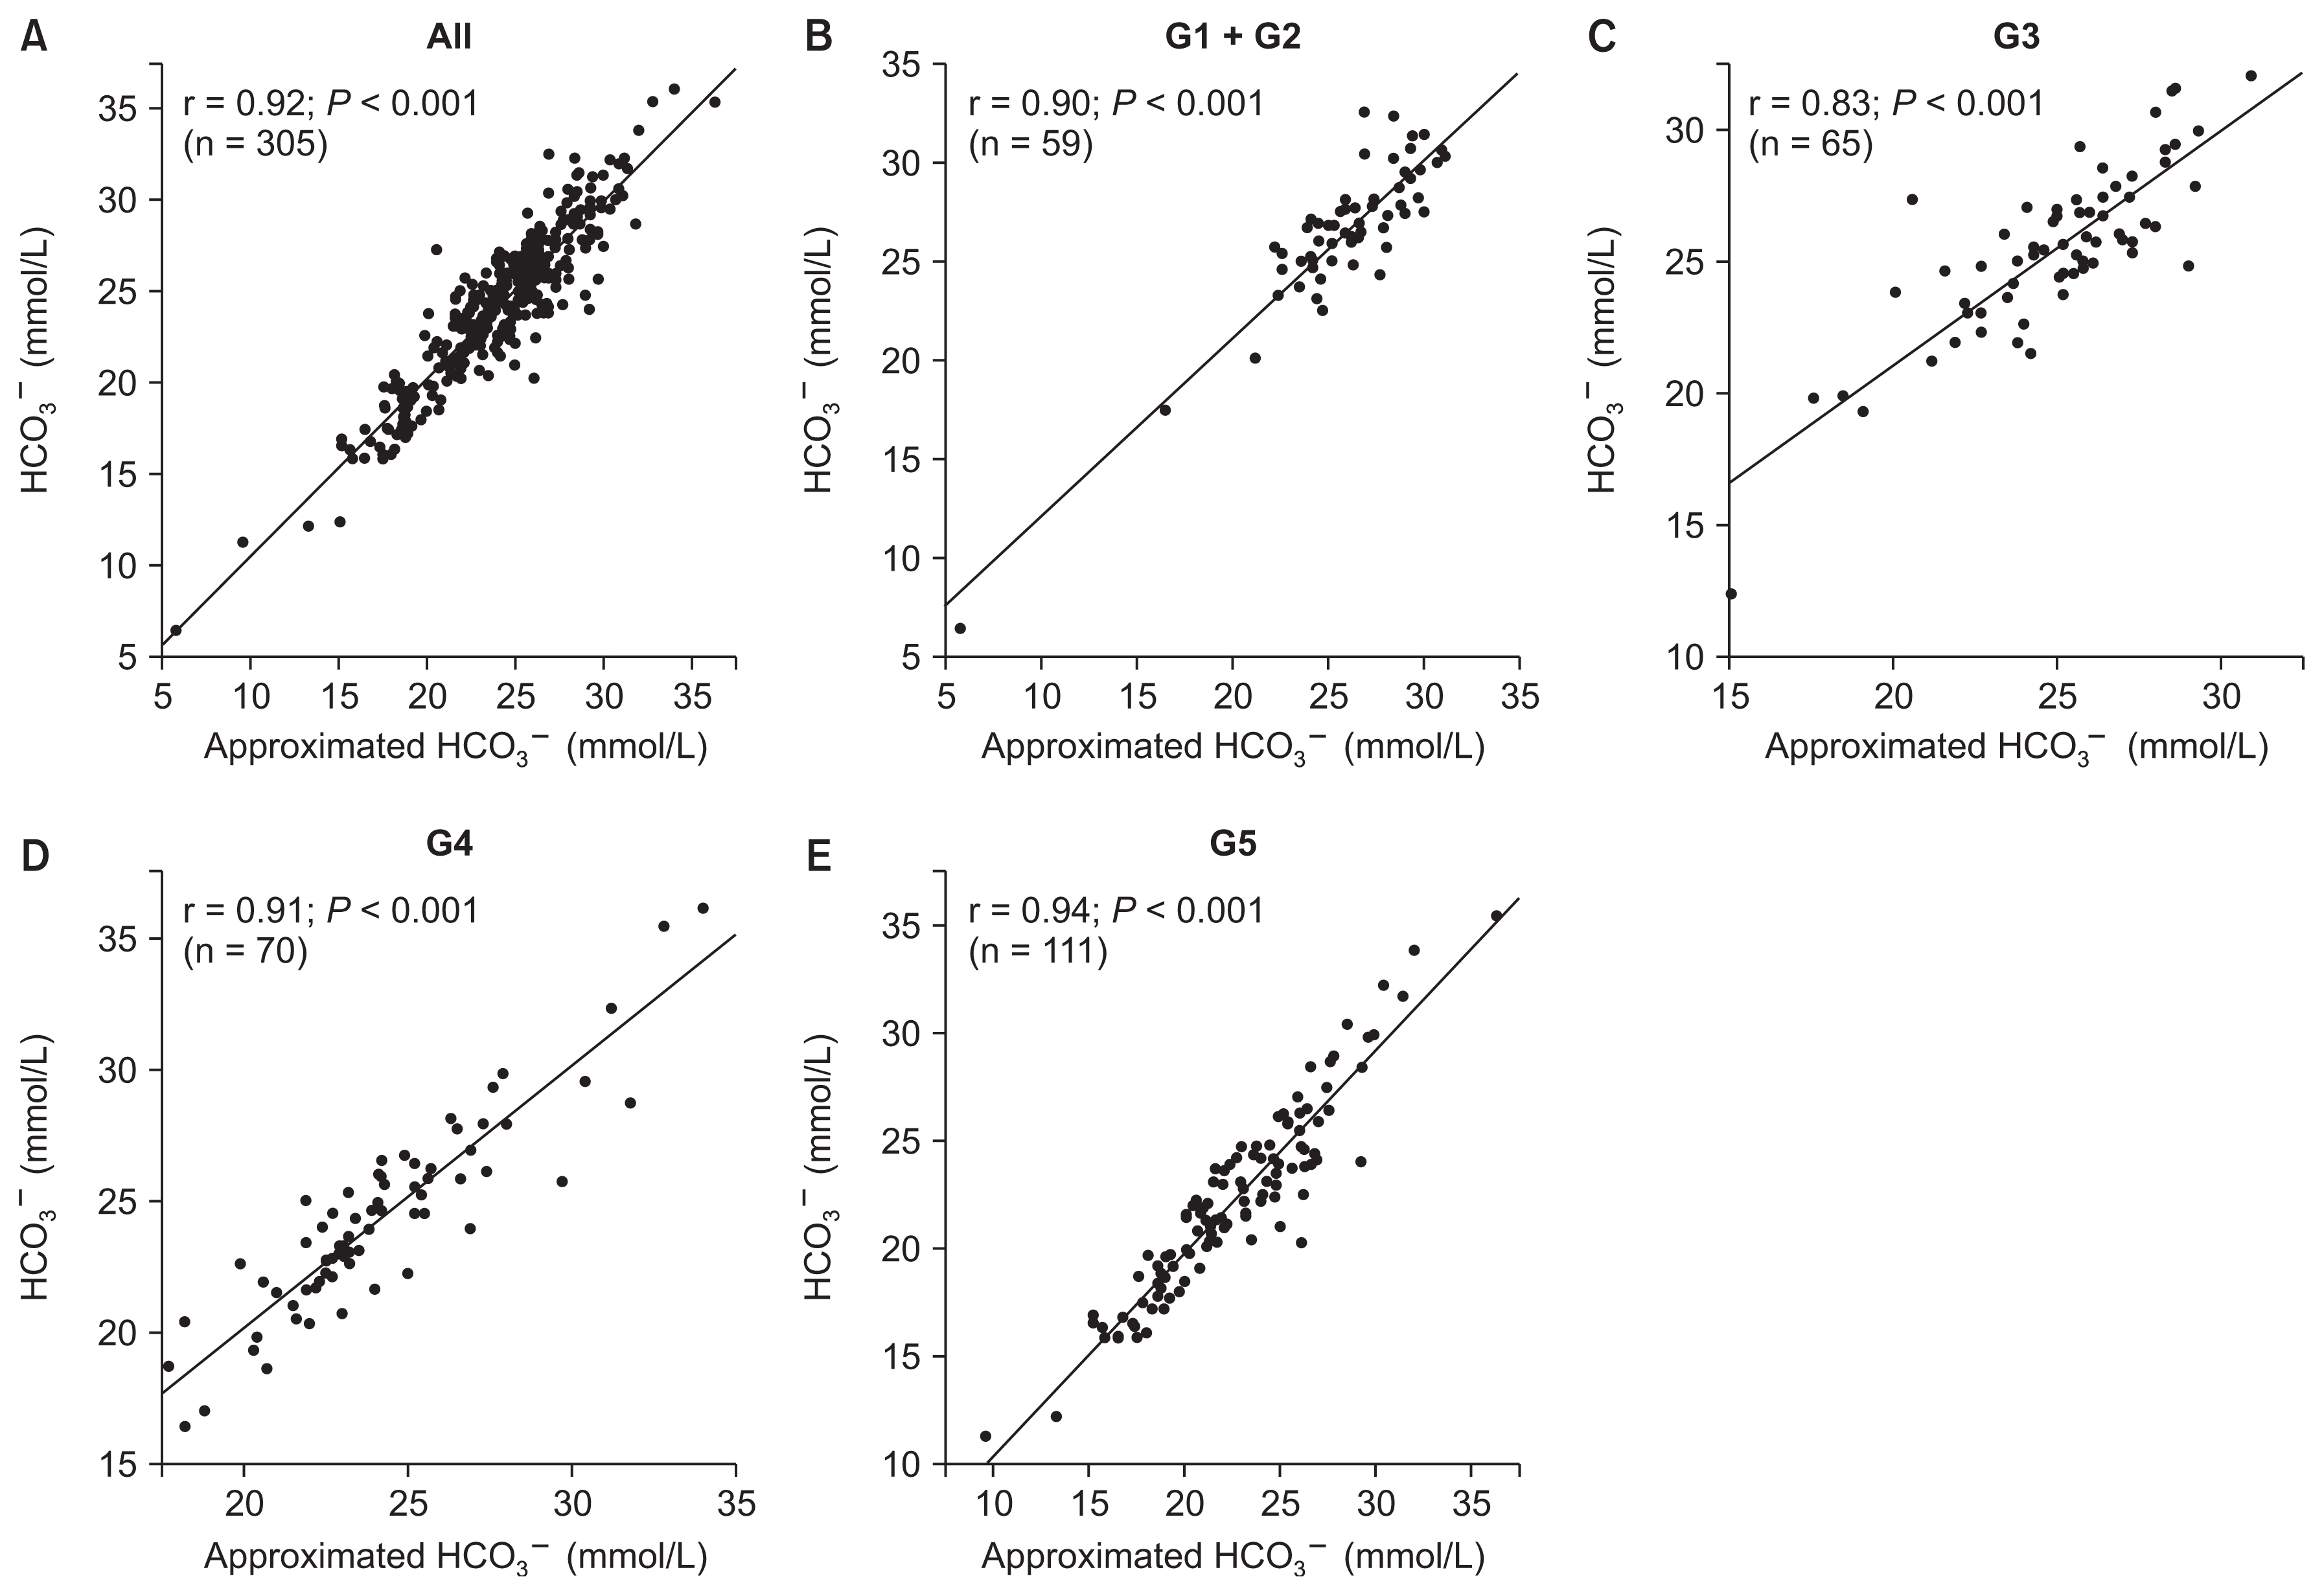
Relationships between approximated bicarbonate ion (HCO3−) concentration and measured HCO3− concentration according to chronic kidney disease (CKD) stage.
(A) All patients, (B) patients with CKD stage G1 + G2, (C) patients with CKD stage G3, (D) patients with CKD stage G4, (E) patients with CKD stage G5.
Diagnostic accuracy of serum total CO2 and approximated HCO3− concentration for prediction of low bicarbonate and high bicarbonate levels
The ROC curves of serum total CO2 and approximated HCO3− concentration for detecting low bicarbonate (HCO3− < 24 mmol/L) and high bicarbonate (HCO3− ≥ 24 mmol/L) are shown in Fig. 3. The AUCs of serum total CO2 and approximated HCO3− concentration for detection of low bicarbonate and high bicarbonate were 0.981, 0.996, 0.993, and 1.000, respectively. The optimal cutoff values of serum total CO2 and approximated HCO3− concentration for detection of low bicarbonate and high bicarbonate were 22.2 mmol/L, 23.2 mmol/L, 23.8 mmol/L, and 24.0 mmol/L, respectively. The 2 × 2 tables stratified by serum total CO2, the approximated HCO3− concentration, and the measured HCO3− concentration for low bicarbonate and high bicarbonate are shown in Table 3. The diagnostic accuracy values of serum total CO2 and approximated HCO3− concentration for prediction of low bicarbonate and high bicarbonate are shown in Table 4. The sensitivity, specificity, positive predictive value, negative predictive value, accuracy, pre-test probability, positive post-test probability, and negative post-test probability were 91.7%, 73.4%, 72.5%, 92.0%, 81.3%, 43.3%, 72.5%, and 8.0% for serum total CO2 and 84.8%, 87.9%, 84.2%, 88.4%, 86.6%, 43.3%, 84.2%, and 11.6% for approximated HCO3− concentration, respectively. The approximated HCO3− concentration showed superior accuracy compared with that for serum total CO2 (86.6% vs. 81.3%).
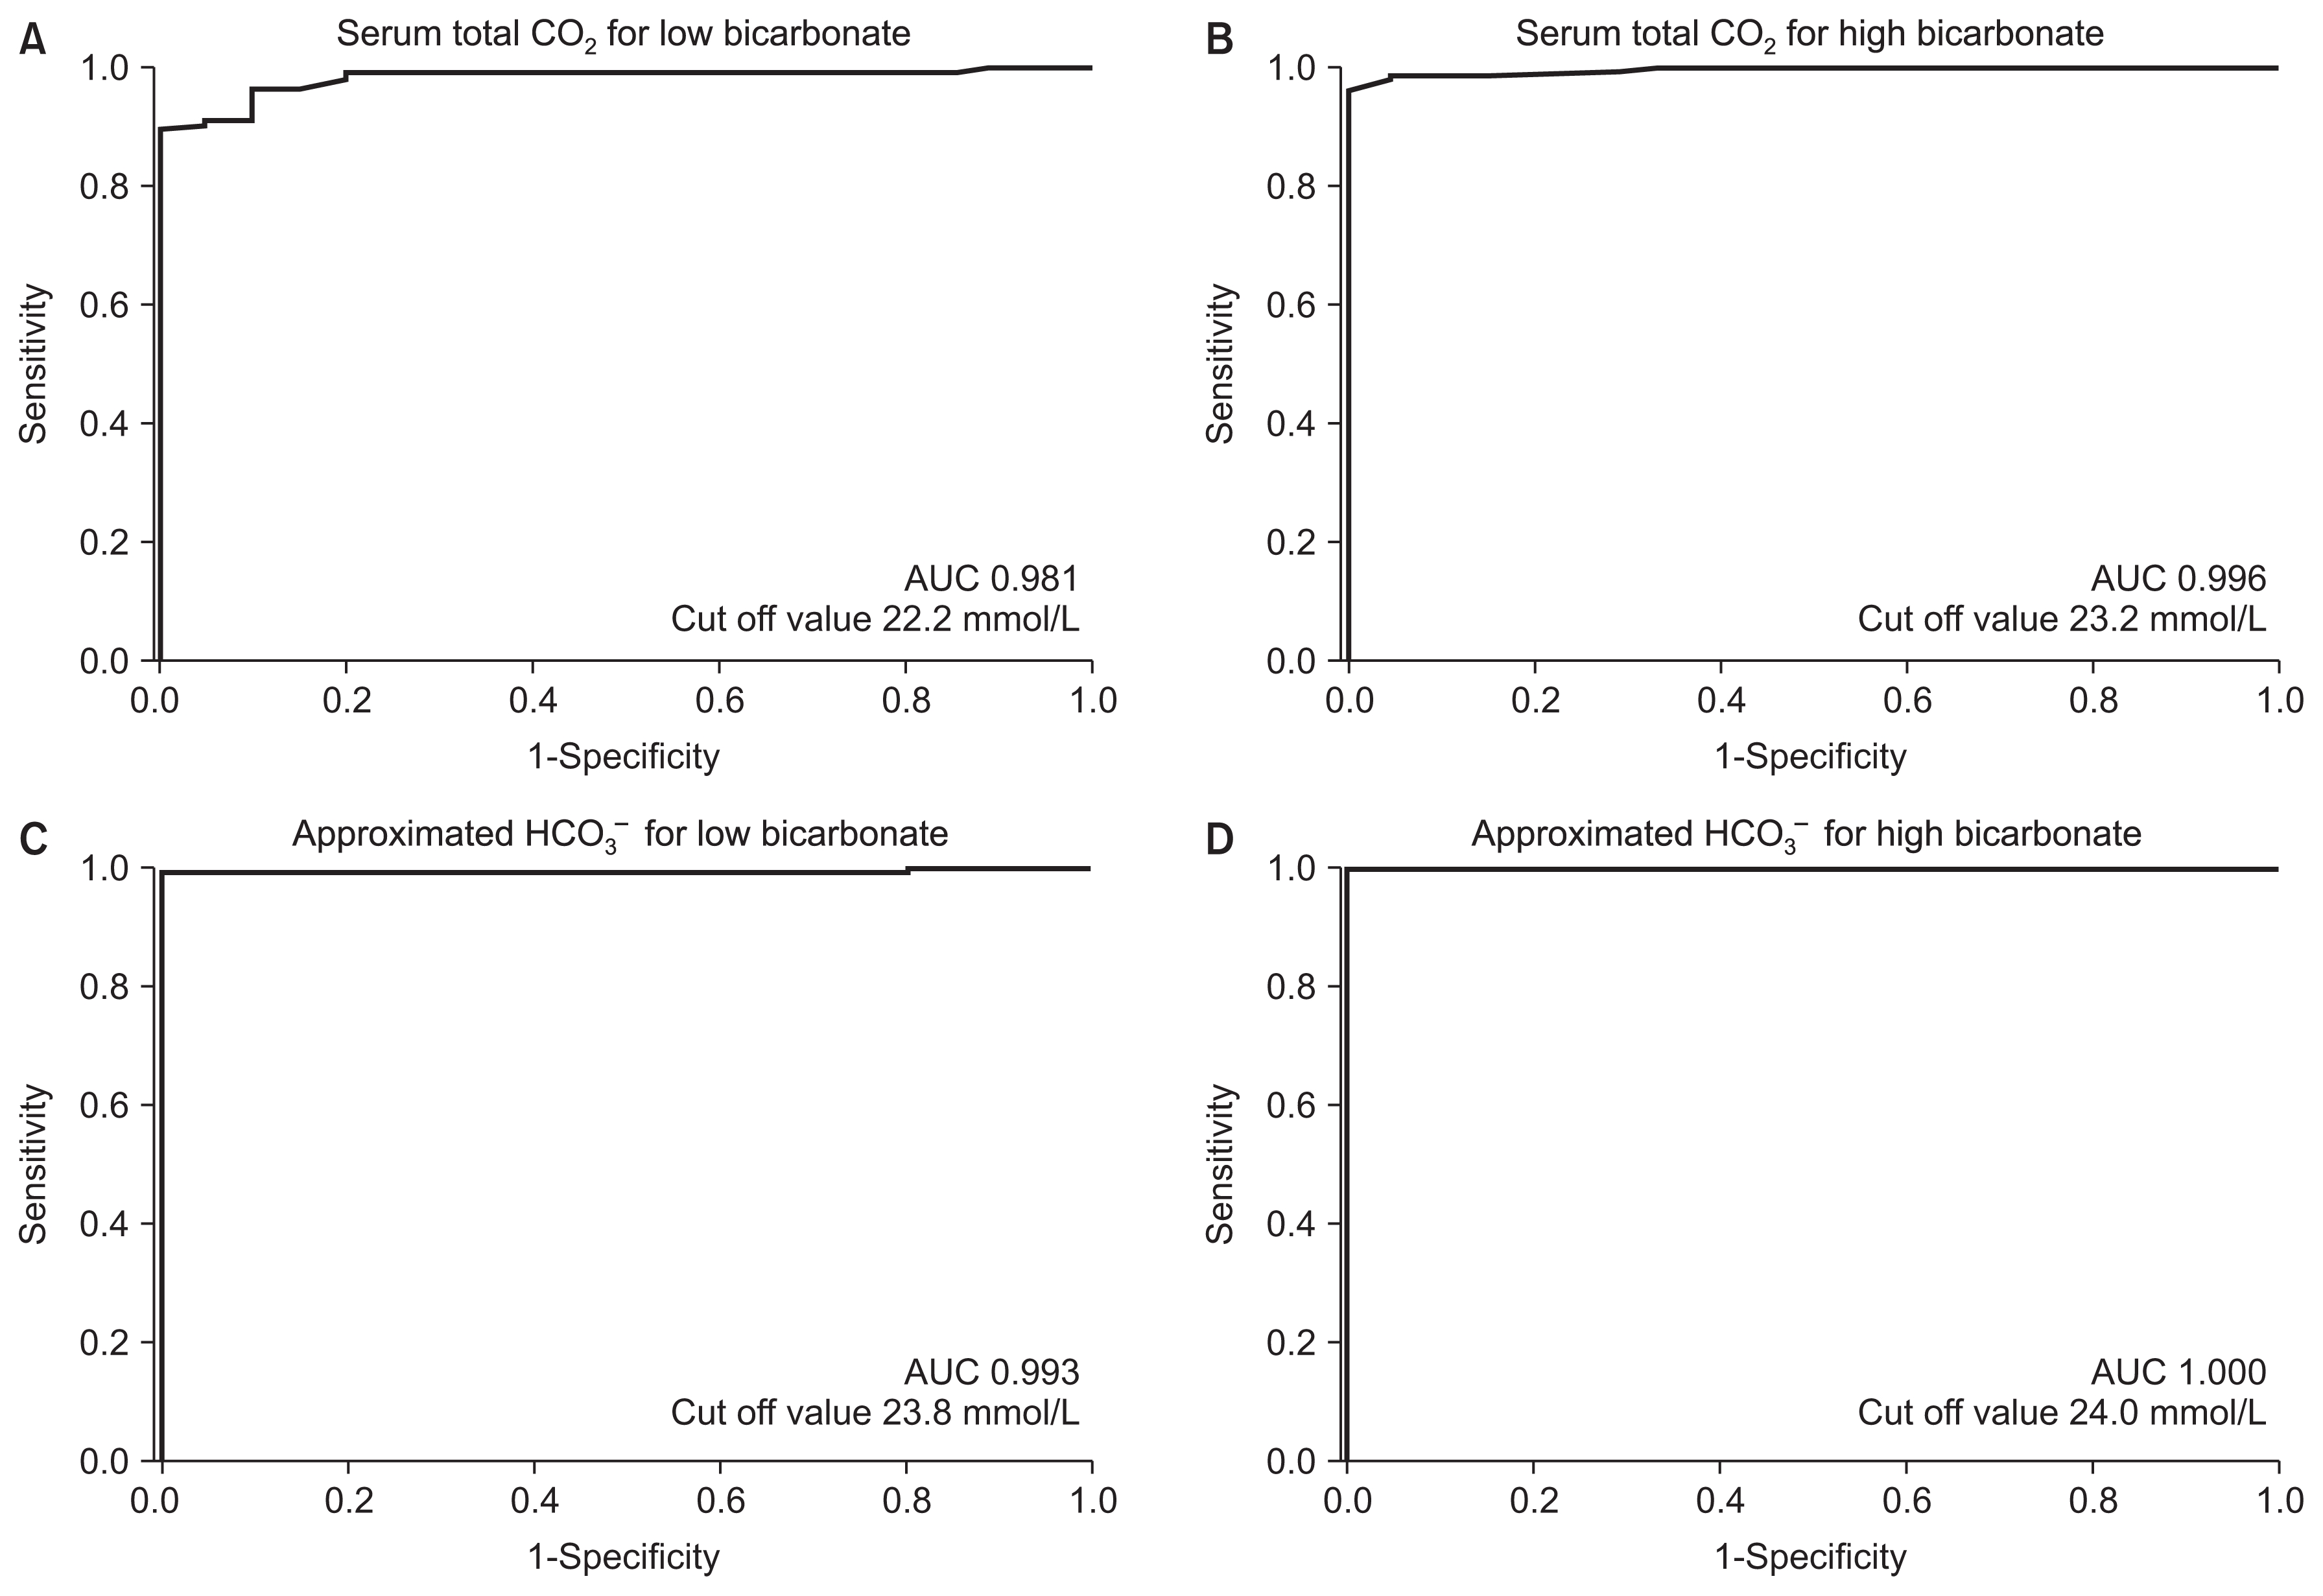
Receiver operating characteristic (ROC) curve analysis for detecting low bicarbonate (bicarbonate ion [HCO3−] < 24 mmol/L) and high bicarbonate (HCO3− ≥ 24 mmol/L).
(A) The ROC curve of serum total carbon dioxide (CO2) for low bicarbonate. (B) The ROC curve of serum total CO2 for high bicarbonate. (C) The ROC curve of approximated HCO3− concentration for low bicarbonate. (D) The ROC curve of approximated HCO3− concentration for high bicarbonate.
AUC, area under the curve.

2 × 2 tables stratified by serum total CO2, approximated HCO3− concentration and measured HCO3− concentration for low bicarbonate (HCO3− < 24 mmol/L) and high bicarbonate (HCO3− ≥ 24 mmol/L)

Comparison of diagnostic values between serum total CO2 and approximated HCO3−
Discussion
We assessed the relationship between serum total CO2 and HCO3− concentration in CKD patients who were not undergoing renal replacement therapy. This assessment enabled development of an approximation formula for prediction of low bicarbonate and high bicarbonate using clinical parameters involving serum total CO2.
Serum total CO2 is the total concentration of all forms of CO2 in a serum sample: HCO3−, carbonate, and dissolved CO2. In general, serum total CO2 value is approximately equivalent to the HCO3− concentration because most of the CO2 in blood exists as HCO3− [6]. Furthermore, serum total CO2 was shown to have a substantial correlation with HCO3− concentration by Kumar and Karon [7]. However, a discrepancy between serum total CO2 and HCO3− concentration caused by the influence of temperature and acidity [11] is occasionally observed in patients without renal impairment [12]. In the present study, serum albumin, eGFR, chloride, and blood glucose, in addition to serum total CO2, were independently associated with HCO3− concentration in serum.
Increased serum albumin has been reported to be associated with metabolic acidosis in pre-dialysis CKD patients [13], and this phenomenon can be explained, at least in part, by the weak acidity of albumin [14]. These findings are consistent with our result showing a negative correlation between the concentrations of albumin and HCO3− in serum. Furthermore, the HCO3− concentration in serum decreases with progression of CKD stage [13], and this reduction has been suggested to be due to the inability of the kidney to synthesize ammonia, regenerate HCO3−, and excrete hydrogen ions (H+) [15]. Therefore, HCO3− concentration was expected to have a positive correlation with eGFR. However, in the present study, HCO3− concentration was negatively correlated with GFR. This difference between our result and those of published reports may be explained by the increase in the ratio of use of diuretics and sodium bicarbonate with progression of CKD stage because such use leads to an increase in HCO3− concentration in serum [13,16]. Loop diuretics and thiazide diuretics inhibit the Na+-K+-2Cl− cotransporter and Na+-Cl− cotransporter, respectively, and increase sodium delivery to distal tubular segments. The delivered sodium is reabsorbed at cortical collecting ducts due to, at least in part, the increase of serum aldosterone induced by diuretic-associated reduction of intravascular fluids [17]. Furthermore, an increase in serum aldosterone associated with diuretic use stimulates H+-ATPase activity at cortical collecting ducts [18], which leads to an increase in HCO3− concentration in serum. An increase in serum aldosterone also stimulates potassium excretion at cortical collecting ducts, which leads to a decrease in serum potassium concentration [19]. A decreased serum potassium concentration may increase renal production of ammonia and excretion of ammonium ions, which result in an increase in HCO3− concentration in serum [20]. In addition, sodium bicarbonate is administered frequently in CKD patients with metabolic acidosis. Therefore, use of diuretics and sodium bicarbonate may reflect the inverse relationship between changes in eGFR and HCO3− concentration in serum noted in our study. However, further studies in a much larger cohort are needed to confirm the relationship between these factors.
Hyperchloremic metabolic acidosis is observed in 30% to 50% of patients with chronic renal failure [21]. The chloride concentration in serum has been reported to increase as HCO3− concentration in serum decreases [22]. We documented a negative correlation between chloride and HCO3− concentrations in serum with progression of CKD stage, a finding that is compatible with that of Widmer et al [22]. Blood glucose was negatively correlated with HCO3− concentration in serum in the present study. Uremia inhibits insulin secretion as well as insulin sensitivity [23], which leads to an increase in blood glucose concentration with metabolic acidosis via reduction in Na+/H+ exchanger activity [24]. Glucose appears in urine if the blood glucose concentration exceeds the renal threshold of 170 to 200 mg/dL [25]. Increased urinary glucose has been shown to inhibit H+ excretion through proximal renal tubules [26] and activates the sodium–glucose-coupled transporter, which inhibits the Na+-H+ exchanger via competition for sodium influx. The subsequent decreased H+ excretion leads to metabolic acidosis with a reduction of HCO3− concentration in plasma [27]. Therefore, our findings may be explained by data reported previously.
Measurement of serum total CO2 has two main advantages compared with blood-gas analyses. First, the cost of a blood-gas syringe can be saved, and the amount of blood collected is reduced. Second, serum total CO2 can be used to predict metabolic acidosis and metabolic alkalosis without use of a blood-gas analyzer. Therefore, measurement of serum total CO2 would alleviate some of the burden on patients and laboratory staff. In addition, the approximated HCO3− concentration derived from clinical parameters, including serum total CO2, could have been useful for predicting disturbances of acid–base metabolism in the present study.
Our study had four main limitations. First, this was a single-center, retrospective, observational study and may have been subject to bias in patient selection. Second, the study cohort was small, which limits the generaliz-ability of our findings. Third, several baseline characteristics, including age and medication use, were significantly different among groups categorized by CKD stage. Fourth, we used venous blood samples for analyses. The results might have been different if samples of arterial blood had been used. However, pH and HCO3− have been reported to show sufficient agreement between arterial and venous blood-gas analysis [28]. Therefore, further prospective, large-scale, multicenter studies with arterial blood samples for gas analysis are required to confirm our findings.
In conclusion, serum total CO2 was substantially correlated with HCO3− concentration in the serum of pre-dialysis CKD patients. An approximation formula including serum total CO2 showed superior diagnostic accuracy for low and high bicarbonate levels compared with serum total CO2.
Acknowledgments
We thank all staff of the Department of Clinical Laboratory (Saitama Medical Center, Jichi Medical University, Saitama, Japan) for their excellent work. We also thank Arshad Makhdum, PhD, from Edanz Group (www.edanzediting.com/ac) for editing a draft of this manuscript.
Notes
Conflicts of interest
All authors have no conflicts of interest to declare.
Authors’ contributions
Keiji Hirai and Susumu Ookawara conceived and designed the research. Keiji Hirai, Haruhisa Miyazawa, Kiyonori Ito, Yuichirou Ueda, Yoshio Kaku, and Taro Hoshino performed research. Saori Minato, Shohei Kaneko, Katsunori Yanai, Hiroki Ishii, Taisuke Kitano, and Mitsutoshi Shindo collected the data. Keiji Hirai, Tatsuro Watano, Shinji Fujino, and Kiyoka Omoto performed the analysis. Keiji Hirai and Susumu Ookawara wrote the paper. Yoshiyuki Morishita made critical revisions and approved the final version. All authors read and approved the final manuscript.