Conversion from acetate dialysate to citrate dialysate in a central delivery system for maintenance hemodialysis patients
Article information
Abstract
Background
The objective of this study was to compare the impact of citrate dialysate (CD) and standard acetate dialysate (AD) in hemodialysis by central delivery system (CDS) on heparin demand, and clinical parameters.
Methods
We retrospectively evaluated 75 patients on maintenance hemodialysis with CDS. Patients underwent hemodialysis with AD over a six-month period (AD period), followed by another six-month period using CD (CD period). Various parameters including mean heparin dosage, high sensitivity C-reactive protein (hsCRP), calcium-phosphate product (CaxP), intact parathyroid hormone (iPTH), and urea reduction ratio (URR) were collated at the end of each period.
Results
Patients were 60.5 ± 14.7 years old, of whom 62.7% were male. Patients required less heparin when receiving CD (AD period: 1,129 ± 1,033 IU/session vs. CD period: 787 ± 755 IU/session, P < 0.001). After the CD period (Δ CD ), pre-dialysis total CO2 increased to 1.21 ± 2.80 mmol/L, compared to −2.44 ± 2.96 mmol/L (P < 0.001) after the AD period (Δ AD ). After the CD period, concentrations of iPTH (Δ AD : 73.04 ± 216.34 pg/mL vs. Δ CD : −106.66 ± 251.79 pg/mL, P < 0.001) and CaxP (Δ AD : 4.32 ± 16.63 mg2/dL2 vs. Δ CD : −4.67 ± 15.27 mg2/dL2, P = 0.015) decreased. While hsCRP levels decreased after the CD period (Δ AD : 0.07 ± 4.09 mg/L vs. Δ CD : −0.75 ± 4.56 mg/L, P = 0.705), the change was statistically insignificant. URR remained above clinical guideline of 65% after both periods (Δ AD : 72.33 ± 6.92% vs. Δ CD period: 69.20 ± 4.49%, P = 0.046).
Conclusion
Our study confirmed that the use of CD in CDS required lower heparin doses compared to the use of AD. The use of CD also provided a more stable acid-base status.
Introduction
In the last several decades, hemodialysis techniques for patients with end-stage renal disease (ESRD) have improved. In particular, acetate dialysate (AD or acetate) containing small amounts of acetate as an alkaline buffer has been widespread since the 1980s. Even small amounts of acetate may have adverse effects, such as hemodynamic instability, inflammation and acidosis [1,2]. A considerable amount of acetic acid is delivered into the body when using AD for hemodialysis. In recent years, efforts have been made to improve the biocompatibility of hemodialysis by replacing AD with citrate dialysate (CD or citrate) in order to overcome such disadvantages [3]. The use of citrate as buffer has several advantages over acetate, including hemodynamic tolerance and systemic anticoagulant properties. Unlike acetate, citrate is more effective in improving metabolic acidosis because it is rapidly metabolized to carbon dioxide and energy [3]. Citrate also reduces hemodialysis-induced inflammatory responses, as citrate forms calcium citrate complexes and inhibits complement activation [4,5]. Reducing inflammation and oxidative stress can clinically decrease long-term mortality by lowering the risk of cardiovascular disease in dialysis patients [6–9]. The calcium citrate complex inhibits coagulation activation and blood clotting in the extracorporeal circuit, thereby reducing the heparin demand during hemodialysis without affecting systemic coagulation and increasing bleeding risks [10–13]. As such, side effects of heparin can be reduced when used in CD during hemodialysis.
The goal of our study was to compare changes in several laboratory parameters of the two dialysis solutions: AD and CD. We reviewed and analyzed changes in an inflammatory marker, acid-base, and blood pressure during hemodialysis using each dialysis solution, and compared changes in serum calcium, phosphorus, intact parathyroid hormone (iPTH), and other laboratory parameters.
Methods
Patients
This study involved 75 patients on maintenance hemodialysis. All of the patients were clinically stable and over 18 years of age. The exclusion criteria were contraindication to heparin, known coagulation disorders, dysfunctional central venous catheters, vascular access dysfunction, malignancy, active infection, uncontrolled thyroid disease, planned kidney transplantation during the study period and planned conversion of peritoneal dialysis during the study period.
Study design
This study was conducted from March 2016 to March 2017 at an outpatient facility in the dialysis unit of the Kyung Hee University Hospital, Seoul, South Korea. For the first six months, each patient received hemodialysis with AD (AD period), followed by another six-month period during which they received hemodialysis with CD (CD period). Fig. 1 and Table 1 demonstrate the overall study design and the composition of the dialysates (BM Vitek Co., Ltd., Seoul, Korea) used during the AD period and CD period, respectively.
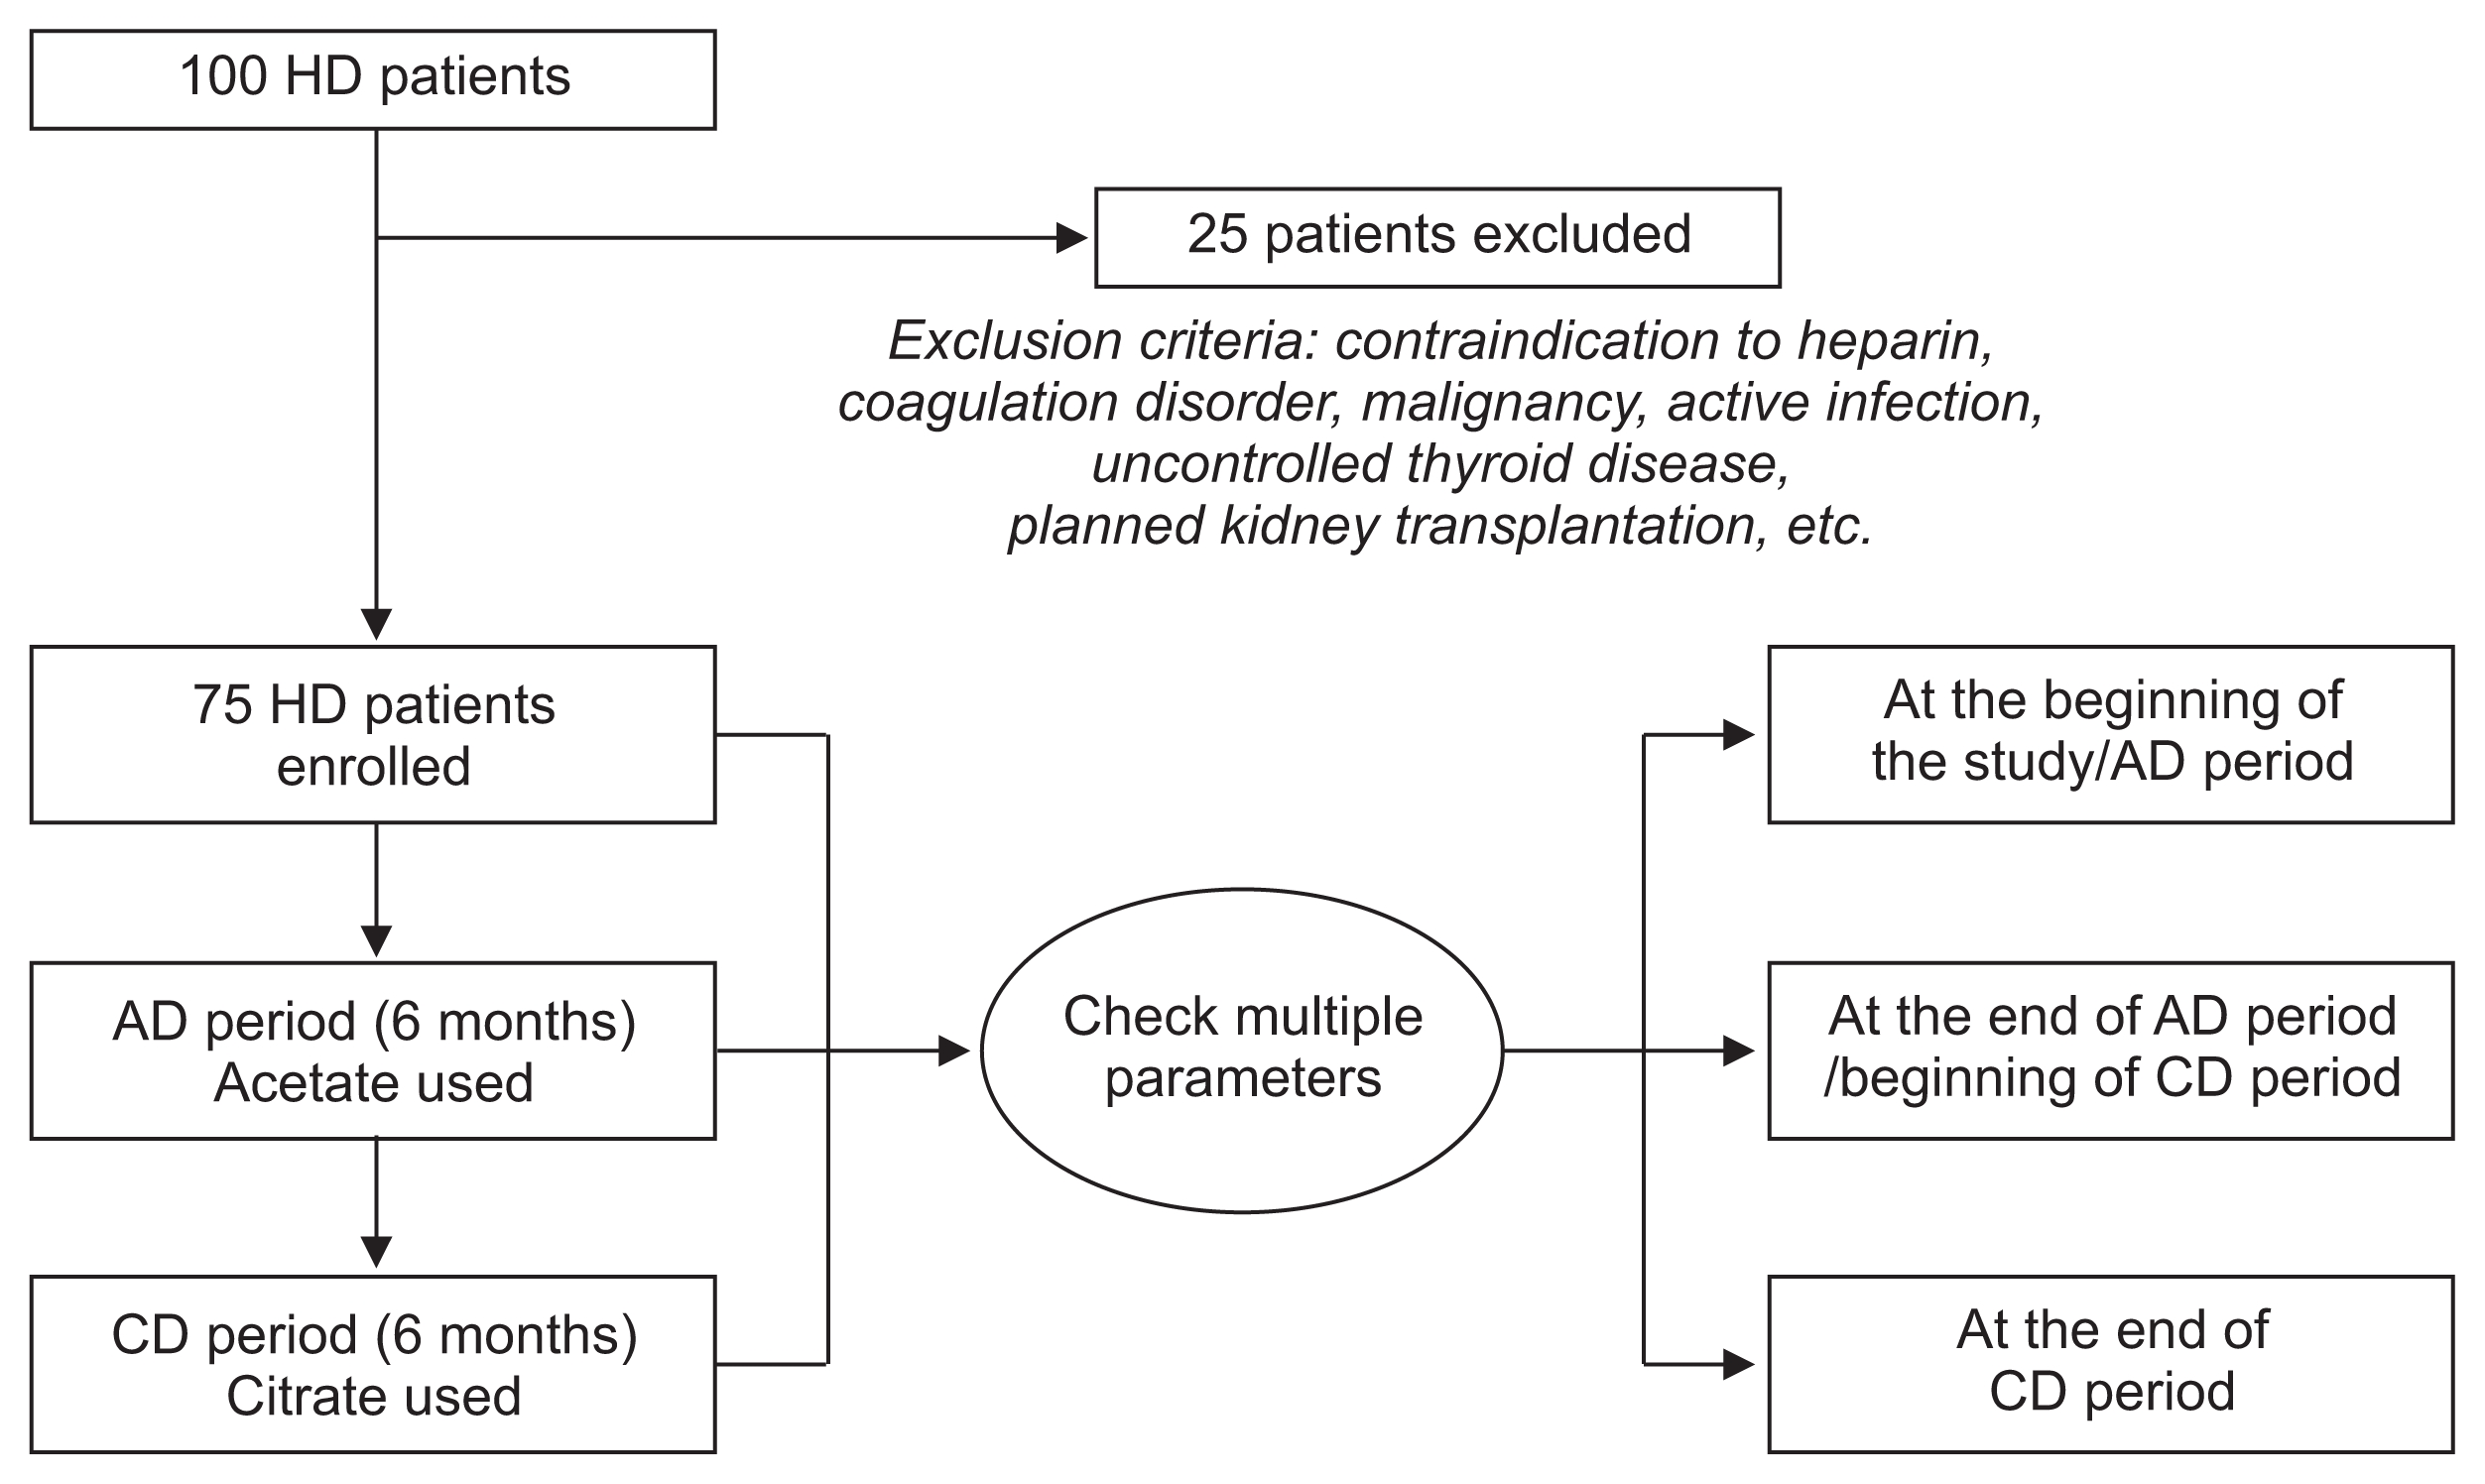
Flow chart of study design
AD period, a six-month period during which acetate dialysate was used; CD period, a six-month period during which citrate dialysate was used; HD, hemodialysis.

Dialysate composition
Three to four-hour hemodialysis sessions were performed three times a week using a 5008S Basic ONLINE plus® machine (Fresenius Medical Care AG & Co., Bad Homburg vor der Höhe, Germany). The target dry weights of the subjects were determined at the beginning of the study, and dialysis prescriptions were ordered by a nephrologist. Systolic and diastolic blood pressures and heart rates were measured at the start and end of each hemodialysis session, using an automated Blood Pressure Monitor 5008 (Fresenius Medical Care AG & Co.) integrated in the dialysis machine. Changes in intradialytic blood pressure were analyzed.
The changes after conversion from AD to CD in key laboratory parameters, including blood urea nitrogen (BUN), creatinine, calcium, phosphate, iPTH, high sensitivity C-reactive protein (hsCRP) and total CO2 (tCO2) were observed and measured after 6 months. Heparin doses for each hemodialysis session of all patients were recorded, and the mean heparin doses per session of each patient were compared during the AD period and the CD period. We adjusted patient heparin dosages based on their existing heparin prescriptions, and measured the occurrences of dialyzer clotting events. Usual heparin protocol would include an initial loading of 500 to 1,000 units, followed by a dose of 500 to 1,000 units per hour, subject to adjustment by 500 to 1,000 units based on the occurrences of clotting events.
We classified bleeding events into two categories, which were major bleeding events and minor bleeding events, and then measured activated partial thromboplastin time for these events. Major bleeding events included life-threatening events such as intracerebral hemorrhage and gastrointestinal bleeding requiring hospitalization, and minor bleeding events such as puncture site oozing and other minor bruises. The scale for visual clotting for this study was as follows: “0” = clear; “1” = some streaking, “2” = 1/2 clotted, but dialysis still possible, “3” = 3/4 clotted, but dialysis still possible, and “4” = completely clotted. Clotting events with scores of 2 and above were counted during dialysis.
The formula used in urea reduction ratio (URR) calculator was URR = (Upre − Upost)/Upre × 100 = (1 − Upre/Upost) × 100, where Upre = pre-dialysis urea levels, and Upost = post-dialysis urea levels [14]. This value quantified dialysis efficiency by comparing urea levels before and after dialysis.
Statistics
The results were expressed as mean ± standard deviation. Statistical analyses were performed using the statistical software package (SPSS ver. 12.0; SPSS Inc., Chicago, IL, USA). Laboratory parameters were compared with a paired t test for changes in mean values of each parameter, obtained at the end of each 6-month period. In all cases, P < 0.05 was considered statistically significant.
Results
Baseline characteristics
Baseline characteristics, including patient age, sex, body mass index (BMI), causes of ESRD, comorbidities, laboratory data, and hemodialysis prescriptions were investigated. The mean age was 60.5 ± 14.7 years, and 62.7% of the patients were male. The mean BMI of the patients was 23.3 ± 3.9 kg/m2. The most common cause of ESRD was diabetes mellitus (56.0%), followed by unknown (17.3%), hypertension (12.0%), glomerular disease (10.7%), and autosomal dominant polycystic kidney disease (4.0%). In addition, several clinical parameters and URR of all subjects were examined at the beginning of the study (Table 2). Dialysis prescriptions other than heparin dose were largely identical between the AD and CD periods (Table 3).

Baseline characteristics

Dialysis prescription, hemodynamic status and dialysis efficiency
Mean heparin dose per session
The use of CD reduced the mean heparin dose per dialysis session by about 30% compared to AD (AD period: 1,129 ± 1,033 IU/session vs. CD period: 787 ± 755 IU/session, P < 0.001) (Table 4). Despite an approximate 30% reduction in heparin dose in the CD period, there were no significant differences in the occurrences of clotting events requiring dialyzer changes, or in occurrences of vascular access intervention due to arteriovenous fistula (AVF)/arteriovenous graft (AVG) occlusion. There were six instances of intradialytic clotting and three of AVF/AVG access failures during the AD period, compared to five instances of intradialytic clotting and two of AVF/AVG access failures during the CD period. The mean heparin dose figures included patients that had heparin-free dialysis sessions, as well as those who stopped using heparin during our study period, and therefore the standard deviation was relatively large. Among the study population (n = 75), 24 did not use heparin at all, and two stopped using heparin during the study duration.

Changes in clinical and laboratory parameters
Clinical and laboratory parameters
After CD period, pre-dialysis bicarbonate levels significantly increased compared to AD period (Δ AD : −2.44 ± 2.96 mmol/L vs. Δ CD : 1.21 ± 2.80 mmol/L, P < 0.001). This indicated that the use of citrate lowered inter-dialytic shifts in tCO2 and provided a more stable acid-base status. The use of citrate also significantly increased the serum levels for total calcium, while significantly reducing the levels of serum phosphate. However, calcium-phosphate product was significantly reduced after CD usage, compared to those after AD usage. Significant reductions in calcium-phosphate product was observed after the CD period (Δ AD : 4.32 ± 16.63 mg2/dL2 vs. Δ CD : −4.67 ± 15.27 mg2/dL2, P = 0.015). Also, iPTH decreased after the CD period (Δ AD : 73.04 ± 216.34 pg/mL vs. Δ CD : −106.66 ± 251.79 pg/mL, P < 0.001). For the inflammatory parameters, each patient’s level of hsCRP, an inflammation indicator used in this study, was measured at the beginning and the end of the AD and CD periods. While we observed a decrease in hsCRP (Δ AD : 0.07 ± 4.09 mg/L vs. Δ CD : −0.75 ± 4.56 mg/L, P = 0.705), the difference not statistically significant (Table 4).

Comparisons of clotting and bleeding events
Dialysis efficiency
We measured URR at the end of the AD and CD periods to compare dialysis efficiency. URR were 72.33 ± 6.92% and 69.20 ± 4.49% at the end of the AD and CD periods, respectively, indicating that adequate levels of dialysis efficiency were maintained during both periods (Table 3).
Bleeding events
There was one instance of gastrointestinal bleeding, zero of intracranial hemorrhage, and two other bleeding tendencies during the AD period, but there were three instances of other bleeding tendencies during the CD period. There were no statistically significant differences in the occurrences of bleeding events between the two periods.
Discussion
Our study demonstrated that the substitution of citrate containing dialysate in CDS had significant impacts, such as lower intradialytic heparin demand and a more stable acid-base status. Such positive impacts were obtained without hurting dialysis efficiency or causing higher frequency of bleeding events.
In this study, the use of citrate as a buffer decreased the anticoagulation demand during hemodialysis without clotting events. One of the previous studies on this substitution included 277 hemodialysis patients in an open-label, sequential four-phase study for 8 weeks, and confirmed that heparin demand decreased when citrate was used [15]. The length of our study was 12 months and the results of each dialysate use were analyzed and compared over 6-month periods. The required heparin dose decreased by 30% during the CD period compared to the AD period. Despite the decrease in heparin dosage, there were no significant differences in occurrences of visual clotting requiring dialyzer changes. These results were clinically meaningful since post-dialysis bleeding and other side effects such as thrombocytopenia can be reduced by the use of citrate.
The use of citrate significantly increased the pre-dialytic bicarbonate level and provided a more stable acid-base status. Both acetate and citrate can be used as indirect bicarbonate buffers. In this study, however, only pre-dialytic bicarbonate levels were measured while intradialytic bicarbonate changes were not. Previous studies showed that CD reduced pre-dialytic pH levels and base excess compared to AD [3,16]. However, in our study, pH was not measured separately due to the inconvenience of arterial blood sampling. Instead, total venous CO2 levels were measured.
Our study demonstrated that the use of CD significantly increased the levels of total serum calcium and decreased the levels of phosphorus. Previous studies revealed that this was due to citrate binding to calcium to form a complex. Although the formed complexes are partially removed through the membrane during hemodialysis, the levels of serum total calcium increased when the concentration of the Ca-citrate complex in the blood increased [17]. However, since serum calcium and phosphorus levels can also be highly related to medications, the types and doses of the medication taken by the patients were also examined. During the CD period, the prescription dosage of calcium-containing phosphate binders increased in 33 patients (44.0%), decreased in 16 patients (21.3%), and were the same in 26 patients (34.7%). The reason for the increased dosage of calcium-containing phosphate binders during CD period could be due to the differences in calcium concentrations in the two dialysates (AD: 2.75 mEq/L vs. CD: 2.5 mEq/L). On the other hand, prescription dosages of non-calcium-containing phosphate binders were unchanged in 54 patients (72.0%), decreased in 16 patients (21.3%), and increased in 5 patients (6.7%) during the CD period. Since this study only observed iPTH over a 6-month period, it is difficult to determine the relationship between iPTH and citrate. It may be possible that the results were biased due to the differences in prescription of calcium containing phosphate binders between the two periods. Therefore, it is difficult to single out the use of citrate as the reason for changes in calcium and phosphorus metabolism, and, the potential effects of medications taken by the patients of this study shall be considered as well.
It was reported that the use of citrate in dialysis resulted in a significant decrease in hsCRP, which is one of the key predictors of cardiovascular mortality in dialysis patients [18–20]. However, as our study was short-term, it was difficult to determine the long-term effects of citrate on inflammation. Factors such as infection, medications used and other inflammation could have affected patient hsCRP levels. In addition, our study was somewhat limited, as clinical and laboratory parameters were collated and analyzed only once after each 6-month period.
Previous studies found that Kt/V increased when citrate was used [3], because CD reduces pre-dialysis BUN by improving the acid-base status. The improvement of acidosis not only reduces the production of urea but also improves catabolism [3]. We measured URR instead of Kt/V to compare dialysis efficiency. While URR decreased after the CD period (Δ AD : 0.21 ± 5.53% vs. Δ CD : −0.40 ± 5.40%, P = 0.046), URR levels were maintained well above the clinical guideline of 65%.
This study had several limitations. First, the key clinical and laboratory parameters were collected only once after each 6-month period. Second, the number of enrolled patients was relatively small. Finally, this study was retrospective, not prospective, and had certain inherent limitations, such as potential bias stemming from the sequential use of acetate and citrate without appropriate washing periods and little control on other variables such as medications taken by patients. To overcome these limitations, the authors of this study are currently planning a prospective, cross-over study comparing the effects of CD and AD. However, the length of our study, with 6 months for the AD period and another 6 months for the CD period, was longer than most prior studies, allowing analysis of changes in key clinical and laboratory parameters over a longer duration, which was one of its key advantages. It was also meaningful that our study conducted an extensive examination and analysis of all key laboratory and clinical parameters, including heparin requirements, serum calcium, phosphate, iPTH, tCO2 and hsCRP, in a single study, allowing the assessment of the overall effect of citrate in hemodialysis.
According to our study, substituting AD with CD had a number of positive impacts in hemodialysis without hurting dialysis efficiency. The key advantages CD, among others, included a significant reduction in heparin requirements and a more stable acid-base status. While data of our study may need to be confirmed by a prospective study with a larger population and more control on other variables in hemodialysis, this retrospective study indicates that the use of CD yield improved dialysis results compared to conventional acetate-containing alternatives.
Acknowledgments
This study was supported by the Young Investigator Research Grant from the Korean Society of Nephrology (BAXTER, 2009).
Notes
Conflicts of interest
All authors have no conflicts of interest to declare.
Authors’ contributions
EJP was the main author who was involved in the study design and responsible for data interpretation and drafted the manuscript. SWJ, DRK, and JSK were involved in acquisition and analyses of the data and helped to draft the manuscript. TWL and CGI served as investigators and medical experts and were involved in the study design. KHJ was the principle investigator of the study, medical expert, and revised and approved the final manuscript. All authors read and approved the final manuscript.