Association of serum mineral parameters with mortality in hemodialysis patients: Data from the Korean end-stage renal disease registry
Article information
Abstract
Background
We investigated the associations between mineral metabolism parameters and mortality to identify optimal targets in Korean hemodialysis patients.
Methods
Among hemodialysis patients registered in the end-stage renal disease registry of the Korean Society of Nephrology between March 2012 and June 2017, those with serum calcium, phosphorus, and intact parathyroid hormone (iPTH) measured at enrollment were included. Association of serum levels of calcium, phosphorus, and iPTH with all-cause mortality was analyzed.
Results
Among 21,433 enrolled patients, 3,135 (14.6%) died during 24.8 ± 14.5 months of follow-up. After multivariable adjustment, patients in the first quintile of corrected calcium were associated with lower mortality (hazard ratio [HR], 0.84; 95% confidence interval [95% CI], 0.71–0.99; P = 0.003), while those in the fifth quintile were associated with higher mortality (HR, 1.39; 95% CI, 1.20–1.61; P < 0.001) compared with those in the third quintile. For phosphorus, only the lowest quintile was significantly associated with increased mortality (HR, 1.24; 95% CI, 1.08–1.43; P = 0.003). The lowest (HR, 1.18; 95% CI, 1.02–1.36; P = 0.026) and highest quintiles of iPTH (HR, 1.24; 95% CI, 1.05–1.46; P = 0.013) were associated with increased mortality. For target counts achieved according to the Kidney Disease Outcomes Quality Initiative guideline, patients who did not achieve any mineral parameter targets hadhigher mortality than those who achieved all three targets (HR, 1.37; 95% CI, 1.12–1.67; P = 0.003).
Conclusion
In Korean hemodialysis patients, high serum calcium, low phosphorus, and high and low iPTH levels were associated with increased all-cause mortality.
Introduction
Chronic kidney disease-mineral bone disorder (CKD-MBD) is a systemic disorder of dysregulated mineral metabolism that results from chronic deterioration of renal function. CKD-MBD is usually recognized as a laboratory abnormality in mineral metabolites such as calcium (Ca), phosphorus (P), parathyroid hormone (PTH), 25(OH) vitamin D, and fibroblast growth factor-23; it also clinically manifests as bone disease and vascular or soft tissue calcification [1,2]. CKD-MBD is related to increased risk of fracture [3], cardiovascular disease [4], and overall mortality in patients with CKD [5,6].
Reflecting the significance of CKD-MBD for clinical outcomes, international guidelines on the proper management of CKD-MBD suggest target ranges of serum mineral parameters. Nonetheless, a study of 1,018 Korean hemodialysis patients revealed that a large portion of patients remain outside of the target range suggested by the Kidney Disease Outcomes Quality Initiative (KDOQI) guideline: Ca, 41.3%; P, 49.0%; and intact PTH (iPTH) 69.2% [7].
A prospective cohort study in Korea showed that the profile of mineral biochemical markers in Korean CKD patients differs from the profile of Western patients [8]. In addition, there are gaps between global guidelines and regional real-world practice. This discrepancy could be attributed to differences in ethnicity, dietary habits, socioeconomic status, health insurance reimbursement systems, and clinical practice patterns for treating CKD-MBD [5,8,9]. These regional characteristics need to be taken into account in addition to major international guidelines for optimal clinical practice. Based on mortality analysis using mineral values from the Japanese Renal Data Registry [10] and longer survival of Japanese patients compared to Western patients (i.e., need for longer hemodialysis duration), the Japanese Society for Dialysis Therapy guideline allows a higher P level (3.5–6.0 mg/ dL) and a relatively lower iPTH level (60–240 pg/mL) than other guidelines [11].
In 2015, the Korean working group published recommendations for the management of CKD-MBD [12]. To establish guideline on CKD-MBD that reflects the characteristics of Korean patients with end-stage renal disease (ESRD), more evidence of clinical outcomes is needed. However, data on the association of serum mineral parameters and clinical outcomes among Korean hemodialysis patients are scarce. Hence, we aimed to analyze the profiles of serum mineral parameters and the association of serum mineral levels with mortality of the Korean hemodialysis population using the nationwide Korean Society of Nephrology (KSN) ESRD Registry data.
Methods
Study population
The KSN has maintained the Insan Prof. Byung-Suk Min Memorial ESRD Registry, a nationwide registry on renal replacement therapy, since 1985 [13]. Data on dialysis patients have been collected via an online registry program on the KSN website (http://www.ksn.or.kr) since 2001. This registry includes data on about two-thirds of all Korean dialysis patients because it collects data on the basis of voluntary enrollment [14].
We conducted a retrospective study using data on hemodialysis patients registered in the KSN ESRD Registry between March 1, 2012 and June 17, 2017. Among the 63,783 patients screened, we identified 35,822 who were ≥ 18 years old and whose serum Ca, P, and iPTH were measured at the time of enrollment. After excluding patients with insufficient basic demographic data or without follow-up data since enrollment, 21,433 patients were included for analyses.
Data collection
Demographic and clinical data collected at enrollment were age, sex, dialysis vintage, etiology of renal failure, cardiovascular comorbidities, use of medications related to mineral metabolism (Ca-containing and non-Ca-containing phosphate binders, oral and intravenous vitamin D analogs, calcimimetics), height, weight, body mass index, systolic blood pressure, diastolic blood pressure, hemoglobin, blood urea nitrogen, serum creatinine, Ca, P, iPTH, albumin, cholesterol, urea reduction ratio, and single-pool Kt/V. When serum Ca was below 4.0 mg/dL, it was adjusted for serum albumin using the equation: corrected Ca = measured Ca + (4.0 − serum albumin in g/dL) × 0.8. In cases of death, if death date was specified to the year and month, death was estimated to be the first day of the month; if death date was specified only to year, the patient was excluded from analysis.
Statistical analysis
We categorized each serum corrected Ca, P, and iPTH into quintiles. The main outcome was all-cause mortality according to serum levels of corrected Ca, P, and iPTH.
Continuous variables were expressed as means with standard deviations. Categorical variables were expressed as frequencies and proportions. For intergroup comparisons, chi-squared test and one-way analysis of variance were used, as appropriate. All-cause mortality was analyzed with a Cox proportional hazard model and reported as hazard ratio (HR) and 95% confidence interval (CI). Multivariate analysis was adjusted for variables that were statistically significant in univariate analysis: age, sex, dialysis vintage, etiology of renal failure, history of cardiovascular disease (including coronary artery disease, heart failure, cerebrovascular disease, peripheral artery disease or diabetic foot), body mass index, hemoglobin, albumin, single-pool Kt/V, and serum corrected Ca, P, and iPTH. P values less than 0.05 were considered statistically significant.
To determine the mineral parameters to prioritize, we also evaluated all-cause mortality by numbers and combinations of mineral metabolism parameter targets achieved according to the KDOQI guideline [15] using a Cox proportional hazard model. The same variables were used as covariates in multivariate adjusted analysis, as described above.
All statistical analyses were performed using PASW Statistics software (version 18.0; SPSS Inc., Chicago, IL, USA).
Results
Patient characteristics by serum mineral parameter levels
For the 21,433 patients included, mean age was 60.6 ± 13.3 years; 59.3% were male; mean hemodialysis vintage was 53.6 ± 63.9 months; and 45.1% had diabetic nephropathy as the etiology of renal failure. Mean serum levels were 9.02 ± 0.83 mg/dL for corrected Ca, 4.91 ± 1.62 mg/dL for P, and 213.2 ± 231.0 pg/mL for iPTH. Among the 21,433 patients, 3,135 (14.6%) died during the mean 24.8 ± 14.5 months of follow-up.
Demographic, clinical, and laboratory characteristics of patients according to quintile groups of serum corrected Ca, P, iPTH levels are shown in Table 1 to 3. Serum levels for quintiles of corrected Ca were ≤ 8.40, 8.41–8.80, 8.81–9.14, 9.15–9.60, and ≥9.61 mg/dL (Table 1). Higher levels of corrected Ca were associated with longer dialysis vintage and fewer patients with diabetic nephropathy as the etiology of renal failure. There were no differences in the history of coronary artery disease, heart failure, peripheral artery disease or diabetic foot. Crude mortality was highest in the highest corrected Ca group with a tendency to increase with higher serum level of corrected Ca.

Patient characteristics by quintile of serum-corrected calcium level

Patient characteristics by quintile of serum intact parathyroid hormone level
Serum P ranges for quintiles were ≤ 3.59, 3.60–4.39, 4.40–5.10, 5.11–6.10, and ≥ 6.11 mg/dL (Table 2). Patients with higher P were younger, had longer dialysis vintage and higher serum urea nitrogen and creatinine levels, and fewer had diabetic nephropathy as the etiology of renal failure. More patients with higher P were taking non-Ca-containing phosphate binders, vitamin D, and cinacalcet. The lowest P group showed a prominently lower serum level of albumin. Crude mortality decreased as serum P increased.

Patient characteristics by quintile of serum phosphorus level
The iPTH was categorized into quintiles of serum level ≤ 59.6, 59.7–119.8, 119.9–189.7, 189.8–310.9, and ≥ 311.0 pg/mL (Table 3). Higher iPTH was associated with younger age, greater use of intravenous vitamin D and cinacalcet, and fewer patients with diabetic nephropathy as the etiology of renal failure.
All-cause mortality by serum mineral parameter levels
Fisrt, all-cause mortality was analyzed by unadjusted and adjusted Cox analysis, adjusting for age, sex, dialysis vintage, etiology of renal failure, history of cardiovascular diseases, body mass index, single-pool Kt/V, serum levels of hemoglobin and albumin, and quintiles of corrected Ca, P, and iPTH. After adjustment, variables associated with increased all-cause mortality were older age, male, and history of cardiovascular disease. Variables associated with decreased mortality were renal diseases other than diabetic nephropathy as cause of renal failure, higher body mass index, higher hemoglobin, higher albumin, and higher single-pool Kt/V (Table 4).

Variables independently associated with mortality by Cox proportional hazard models
For corrected Ca, P, and iPTH, we used a Cox proportional hazard model to analyze all-cause mortality according to quintiles compared with the reference third-quintile group. After adjustment, the lowest corrected Ca group (Q1) showed significantly lower HR (0.839; 95% CI, 0.714–0.986; P = 0.033), while the highest corrected Ca group (Q5) showed significantly higher HR (1.389; 95% CI, 1.198–1.611; P < 0.001). We observed a tendency for increasing Ca level to be associated with higher mortality (P for trend <0.001).
In unadjusted analysis, P level lower than the reference range was associated with higher mortality, and higher P level was associated with lower mortality in discordance with the general expectation. Though, after multivariable adjustment, only the lowest P group (Q1) was significantly associated with increased mortality (HR, 1.239; 95% CI 1.077–1.427; P = 0.003). In multivariate adjusted analysis, significantly higher HR was seen for the lowest (Q1) (1.176; 95% CI, 1.019–1.357; P = 0.026) and highest (Q5) iPTH quintiles (1.237; 95% CI, 1.046–1.464; P = 0.013).
Second, independent associations of all-cause death with serum levels of corrected Ca, P, and iPTH were analyzed by set intervals of the parameters, 0.4 mg/dL for corrected Ca, 1.0 mg/dL for P, and 50–300 pg/mL for iPTH (Fig. 1). The result was generally consistent with the results by quintile group. Mortality was significantly higher in patients with corrected Ca ≥ 9.6 mg/dL, in patients with P < 4.0 mg/dL, and in patients with iPTH < 50 pg/mL or ≥ 300 pg/mL. Comparisons were to reference groups of 8.4–8.8 mg/dL for corrected Ca, 4.0–5.0 mg/dL for P, and 50–150 pg/mL for iPTH. No significant differences were detected in mortality according to levels of Ca-P product. Detailed data are described in Supplementary Table 1.

Hazard ratios (HRs) for all-cause death according to serum levels of (A) corrected calcium (Ca), (B) phosphorus (P), and (C) intact parathyroid hormone (iPTH) using a Cox proportional hazard model
Range of reference groups: serum-corrected Ca, 8.8–9.2 mg/dL; P, 4.0–5.0 mg/dL; iPTH, 50–150 pg/mL. Multivariate adjustment model was adjusted for sex, age, dialysis vintage, renal failure etiology, cardiovascular disease history, body mass index, single-pool Kt/V, hemoglobin, serum albumin, corrected Ca, P, and iPTH.
Error bars denote 95% confidence interval. *P < 0.05.
All-cause mortality according to achievement of serum mineral targets of KDOQI guideline
We categorized patients into groups according to achievement of target ranges of serum Ca, P, and iPTH as recommended by the KDOQI guideline (Table 5). Patients who met no targets had significantly higher HR of death (1.365; 95% CI 1.115–1.671; P = 0.003) compared to those who met all three targets in adjusted Cox analysis (Fig. 2).

All-cause mortality by targets achieved according to the Kidney Disease Outcome Quality Initiative guideline
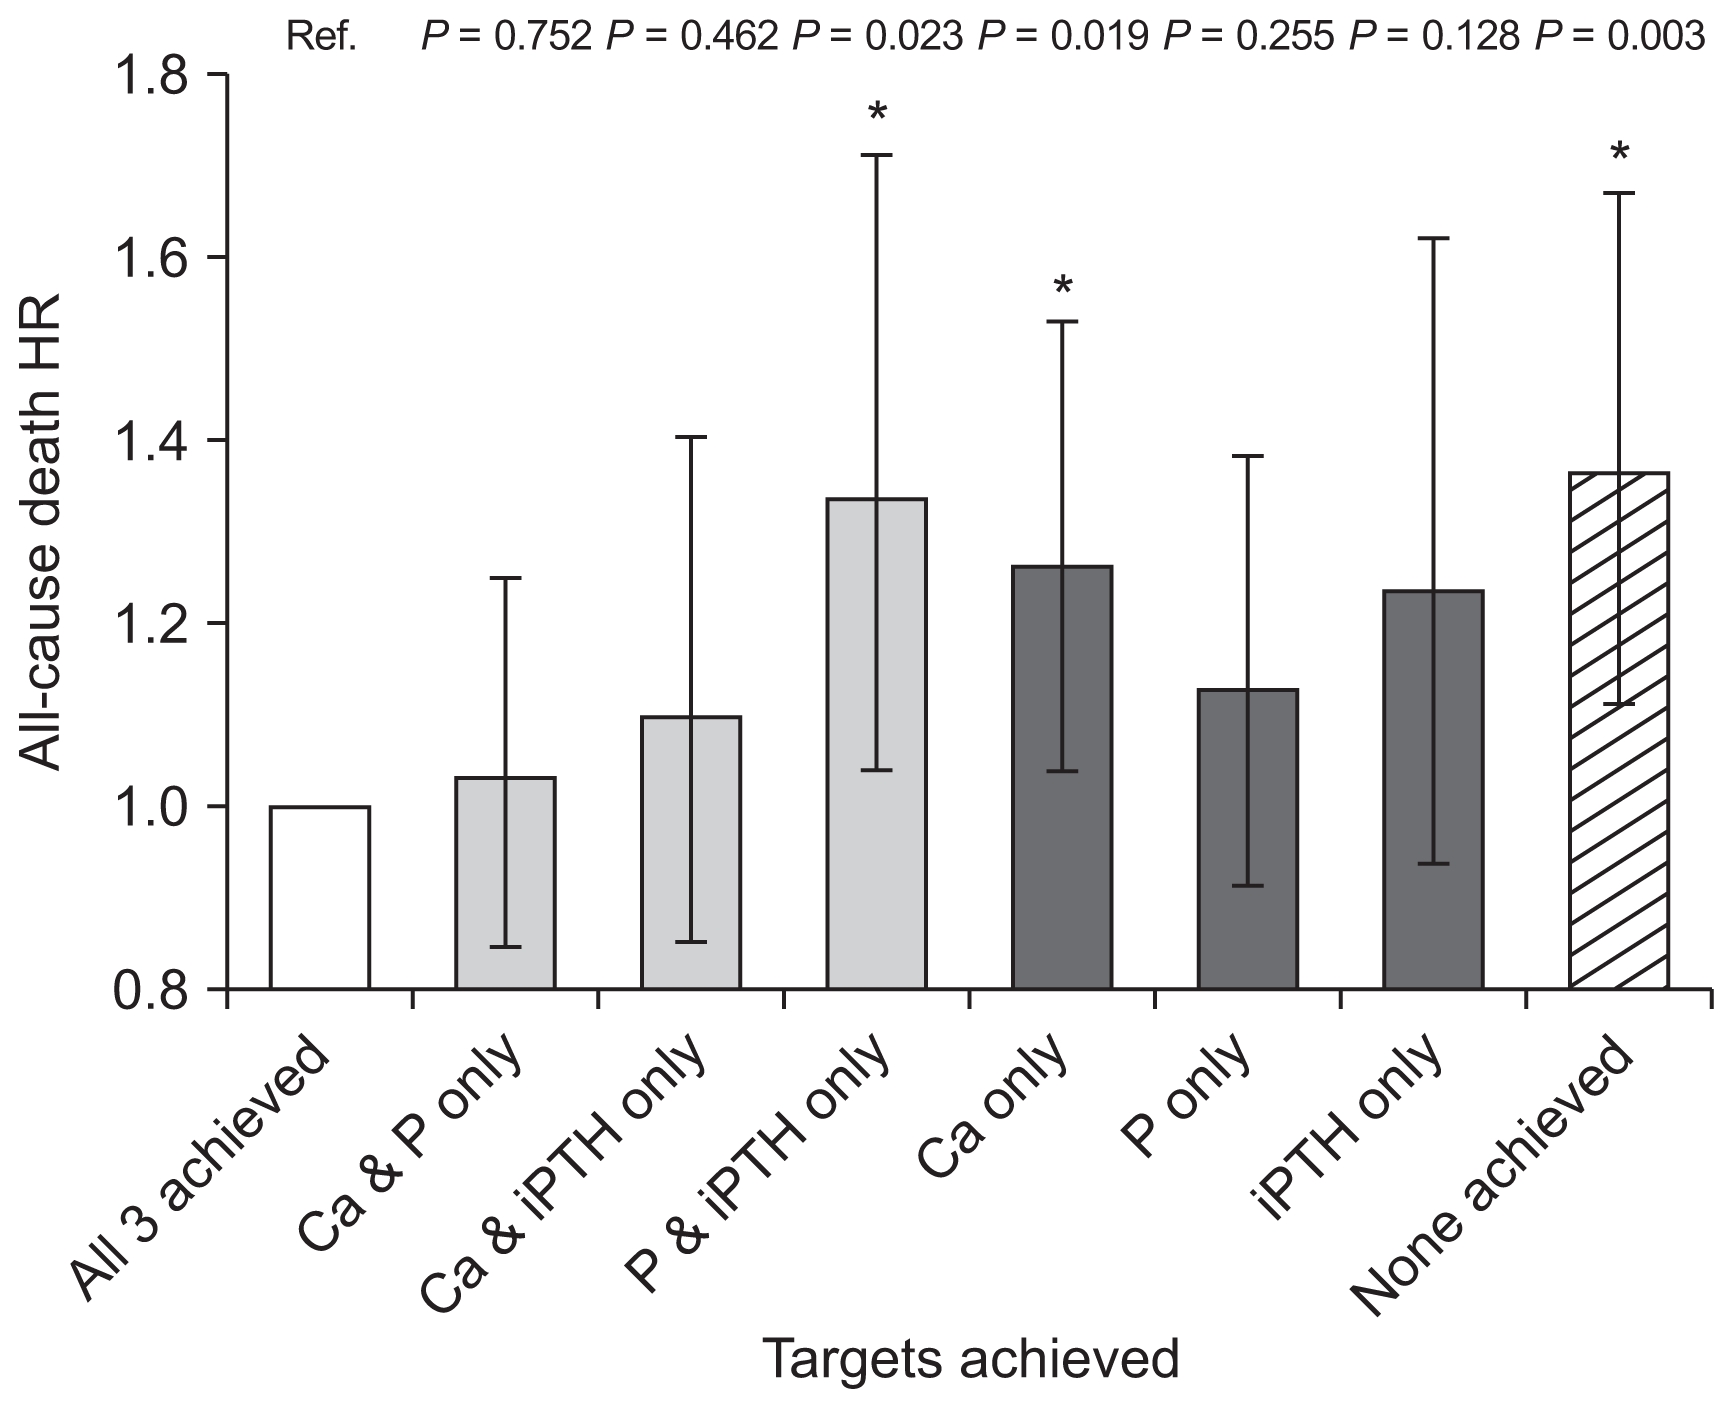
Hazard ratios (HRs) of all-cause death according to number of achieved targets by Kidney Disease Outcome Quality Initiative guidelines using Cox proportional hazard model
Analyses adjusted for sex, age, dialysis vintage, renal failure etiology, cardiovascular disease history, body mass index, single-pool Kt/V, hemoglobin, serum albumin, corrected calcium (Ca), phosphorus (P), and intact parathyroid hormone (iPTH). Error bars denote 95% confidence interval.
Ref., reference. *P < 0.05.
In analysis of mortality according to separate achievement of Ca, P, and iPTH targets, among the three parameters, Ca had the greatest increase in HR between the target-achieved and non-achieved groups (HR, 1.209; 95% CI, 1.099–1.330; P < 0.001). The group that did not achieve P target was independently associated with increased mortality (HR, 1.160; 95% CI, 1.055–1.274; P = 0.002), while iPTH did not show a significant difference in the comparison (HR, 1.029; 95% CI, 0.922–1.148; P = 0.615).
Using targets for serum Ca and P from the KDOQI guideline, we classified patients into 9 groups of below, within, or above target range for each parameter. All-cause mortality was analyzed by a Cox model, using the group that met both Ca and P targets as the reference (Fig. 3). Patients in groups with above-target Ca level exhibited significantly higher HR throughout all three P categories. The highest HR was seen in the group with above-target Ca level and below-target P level (HR, 2.112; 95% CI, 1.741–2.561; P < 0.001).

All-cause mortality according to combination of serum corrected calcium (Ca) and phosphorus (P) ranges using Cox proportional hazard model
Nine groups were classified according to target calcium and phosphorus ranges by the Kidney Disease Outcome Quality Initiative guidelines. Adjustments were for sex, age, dialysis vintage, renal failure etiology, cardiovascular disease history, body mass index, single-pool Kt/V, hemoglobin, serum albumin, and intact parathyroid hormone.
HR, hazard ratio; R, reference. *P < 0.05.
Subgroup analysis
To evaluate the influence of nutritional status on the results, we subdivided the study population by serum albumin level of 3.8 g/dL, which was one of the criteria for nutritional intervention for protein energy wasting from the International Society of Renal Nutrition and Metabolism [16]. The risk of all-cause mortality was significantly increased in the highest Ca quintile compared with the third quintile in the low albumin group (HR, 1.503; 95% CI, 1.231–1.835; P < 0.001), but not in the high albumin group (HR, 1.176; 95% CI, 0.939–1.474; P = 0.158) on adjusted Cox model (Supplementary Table 2). A significant increase in HR was observed for the lowest P quintile in the low albumin group (HR, 1.301; 95% CI, 1.081–1.567; P = 0.005), while no difference was observed in the high albumin group (HR, 1.032; 95% CI, 0.823–1.295; P = 0.782). The highest quintile of iPTH was associated with higher mortality in the high albumin group (HR, 1.350; 95% CI, 1.058–1.723; P = 0.016), but not the low albumin group (HR, 1.177; 95% CI, 0.931–1.488; P = 0.172).
Futher details on Supplementary materials are presented online (available at https://doi.org/10.23876/j.krcp.2018.37.3.266).
Discussion
To the best of our knowledge, this is the first study investigating the associations between serum mineral metabolism markers and mortality in Korean ESRD patients using a nationwide registry data. KSN has been managing a nationwide ESRD Registry via survey program since 1985. The registry includes 80,674 ESRD patients with 57,256 hemodialysis patients, 7,423 peritoneal dialysis patients, and 15,995 kidney transplantation patients in Korea as of 2014 [13]. The relationship between uric acid and mortality has been studied lately using these KSN Registry data [17]. We aimed to examine the risk of mortality with respect to serum levels of Ca, P, and iPTH in the Korean ESRD population as well as to evaluate direct application of current international guidelines to this population to be appropriate. The KSN ESRD Registry began collecting data on serum Ca, P, and iPTH levels in 2012. Therefore, only patients registered after March 2012, rather than the total hemodialysis population in the Registry, were included in analysis.
The risk of hypercalcemia was notable in this study. The HR for death increased linearly with increased serum corrected Ca quintile (Table 4). The increase in HR in the target non-achieved group compared with the target achieved group was the greatest for Ca among the three parameters (Table 5). This result was in accordance with accumulating evidence about the risk of hypercalcemia. Recent large-scale research in the United States [18] and Europe [6] showed that risk of hypercalcemia had greater mortality risks than hypocalcemia. In studies conducted in Japan, mortality risk increased with increased serum Ca with a linear pattern, similar to our results [10,19]. Updated Kidney Disease: Improving Global Outcomes (KDIGO) guideline recommends avoiding hypercalcemia and permitting mild hypocalcemia without symptoms, emphasizing the risks of hypercalcemia. The guideline also suggests restricting Ca-based phosphate binders and avoiding inappropriate Ca loading [2]. Moe et al [20] reported that positive Ca balance could lead to vascular calcification, regardless of serum Ca level. According to Korea National Health and Nutrition Examination Survey VI data, proportion of dietary Ca intake in Koreans to the Dietary Reference Intakes for Koreans (KDRIs) was only 69.7% in 2015 [21]. Considering that dietary intake of Ca is relatively low, restriction of Ca-based phosphate binders may effectively reduce positive Ca balance in the Korean ESRD population.
Interestingly, while increased mortality in the lowest P group was significant, no mortality increase was seen for high P level (Table 4). Serum albumin increased with increased serum P (P for trend < 0.001). As shown in subgroup analysis (Supplementary Table 2), the detrimental effect of hypophosphatemia was exaggerated in the low albumin group, with no significant differences among P quintiles in the high albumin group. This result might suggest that the effects of nutritional factors powerful to counteract the effects of P. Shinaberger et al [22] reported that improvement of nPNA as a nutritional index had a greater effect on survival than did improvement of hyper-phosphatemia. Fukuma et al [23] also demonstrated that the Geriatric Nutritional Risk Index had a greater impact on mortality than did serum P. Our results could have been influenced by not distinguishing between temporary and sustained increases in P because we excluded time factors in our analysis. The revised KDIGO guideline recommends phosphate-lowering treatment only when serum P level is “progressively or persistently” elevated, in contrast with a previous early “preventive” treatment strategy [1,2].
Analysis of the relationship between target achievement and mortality showed the importance of considering Ca, P, and iPTH together along with a primary concern to avoid hypercalcemia (Table 5). The results of this study, which show an association between hypercalcemia and higher mortality and a lack of association between hyperphosphatemia and increased mortality, support the main context of treatment strategy in the 2017 updated KDIGO guideline. However, applying this guideline to clinical practice in Korea has challenges. Medication of first choice is limited by the National Health Insurance Service to Ca-based phosphate binders for mild-to-moderate hyperphosphatemia and to vitamin D analogs for secondary hyperparathyroidism. The price of non-Ca-based phosphate binders is much higher than the price of Ca-based phosphate binders. However, Cho et al [24] analyzed the cost-effectiveness of sevelamer versus calcium acetate and assessed that sevelamer could be a cost-effective alternative, even with its higher cost, by improving survival.
This study had several limitations. First, analyzed data were confined to several recent years of the registry because information on the serum levels of mineral parameters was not collected in the KSN ESRD Registry before 2012. Second, because the KSN ESRD Registry is based on voluntary updates of patient information, mostly on a yearly basis by individual dialysis units, cases of death might have been underreported and misprocessed as loss to follow-up. Third, our analysis was based on a single measurement of serum mineral parameters at enrollment. Hence, we were unable to determine the effect of change over time or long-term exposure of serum mineral markers on mortality. Fourth, we could not determine the causality between the serum mineral levels and treatment.
We analyzed the associations between serum markers related to mineral metabolism and clinical outcomes of Korean hemodialysis patients using a nationwide registry. In managing CKD-MBD, we need to avoid hypercalcemia and hypophosphatemia as well as to control Ca, P, and iPTH together. Further study is required to better understand the traits of CKD-MBD in Korean populations such as analyses using time-dependent or time-average models or analysis to evaluate the effects of various treatments.
Supplementary Data
Acknowledgments
We would like to express our gratitude to the KSN ESRD Registry Committee, which provided the valuable registry data for this research.
Notes
Conflicts of interest
All authors have no conflicts of interest to declare.