Long-term prognosis of BK virus-associated nephropathy in kidney transplant recipients
Article information
Abstract
Background
The long-term prognosis of BK virus-associated nephropathy (BKVAN) in kidney transplant recipients (KTRs) is uncertain. We evaluated the long-term prognosis in KTRs with BKVAN and the clinical significance of BKVAN on post-transplant clinical outcome.
Methods
We retrospectively analyzed the medical records of 582 patients who underwent kidney transplant (KT) between 2001 and 2014. We divided the patients into a BKVAN group (15 patients) diagnosed by allograft biopsy and a control group (356 patients).
Results
The incidence of BKVAN was 4.0%, and the mean follow-up duration was 93.1 ± 52.3 months. Median time from KT to BKVAN diagnosis was 5.9 months (interquartile range [IQR], 4.4–8.7). In the BKVAN group, 9 (60.0%) KTRs with combined acute rejection progressed to graft failure, and the median time from BKVAN diagnosis to graft failure was 36.2 months (IQR, 9.7–65.5). Death-censored graft survival rate and patient survival rate in the BKVAN group were significantly lower than those in the control group. BKVAN and rejection were independent risk factors for graft failure. In the subgroup analysis, death-censored graft survival rate of KTRs with BKVAN with acute rejection was significantly worst in comparison with similar patients without BKVAN regardless of acute rejection (P < 0.001).
Conclusion
The long-term prognosis of BKVAN with acute rejection was very poor because of graft failure caused by inadequate treatment for acute rejection considering BKVAN. Therefore, we should carefully monitor the allograft status of KTRs through regular surveillance tests after treatment for BKVAN with acute rejection.
Introduction
BK virus-associated nephropathy (BKVAN) is an important factor for allograft kidney prognosis in kidney transplant recipients (KTRs) [1,2]. One research study reported that the mean rate of graft loss by BKVAN was 46.2% [3]. There are a number of different prevalence and prognostic factors of BKVAN because each center has variable immunosuppressant protocols [3,4]. It is well known, based on many studies on BKVAN in kidney transplantation (KT), that the short-term prognosis of patients with BKVAN is good [5], but the long-term prognosis is still uncertain.
The purpose of this study is to present the long-term prognosis and risk factors of graft failure in KTRs with BKVAN.
Methods
Study design
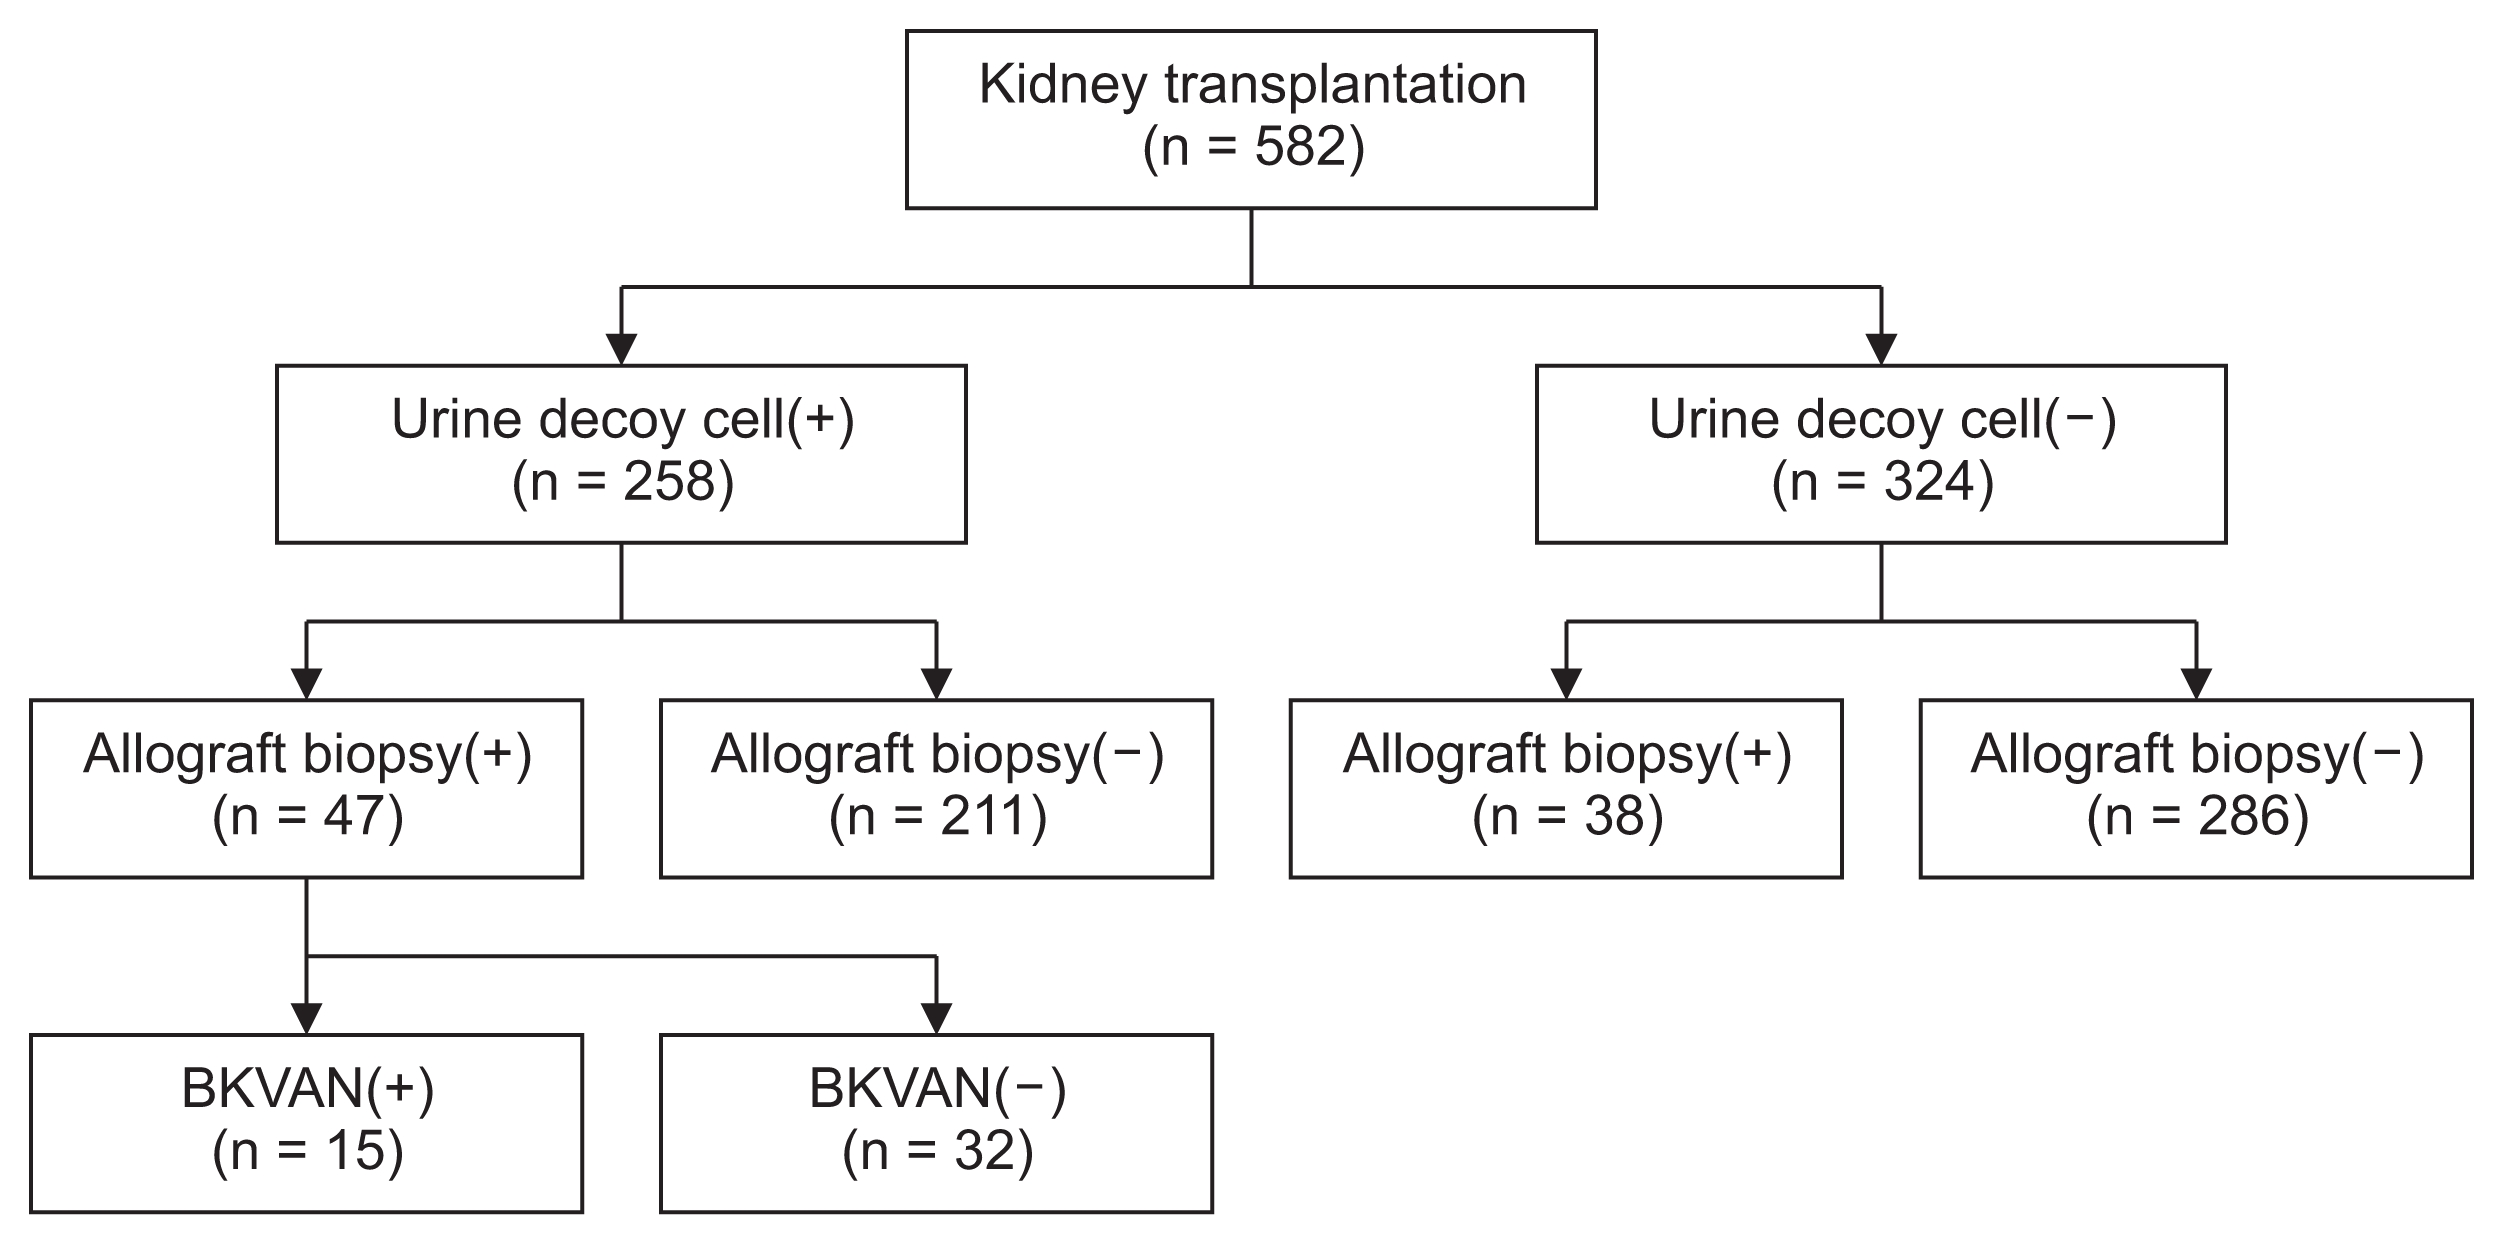
We retrospectively investigated the medical records of 582 patients that underwent KT between June 2001 and December 2014. We checked urine decoy cells to screen for BK virus infection every month for 12 months after KT and checked it regularly every year thereafter. Among 582 KTRs, 258 patients had urinary decoy cells and 324 patients did not. Allograft biopsies were performed when a positive urine decoy cell was detected [6] and allograft dysfunction or proteinuria occurred [7]. BKVAN was diagnosed by the pathologic confirmation of allograft biopsies and classified into stages A, B, and C according to Banff criteria 2009 [8]. “Class A” was defined as a variable number of virus-infected cells with no or minimal injury to tubular epithelial cells, “class B” was defined as tubular epithelial cell necrosis or lysis with denudation of the basement membrane across a length of more than 2 cells, and “class C” was defined as any degree of tubular injury with interstitial fibrosis that affected more than 50% of the cortex. Among 258 KTRs with positive urinary decoy cells, allograft kidney biopsy was performed in 47 patients, and 15 KTRs were diagnosed with BKVAN based on allograft biopsy indications. Because the urine decoy cell test had a 100% negative predictive value [9], we divided the diagnoses into a BKVAN group (15 patients) diagnosed by allograft kidney biopsies and a control group (356 patients), with the exception of 211 patients that did not undergo allograft biopsies with urine decoy cells (Fig. 1). Allograft function was measured as serum creatinine by the Jaffe method and an estimated glomerular filtration rate (eGFR) by the Modification of Diet in Renal Disease (MDRD) formula before the diagnosis, at the time of diagnosis, and 12 months after the diagnosis of BKVAN [10]. Allograft dysfunction was defined as an increase of more than 30% of serum creatinine level or decrease of more than 50% of eGFR compared to baseline allograft function. Acute rejection was classified as borderline, cellular rejection, and antibody-mediated rejection through the allograft kidney biopsies. Graft failure was defined as a return to dialysis or re-transplantation. The treatment options varied; discontinuation or reduction of mycophenolate mofetil (MMF) and reduction or substitution of tacrolimus with cyclosporine in addition to sirolimus, leflunomide, or fluoroquinolone were performed to treat BKVAN. We performed follow-up allograft kidney biopsies at two months after treatment of BKVAN with acute rejection.
Patient algorithm and distribution in this study
Kidney transplant recipients were divided into two groups according to the positive urine decoy cells. In addition, each group was subdivided into two groups according to the presence or absence of allograft biopsy, and the groups with BK virus associated nephropathy and without BK virus-associated nephropathy (BKVAN).
In the subgroup analysis, we divided the KTRs who underwent allograft kidney biopsies into four groups as follows: With or without BKVAN and with or without acute rejection. We evaluated the long-term outcomes of BK-VAN and the clinical significance of BKVAN on the post-transplant clinical outcomes.
This study was approved by the Institutional Review Board of Keimyung University School of Medicine (2016-11-047).
Statistical analyses
We analyzed the data using Student’s t test or Mann–Whitney test for continuous variables and the chi-sqaure test and Fisher’s exact test for categorical variables. Continuous variables were presented as means ± standard deviations or medians (interquartile ranges [IQRs]) and categorical variables as numbers and proportions (%). P values < 0.05 were considered statistically significant. Statistical analysis was performed using PASW Statistics ver. 18.0 (IBM Co., Armonk, NY, USA).
Results
Baseline characteristics of BK virus-associated nephropathy
The incidence of BKVAN was 4.0% (15 of 371 KTRs) during the study period. Follow-up duration was 93.1 ± 52.3 months. The median time from KT to BKVAN diagnosis was 5.9 (IQR, 4.4–8.7) months, and the follow-up duration after BKVAN diagnosis was 58.5 (IQR, 32.2–123.4) months. The median (IQR) age of the KTRs at BKVAN diagnosis was 50 (40–53) years, and 13 (86.7%) were men. Six patients (40.0%) underwent living donor KTs, and 14 (93.3%) patients experienced their first KT. Eleven patients (73.3%) received hemodialysis before KT, and 11 (73.3%) had chronic glomerulonephritis as a cause of end-stage renal disease. Tacrolimus was used in all patients, and the median (IQR) trough level of tacrolimus was 9.1 (5.9–12.2) ng/mL at diagnosis of BKVAN. Ten patients (66.7%) had biopsy-proven acute rejection. The median (IQR) serum creatinine level and eGFR at diagnosis were 2.3 (2.0–3.0) mg/dL and 29.2 (20.3–35.3) mL/min/1.73 m2, respectively. According to the Banff 2009 Working Proposal, 6 (40.0%) patients were stratified as stage A, 8 (53.3%) as stage B, and 1 (6.7%) as stage C.
Comparison of baseline characteristics between BKVAN group and control group
We compared the clinical and laboratory parameters between the BKVAN group and control group (Table 1). The proportion of male recipients was significantly higher in the BKVAN group compared with the control group (86.7% vs. 55.6%, P = 0.017). The mean age of recipients in the BKVAN group tended to be older than in the control group (47.9 ± 9.1 vs. 42.4 ± 11.7, P = 0.074). The mean age of kidney donors was significantly higher in the BK-VAN group compared with the control group (46.8 ± 5.6 vs. 39.7 ± 13.1, P < 0.001). The number of human leukocyte antigen (HLA) mismatches tended to be higher in the BKVAN group compared with the control group (4.3 ± 1.7 vs. 3.3 ± 1.6, P = 0.053). The proportion of antithymocyte globulin as an induction immunosuppressant was significantly higher in the BKVAN group compared with the control group (13.3% vs. 4.2%, P = 0.001). There were no significant differences in donor gender, donor type, KT number, dialysis type before KT, cause of end-stage renal disease, and immunosuppressant for maintenance.

Comparison of baseline characteristics between the BKVAN and control groups in kidney transplantation
Clinical outcome comparisons between the BKVAN group and control group
The proportion of biopsy-proven acute rejection was significantly higher in the BKVAN group compared with the control group (66.7% vs. 12.1%, P < 0.001). There was no significant difference in follow-up duration between the two groups. In Kaplan-Meier analysis, death-censored graft survival rate in the BKVAN group was significantly lower than that in the control group (P < 0.001) (Fig. 2A). For cases of graft failure, the proportion of acute and chronic rejection was significantly higher in the BKVAN group compared with the control group, but the proportions of functioning allograft, recurrent glomerulonephritis, and infection were significantly lower in the BKVAN group compared with the control group (Table 2).
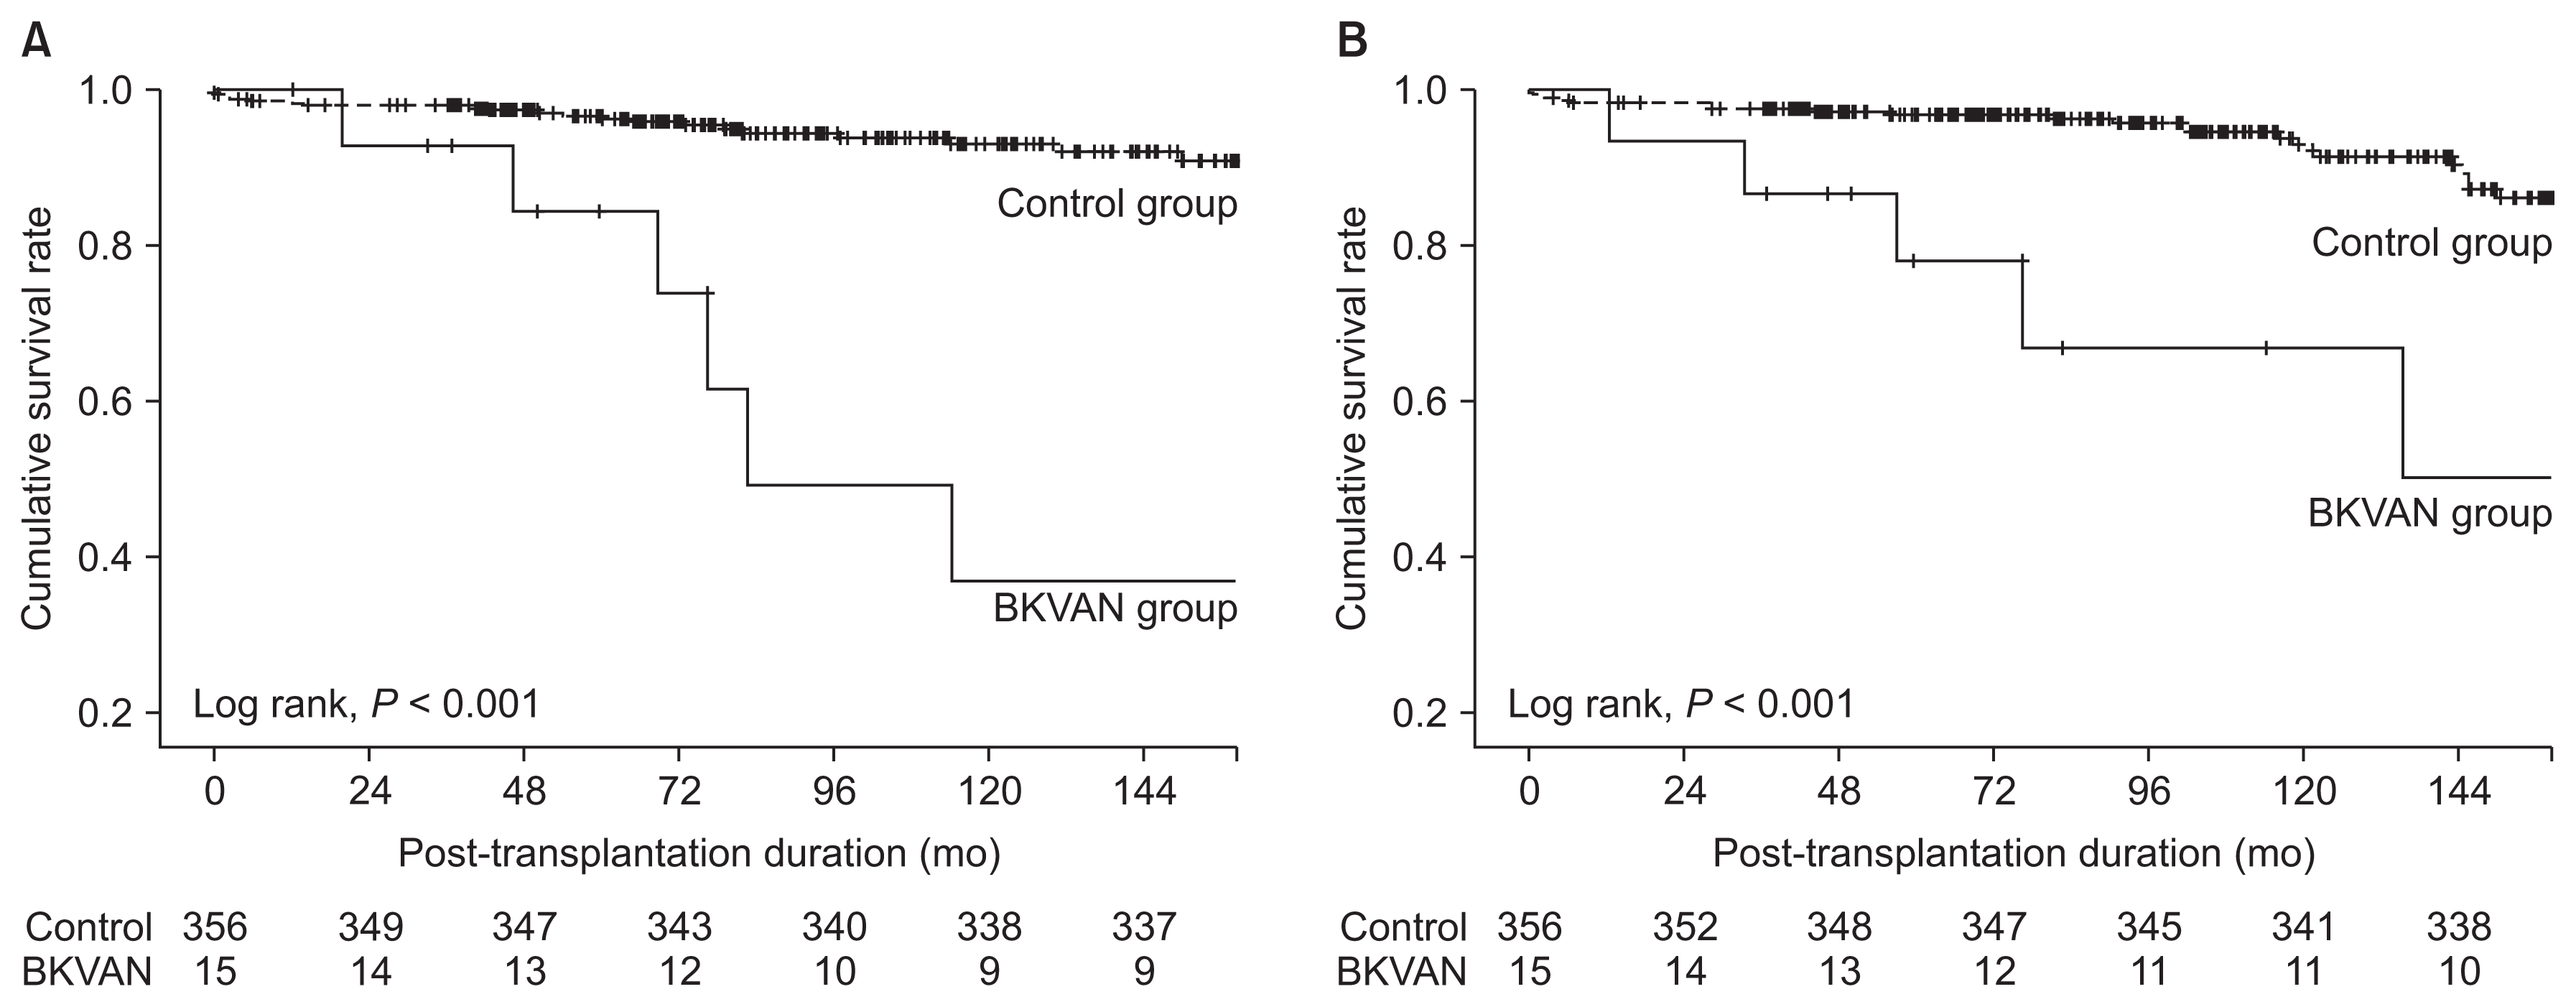
Comparison of (A) death-censored graft survival rate, and (B) patient survival rate between kidney transplant recipients with BK virus associated nephropathy and those without BK virus-associated nephropathy (BKVAN).

Comparison of clinical outcomes between the BKVAN and control groups in kidney transplantation
Patient survival rate in the BKVAN group was also significantly lower than that in the control group (P < 0.001) (Fig. 2B). Patient death analysis indicated that the proportions of cardiovascular disease and infection were higher in the BKVAN group, and those of cerebrovascular accident, hepatic failure, and malignancy were lower in the BKVAN group compared with the control group, but there were no significant differences between the two groups (Table 2).
In the Cox proportional hazard model, BKVAN and rejection were independent risk factors for graft failure after adjusting for recipient age, HLA mismatch number, antithymocyte induction, and deceased donor KT (Table 3).

Risk factors associated with graft failure in kidney transplantation (KT)
In the subgroup analysis, the death-censored graft survival rate of KTRs with BKVAN accompanying acute rejection was significantly worse in comparison with KTRs with BKVAN without acute rejection and without BKVAN, regardless of acute rejection (P < 0.001) (Fig. 3). In comparison with pathologic findings at diagnosis and at follow-up of BKVAN with acute rejection by allograft kidney biopsies, the “i” score and “t” score tended to increase, but these differences were not statistically significant (Table 4).
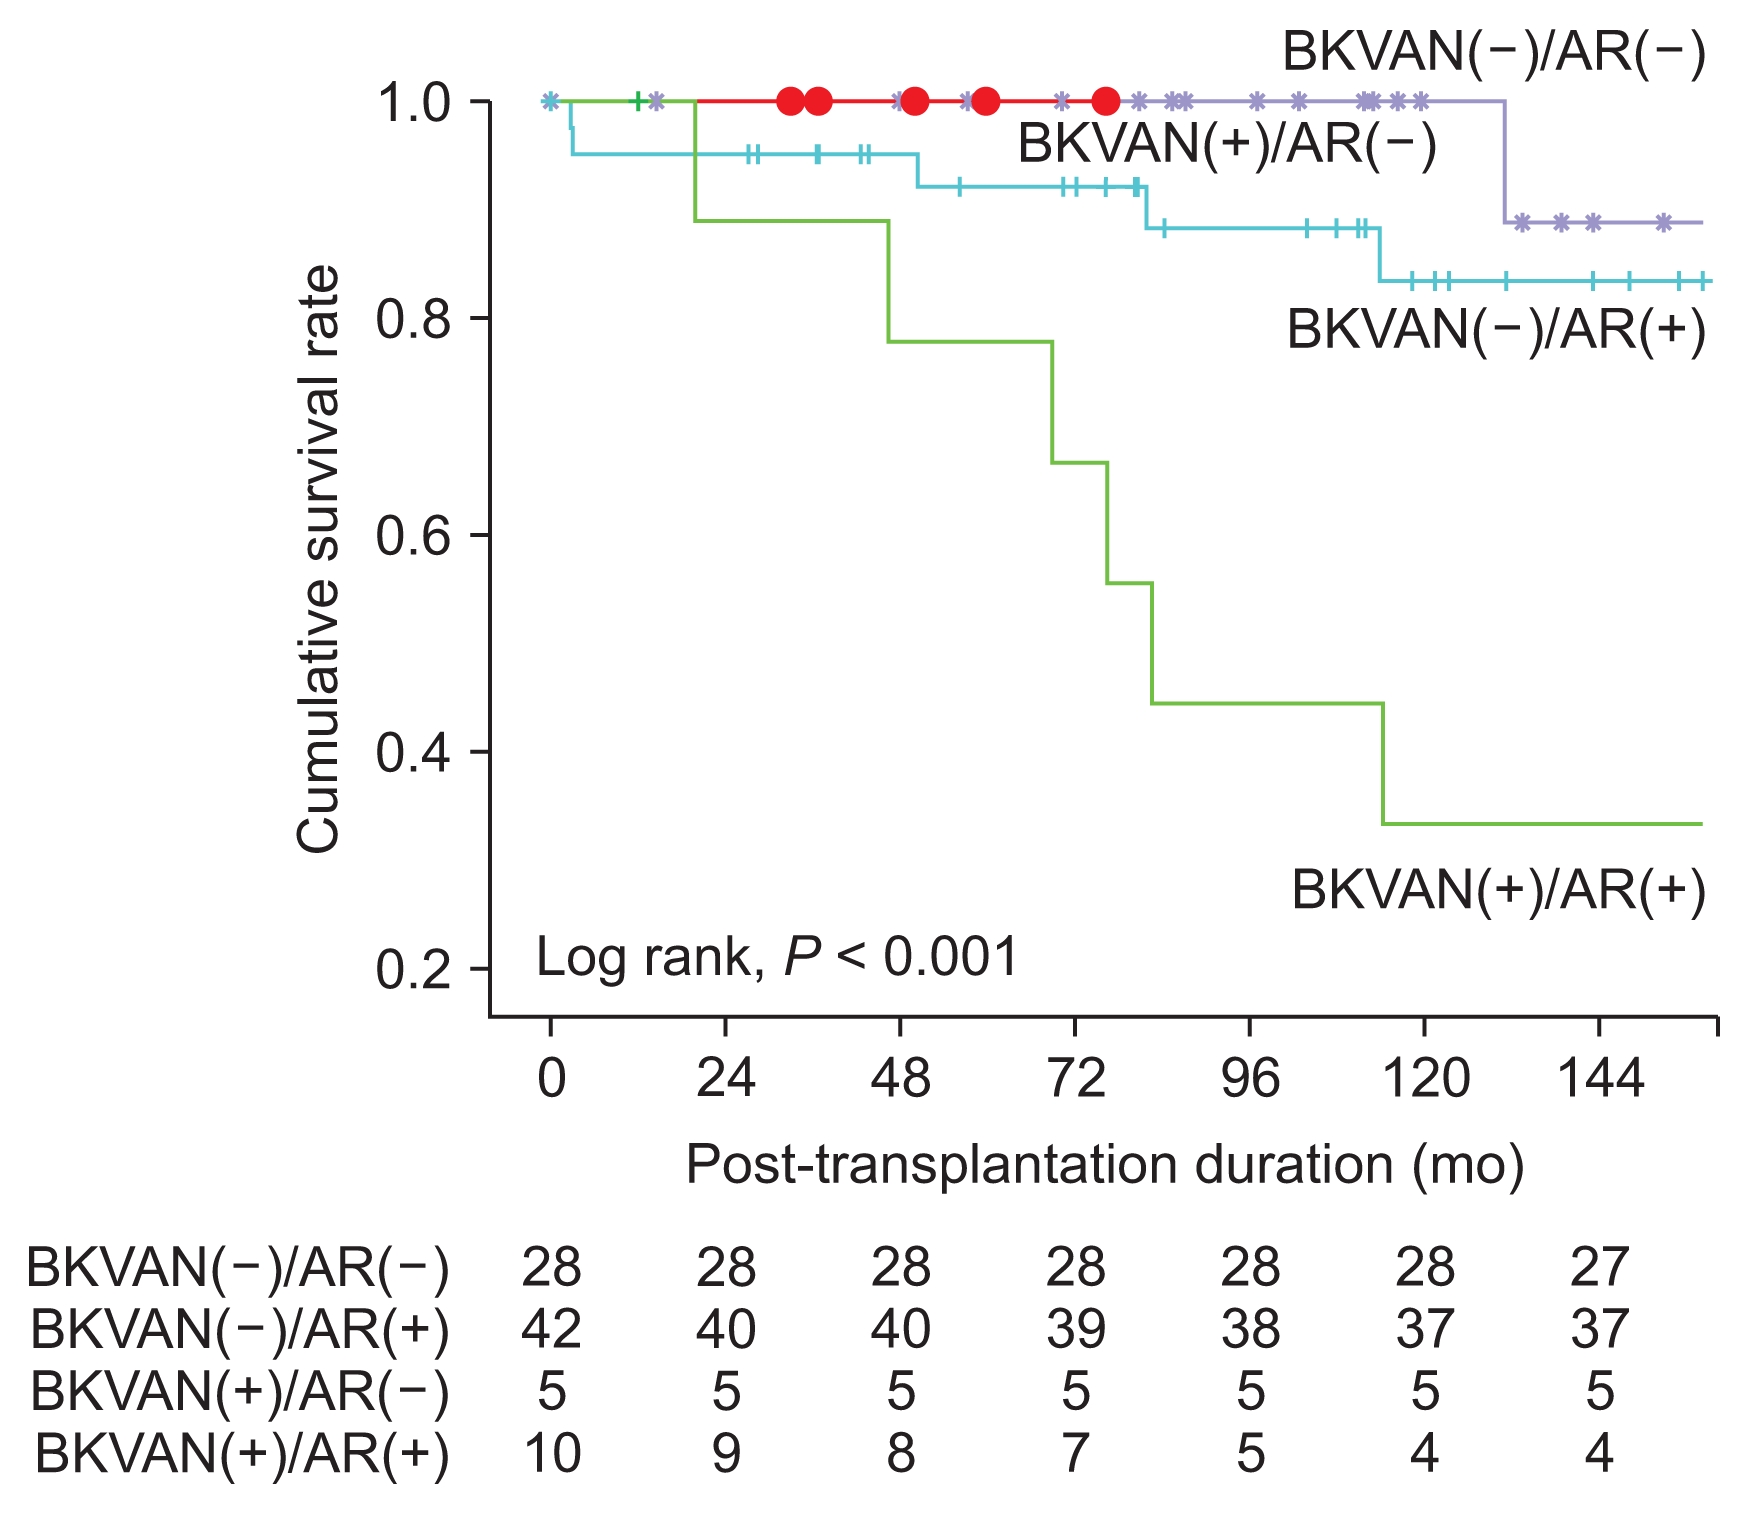
Comparison of the death-censored graft survival rate among the kidney transplant recipients with or without BK virus-associated nephropathy (BKVAN) or acute rejection, respectively.

Comparison of pathologic findings between at diagnosis and at follow-up for BK virus associated nephropathy with acute rejection by allograft kidney biopsies
Discussion
The rate of allograft loss in our center was higher than the above-mentioned average (66.7% vs. 46.2%). Short-term graft survival was good, but long-term graft survival was poor during the follow-up period (100% at 1 year, 92.9% at 3 years, 84.4% at 5 years, and 36.9% at 10 years). In particular, BKVAN patients with acute rejection had worse prognoses. BKVAN patients with acute rejection might progress to late graft failure without recovery of allograft dysfunction due to uncontrolled rejection. The prognosis of BKVAN was poor when the pathologic stage was more progressive [8], serum creatinine level was increased at diagnosis, or acute rejection occurred [11]. Because pathologic stage was directly associated with prognosis of BKVAN, early detection of BKVAN is very important before changes in pathologic findings [8]. However, in our study, there were no significant differences according to pathologic stage or allograft function when BKVAN was diagnosed, unlike the results of other studies. It is possible that this difference could be attributable to the small number of BKVAN patients.
In most cases of BKVAN with acute rejection, acute rejection was first treated by steroid pulse therapy. Because the pathologic findings of the patients with acute rejection showed acute cellular rejection, we also performed steroid pulse therapy, similar to other studies [5]. MMF was discontinued in most patients after steroid pulse therapy. Tacrolimus was either reduced or replaced with cyclosporine. Sirolimus was added when the dosage of tacrolimus was reduced [3]. Two out of the 3 patients taking sirolimus maintained a stable renal function. In our study, 9 of the 10 BKVAN cases were accompanied by acute rejection, and all progressed to graft failure. One patient without acute rejection consistently used MMF without dosage reduction. BKVAN with acute rejection was associated with poor prognosis. One of the 5 patients with BKVAN in the non-graft failure group had acute rejection; tacrolimus was replaced with cyclosporine after steroid pulse therapy, and allograft function was stable.
In our study, the proportion of male recipients was significantly higher in the BKVAN group compared with the control group, and recipient age in the BKVAN group tended to be older than in the control group. The results were consistent with other studies [9]. The number of HLA mismatches tended to be higher in the BKVAN group compared with the control group, and the proportion of antithymocyte globulin as an induction immunosuppressant was significantly higher in the BKVAN group compared with the control group. These results were also consistent with other studies [9]. It is known that deceased donors, recipients over 50 years of age, and recipients with diabetes mellitus are risk factors for BKVAN; in our study, there were no significant differences between BKVAN and control groups [9]. However, incidence of acute rejection was significantly higher in the BKVAN group compared with the control group.
During a 10-year follow-up period, the prognosis of BKVAN was poor compared to the control group. The 10-year graft survival rate in the BKVAN group was 36.9%, and that in the control group was 93.1%. The 10-year patient survival rate in the BKVAN group was 66.9%, and that in the control group was 92.9%. Rejection was the most common cause of graft failure and infection was the most common cause of patient death in both groups.
In the subgroup analysis, we divided the KTRs who underwent allograft kidney biopsies into four groups as follows: Those with or without BKVAN and with or without acute rejection. Fig. 3 shows that death-censored graft survival rate in the group without BKVAN and with acute rejection was lower in comparison with the group with BKVAN and without acute rejection. In general, the risk of graft failure in BKVAN is high; however, in our study, there were few cases of graft failure in the group with BKVAN and without acute rejection, and the incidence of graft failure due to uncontrolled acute rejection in the group without BKVAN and with acute rejection was high. This result could be attributable to the small size of the BKVAN group. Death-censored graft survival rate of KTRs with BKVAN accompanying acute rejection was significantly worse in comparison with KTRs with BKVAN without acute rejection and without BKVAN, regardless of acute rejection. In the case of BKVAN with acute rejection, follow-up biopsy was performed to show the therapeutic effect, since the patients were not able to undergo more aggressive anti-rejection treatment, except steroid pulse therapy. Most pathologic findings showed that acute rejection deteriorated after treatment. Therefore, the reasons for the poor prognoses might be graft failure due to inadequate anti-rejection treatment for acute rejection that accompanied BKVAN.
There were some limitations to this study. First, our study has a retrospective design, and there is a high possibility of selection bias. Second, the sample size of our study was too small to clearly demonstrate any impact of BKVAN on clinical outcome; therefore, additional large-scale studies are needed. Third, we did not perform allograft kidney biopsies in 211 of the 258 patients with positive urine decoy cells, because we performed biopsies in cases of allograft dysfunction or proteinuria in positive urine decoy cells. Therefore, we excluded the 211 patients in our study because we could not predict the presence of BKVAN. It is possible that there would have been more patients who had BKVAN because allograft function could be improved by reduction or change of immunosuppressants without allograft biopsies. Therefore, well-designed screening protocols to diagnose BKVAN are needed. Fourth, we did not perform allograft kidney biopsies for all patients who were treated with BKVAN and only performed them in cases of BKVAN with acute rejection. When allograft dysfunction was consistent, we could not determine whether the BKVAN was uncontrolled or the treatment for acute rejection was not completed. Finally, surveillance tests, such as plasma or urine BKV DNA PCR, were not regularly performed in all patients with BKVAN.
In conclusion, the long-term prognosis of BKVAN with acute rejection was very poor because of graft failure caused by inadequate treatment for acute rejection, considering BKVAN. Therefore, we should carefully monitor the allograft status of KTRs through regular surveillance tests after treatment with BKVAN with acute rejection.
Notes
Conflicts of interest
All authors have no conflicts of interest to declare.