


Introduction
Peritoneal dialysis (PD) is a widely accepted renal replacement therapy for end-stage renal disease (ESRD) [1]. The number of patients undergoing PD treatment in the world population was estimated as 272,000 at the end of 2013. PD is a dialysis modality that permits patients to lead a higher quality life [2]. It is well-established that PD is stopped due to its technique failure [3,4]. Technique failure is an important metric to track and understand in patients with PD [5]. Technique failure can be utilized as an indicator of the quality of PD care in dialysis programs [5].
After PD technique failure, patients require a switch to hemodialysis (HD). Thus, this need must be taken in to consideration in patients starting PD. Switching from PD to HD is undesirable due to complications from temporary vascular access, disruption of daily routine, and higher costs. Since unplanned HD initiation is associated with mortality, the transition period between dialysis modalities must be predicted and planned [3]. Reasons of technique failure include; infectious complications (e.g., PD peritonitis), mechanical complications (e.g., primary catheter failure), inadequate solute clearance, ultrafiltration failure, and psychosocial issues [5]. It has also been revealed in previous studies that reasons for technique failure appear to evolve over time [5].
The serum albumin level is usually utilized as an indicator to assess nutritional status [6]. In patients on PD, the initial serum albumin levels are closely associated with cardiovascular mortality, PD technique survival and peritonitis rate [7]. Majority of previous studies have examined the effect of initial serum albumin on PD technique failure. There are few studies examining the effect of change and trend in albumin level on PD technique failure. It is essential to access the relationship between the trajectories of serum albumin and PD technique failure. Classical models such as the linear mixed model and the Cox proportional hazards model for longitudinal and time-to-event data respectively, do not consider dependencies between these two different types of data. Joint modeling of longitudinal and time to event data is a powerful method that takes into account the dependency and association between them. Using joint models, these two types of data are analyzed simultaneously [8].
The major cause of ESRD worldwide is diabetic nephropathy. The diabetes is frequently associated with multiple complications [9]. It is also one of the most essential predictors for PD technique failure [5].
In the present study, we developed the joint modeling of longitudinal and time-to-event data in order to determine the relationship between the trajectories of serum albumin levels and the PD technique failure in patients of ESRD according to diabetic status. Death from all causes during follow-up was considered as competing event. Our models also assess covariates effects on both outcomes (trajectories of serum albumin and the PD technique failure or death) simultaneously. The parameters were estimated using a Bayesian approach. The advantage of a Bayesian analysis is that it provides reasonable results, when compared to maximum likelihood approach. Furthermore, specifying a prior distribution for the parameters gives the investigator an opportunity to incorporate any existing information into the model. In addition, it can easily be performed using available software [10].
Methods
This retrospective cohort study comprised 300 ESRD patients on continuous ambulatory PD (CAPD; 189 non-diabetic and 111 diabetic) treated in Al-Zahra Hospital, Isfahan, Iran, from May 2005 to March 2015. Patients having at least 3 months on PD were selected. During the treatment period of PD, patients were evaluated approximately every three months from starting PD therapy by nephrologists and nurses at the PD clinic.
Definition of outcomes
In this study, the longitudinal outcome of interest was serum albumin levels (g/dL) measurements at different times that correspond to visiting times (approximately every 3 months) for each PD patient. Another outcome of interest was time to occurrence of the PD failure which was calculated as the number of days between dialysis initiation and the end date. The PD failure was defined as a transfer to HD. Death from all causes during follow-up on CAPD was considered as competing event. Patients were censored at the last information date if they experienced kidney transplantation during follow-up, or had not presented any of these events (death, kidney transplantation and transfer to HD) by March 2015.
Covariates
Covariates including age at PD initiation (year), gender, previous HD, body mass index (BMI, kg/m2), normalized protein catabolic ratio (nPCR, g/kg/day) and cardiovascular disease. Data were collected by medical records review.
Statistical analysis
Continuous variables were described by mean and standard error while categorical variables were described by frequencies and percentages. The differences of continuous and categorical variables between the two groups (diabetic and non-diabetic patients) were analyzed using the StudentŌĆÖs t-test and chi-squared test, respectively. Survival curves were constructed by the Kaplan-Meier method and compared by the log-rank test. The level of statistical significance was set at P < 0.05.
In this study, we consider a class of shared parameter models proposed by Follmann and Wu [11] for jointly modeling serial data and event time data. Using this approach, the association between trajectories of serum albumin and time to competing risks was considered through shared random-effects. Joint models of longitudinal and time to event data comprises of three submodels: The first one consists of a linear mixed model for the trajectories of serum albumin levels. Suppose that for patient i (i = 1, 2, ..., n) at time point tij (j = 1, 2, ..., ni), that n and ni are number of patients and visits of patient i, respectively, the linear mixed model has the structure:
Where ╬▓ŌĆÖs are parameters to reflect the effects of the covariates (intercept, time on CAPD, age, gender, previous HD, BMI, nPCR and cardiovascular disease). The quantity eij is a random error term and is assumed to be normally distributed. bi, is a patient-specific random effect that represents between-patient heterogeneity in an outcome variable (serum albumin level) that cannot be explained by measured covariates. The submodels of second and third consist of the parametric survival models of Weibull. We graphically [12] and based on deviance information criteria (DIC) [13] preferred a parametric model of Weibull to Cox regression model. In the Weibull regression method, coefficients can be interpreted exactly the same way as those of the Cox model. In this method, the underlying hazard is more simply expressed with assuming Weibull distribution for the time to event data [14].
The hazard functions of the survival models at time t can be written as:
Where hi,h(t) and hi,d(t) are the hazard of PD failure and death from all causes for the patient i at time t, respectively, hi0,h and hi0,d are baseline hazard functions with weibull distribution, ╬▓ŌĆÖs are parameters for the effects of covariates, ╬▒1 and ╬▒2 are association parameters of serum albumin trajectories with PD failure and death from all causes, respectively. The longitudinal and survival submodels joined through shared random-effect of bi with normal distribution. The parameter estimation obtained using Bayesian approach. A parameter is significant at 5% only if the 95% Bayesian confidence interval (CI) is not included 0. We used the software package OpenBUGS (version 3.2.3) [15], was used in deriving the posterior distribution of the parameters through the Markov Chain Monte Carlo (MCMC) method. We also considered standard prior distribution for all parameters. R software package (version 3.2.2) was utilized for other analyses such as descriptive statistics, plots and tests of chi-squared, t-test and log rank. The packages of R and OpenBUGS are free software. Joint modeling approach was performed on non-diabetic, diabetic and all of CAPD patients in the study. In order to get more accurate estimation for association parameter, it was also performed on CAPD patients without history of previous HD.
Results
There were 300 patients on CAPD in the study, 63% were non-diabetic. Mean and standard error of age at PD initiation, baseline values albumin, BMI, and nPCR, and frequency (%) of gender, previous HD and cardiovascular disease according to diabetic status are shown in Table 1. Means of age and BMI for diabetic CAPD patients were higher than mean age for non-diabetics. This increase in means were significant using t-test analysis (P < 0.05). There were a greater proportion of men and patients with history of cardiovascular disease in diabetics group. Using chi-squared tests, the relationships between diabetic with gender and history of cardiovascular disease were significant (P < 0.05).
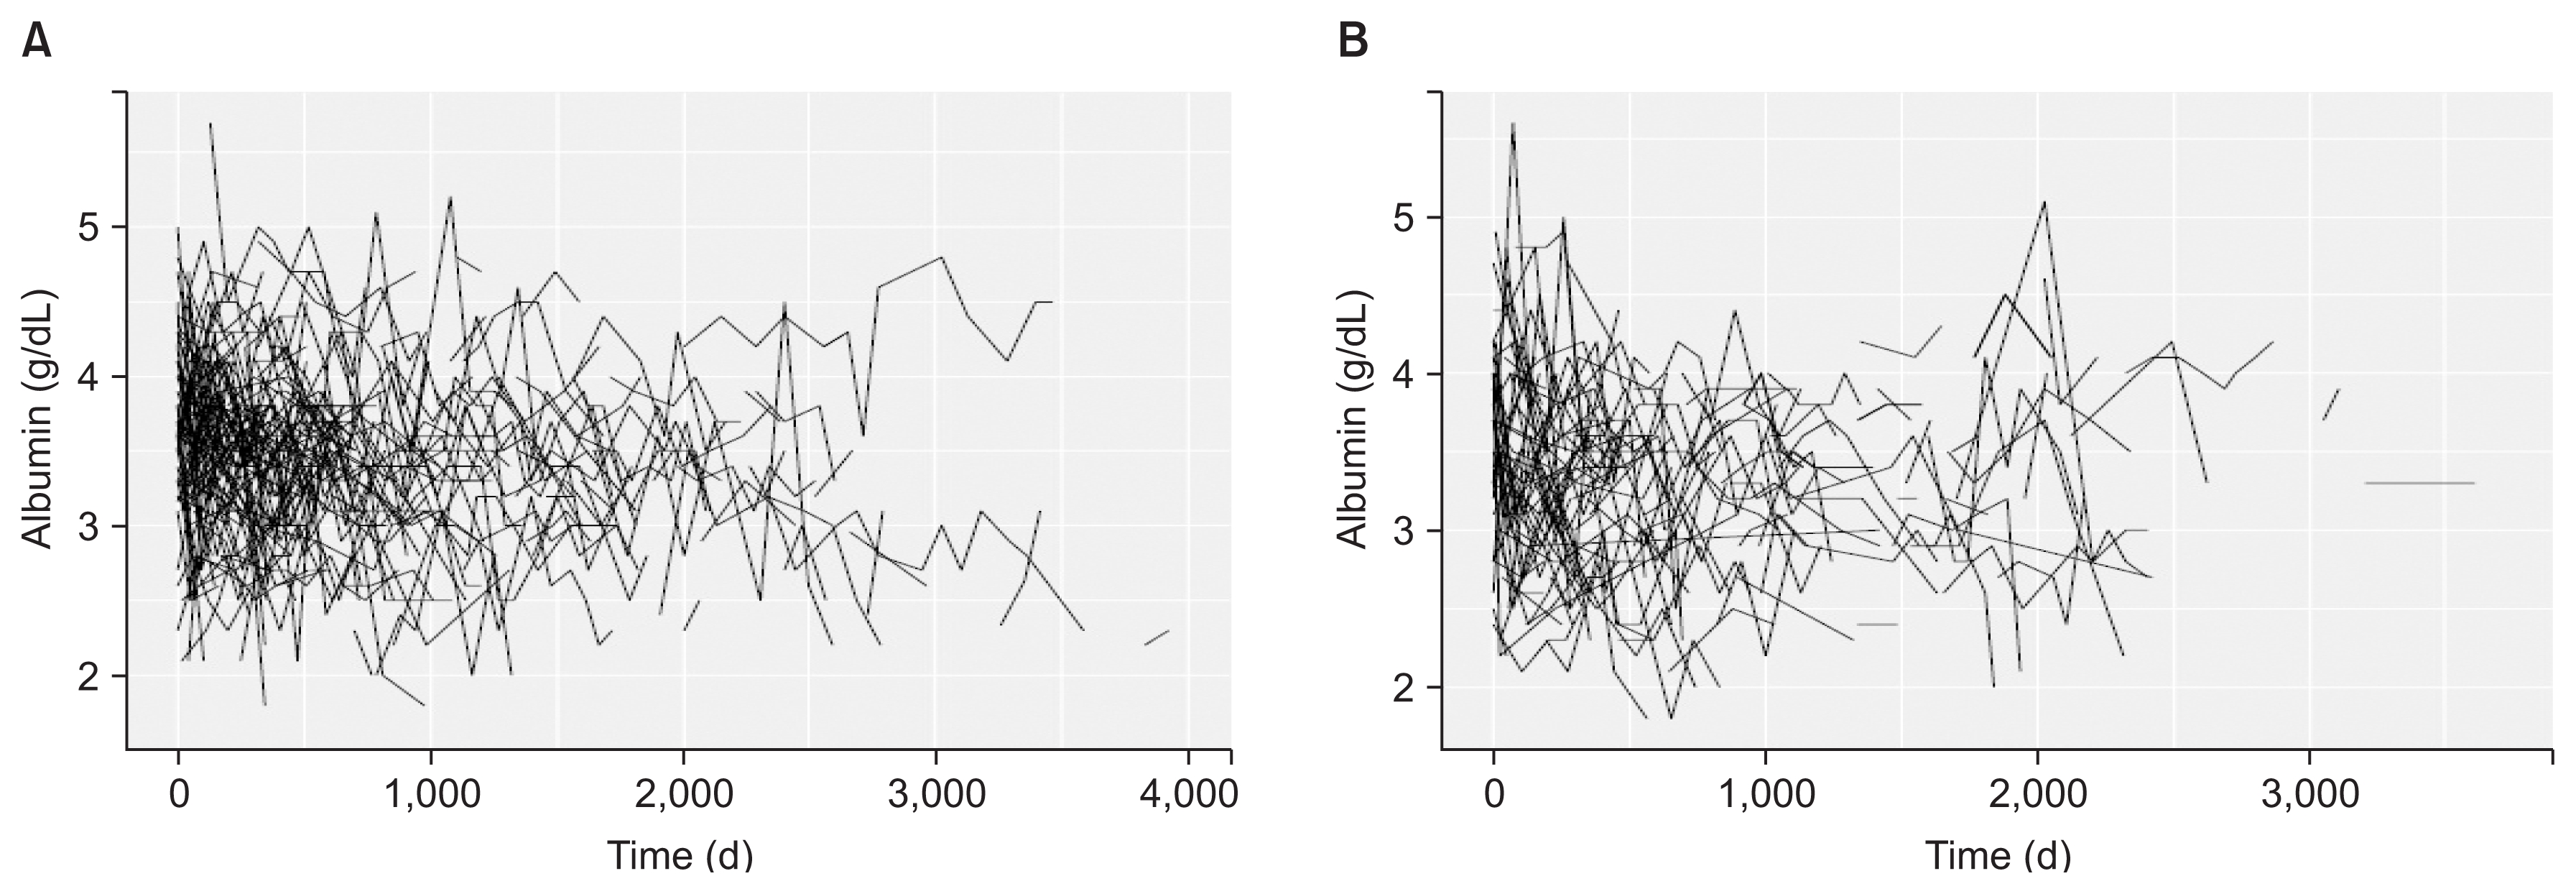
During follow-up period per patient, the averages of longitudinal measurements or visits were 7.03 (range, 1 to 29 visits) and 7.23 (range, 1 to 24 visits) for non-diabetic and diabetic patients, respectively. Fig. 1 show the observed longitudinal measures of albumin plotted against time for all of the PD patients (non-diabetic and diabetic) that were included in the analysis. For event of PD failure, the median survival times, using Kaplan-Meier approach for non-diabetic and diabetic patients were 2,684 and 2,483 days, respectively. The median survival times for event of death from all causes were also 2,442 and 1,615 for non-diabetic and diabetic patients, respectively. There was no significant difference between survival distributions for two groups of non-diabetic and diabetic patients using log rank tests (P = 0.706 for PD failure and P = 0.071 for death). Kaplan-Meier survival plots of PD failure and death from all causes for CAPD patients are shown in Fig. 2. Overall, 18.97% of diabetic PD patients were transferred to HD and 37.8% died during the follow up; for non-diabetic PD patients 16.4% were transferred to HD and 23.8% died, the other patients were still under PD at the end of follow-up in each two groups. Majority of deaths were due to cardiovascular disease and the main cause of transfer to HD was peritonitis. Table 2 denotes causes of transfer to HD for CAPD patients according to diabetic.
Table 3 shows the results of joint modeling of albumin repeated measurements and time to PD failure. Table 3 contains estimate and 95% CI of parameters for two submodels (longitudinal and survival) on diabetic, non-diabetic, without previous HD, and all of CAPD patients in the study. In Table 3, we considered Weibull regression for survival submodel. Joint modeling with Cox regression for survival submodel was also performed (Supplementary table 1). The DIC for Weibull regression was lower than Cox regression for survival submodel (Supplementary table 2). Therefore, in order to interpret of results of the present study, we focused on the more precise estimates of the joint models with Weibull regression for survival submodel.
For diabetic patients, the value of association parameter (╬▒), that described the relationship between values of trajectories of serum albumin and the hazard for PD failure (95% CI) or death was estimated as ŌłÆ0.720 (ŌłÆ0.971, ŌłÆ0.472) or ŌłÆ0.279 (ŌłÆ0.469, ŌłÆ0.114), and indicated that trajectories of serum albumin and the hazard for PD failure or death were negatively correlated. Predictor of low serum albumin over time was increase in time on CAPD for these patients; the hazard of PD failure was associated with cardiovascular disease in diabetic patients. The hazard of death from all causes was associated with previous HD and cardiovascular disease.
For non-diabetic patients, the value of association parameter (95% CI) was estimated as ŌłÆ0.784 (ŌłÆ0.963, ŌłÆ0.587) for PD failure and ŌłÆ0.169 (ŌłÆ0.340, ŌłÆ0.032) for death from all causes. Predictors of low serum albumin over time were increase in time on CAPD and age of PD initiation and decrease in BMI for these patients; the hazard of PD failure was associated with age in non-diabetic patients. The hazard of death from all causes was associated with age and cardiovascular disease.
For patients without history of previous HD, the value of association parameter (95% CI) was estimated as ŌłÆ0.84 (ŌłÆ0.978, ŌłÆ0.702) for PD failure and ŌłÆ0.338 (ŌłÆ0.540, ŌłÆ0.158) for death from all causes. Predictors of low serum albumin over time were increase in time on CAPD and age of PD initiation. The hazard of death from all causes was associated with age and cardiovascular disease.
For all of patients, the value of association parameter (95% CI) was estimated as ŌłÆ0.653 (ŌłÆ0.884, ŌłÆ0.411) for PD failure and ŌłÆ0.355 (ŌłÆ0.567, ŌłÆ0.228) for death from all causes. Predictors of low serum albumin over time were increase in time on CAPD and age of PD initiation, and decrease in BMI and nPCR; the hazard of PD failure was associated with age for all of patients. The hazard of death from all causes was associated with age, previous HD and cardiovascular disease.
Discussion
Results of this study showed an important relationship between trajectories of the serum albumin and hazard of PD failure in ESRD patients according to diabetic status using a Bayesian joint modeling of longitudinal measurements and survival data. Furthermore, the impact of influential covariates on the trajectories of serum albumin levels and hazard of PD failure was found. In our findings, it was revealed that increase in the serum albumin level over time was associated with decrease in hazard for PD failure for each two groups of diabetic and non-diabetic CAPD patients.
The results of our study showed that diabetes mellitus was not significantly associated with survival of technique and patient. However, relationship between trajectories of the serum albumin and hazard of PD failure were significant for two groups of diabetic and non-diabetic CAPD patients and the values of association parameter were approximately similar in both groups. It was also revealed in several studies, notwithstanding the risks involved, that there was no difference in technique survival between diabetic and non-diabetic dialysis patients [16].
Several studies indicated that the initial serum albumin as a significant predictor related to technique failure and death [17,18]. In the present study, using a joint modeling of longitudinal and survival data, association between the trajectories of serum albumin and technique failure were determined.
In a study carried out by Flanigan et al [19], it was reported that serum albumin values, remained marginal and unchanged over the five-year project since 1995 to 2000. In our study, serum albumin decreased slightly over time in CAPD patients.
In most studies on technique failure, similar to the findings of our study, gender was not associated with technique failure [20ŌĆō22].
In the present study, cardiovascular disease and increasing age were the predictors of death which was similar to the findings of study by Chidambaram et al [23].
In this study, increasing age at PD initiation was associated with decrease in technical failure. This finding conflicts with previous studies on PD failure suggesting that relative risk of technique failure increases with increase in age [23,24]. This may explain why the older PD patients in our study prefer to persist with PD undermining of PD-related complications. By contrast, a cooperative study from the Netherlands revealed that elderly patients had a lower risk of death-censored technique failure compared with younger patients [25]. Furthermore, According to studies of Mujais and Story [21,22], age had a small effect on risk of transfer to HD.
Our findings also revealed that HD before starting PD had no impact on technique failure, which was similar to the study of Mujais and Story [22], although it was revealed in various studies that patients with history of HD prior to PD had a higher risk of technique failure [21,23,26].
There are some limitations associated with this study. The study was carried out on PD patients of one center, and therefore it may include a center-specific effect. Also, sample size was relatively small in each two groups (diabetic and non-diabetic). In addition, transfer to HD is a medical decision based on patientsŌĆÖ motivation to stay on PD or to change their modality of dialysis. The relationship between the nephrologist and patient determined these subjective parameters and may even influence the medical decision to transfer [27]. This relationship was not studied here.
This study indicated that increase in serum albumin values over time was associated with decreased risk of the PD technique failure using Bayesian joint models for longitudinal and time to event data. In addition, this method indicated predictors of serum albumin levels and technique failure simultaneously.

 PDF Links
 PubReader
 Full text via DOI
 Download Citation
 Supplement 1
 Print
Print


")


