Drug treatment patterns and work productivity in chronic kidney disease patients with anemia in China: cross sectional analysis of real-world data
Article information

Abstract
Background
We explored the association of anemia severity in patients with chronic kidney disease (CKD) and anemia treatment with work productivity in China.
Methods
Cross-sectional survey data from Chinese physicians and their CKD patients were collected in 2015. Physicians recorded demographics, disease characteristics, and treatment. Patients completed the Work Productivity and Activity Impairment questionnaire. Data were stratified by dialysis-dependence, hemoglobin (Hb) level, and anemia treatment.
Results
Based on data from 1,052 patients (704 non-dialysis-dependent [NDD] and 348 dialysis-dependent [DD] patients), prescribed anemia treatment differed significantly across Hb levels (P < 0.001). In NDD patients, anemia treatment also differed significantly by on-treatment Hb level (P < 0.001). In treated NDD patients with Hb < 10 g/dL, Hb 10 to 12 g/dL, and Hb > 12 g/dL, 31%, 59%, and 38% of patients, respectively, were prescribed oral iron, and 34%, 19%, and 0% of patients, respectively, were prescribed oral iron with erythropoiesis-stimulating agents (ESA). NDD patients were less likely to be prescribed any anemia treatment, and ESA specifically, than DD patients. When treated, 67% and 45% of NDD and DD patients, respectively, had Hb ≥ 10 g/dL (P < 0.001). Overall work and activity impairment differed significantly across Hb levels in NDD and DD patients, with the least impairment observed at the highest Hb level.
Conclusion
Approximately 40% of NDD patients and 60% of DD patients receiving anemia treatment had Hb < 10 g/dL. Compared with mild anemia patients, severe anemia patients were more likely to be treated for anemia and have impaired work productivity. Chinese CKD patients could benefit from improved anemia treatment.
Introduction
Chronic kidney disease (CKD), which is defined by a declining renal function that gradually progresses to end-stage renal disease (ESRD), is a serious, life-threatening condition [1]. Recently, CKD has become a leading health problem in China, with an estimated 119.5 million people with CKD; an overall prevalence of 10.8% [2]. Due to the disease prevalence increasing with age [2] and changing demographics in the Chinese population (estimated at 1.4 billion in 2016) [3-5], CKD prevalence is projected to grow substantially [6]. However, there is little published real-world data concerning CKD and its outcomes in China.
Anemia is defined as hemoglobin (Hb) < 12 g/dL in women and < 13 g/dL in men [7] and is a frequent complication of CKD, as reported in a cross-sectional study of 25 Chinese hospitals [8]. Complications of anemia include neurocognitive impairment, sleep disturbances, CKD progression, cardiovascular (CV) comorbidities, and increased mortality [9-11]. Causes of anemia in CKD include erythropoietin (EPO) deficiency, decreased responsiveness to EPO, iron deficiency, and chronic inflammation [8]. Anemia correlates strongly with both CKD progression and increased mortality risk [12]. In addition, anemia in CKD manifests as fatigue and poor physical endurance, which can impair daily living and work activities, with a greater impact at lower Hb level [13].
Clinical guidelines, such as the National Kidney Foundation Kidney Disease Outcomes Quality Initiative (NKF-KDOQI) [14,15] and Kidney Disease: Improving Global Outcomes (KDIGO) [7], recommend managing anemia as an integral part of CKD management. Treatment strategies for anemia in CKD include the use of erythropoiesis-stimulating agents (ESA), iron therapy, and blood transfusion [7,14,15].
The objective of this real-world cross-sectional analysis was to explore the association of anemia severity and treatment with work productivity in CKD patients in China.
Methods
Study design and data collection
Data were collected in China using the Adelphi Real World CKD Disease Specific ProgrammeTM (DSP) from July to October 2015. DSPs are large, real-world, cross-sectional, point-in-time surveys of physicians and their consulting patients in clinical practice [16].
Physicians, identified from publicly available lists, were based in Shanghai, Beijing, Guangdong province, Hubei province or Liaoning province. They were invited to participate after screening if they qualified as a nephrologist between 1979 and 2012, were making treatment decisions for CKD patients, and saw ≥ 8 patients per month with each of the following classifications: stage 3 non-dialysis-dependent (NDD), stage 4 NDD, and dialysis-dependent (DD) CKD. Physicians were asked to complete a Patient Record Form (PRF) for 4 consecutive CKD patients with stage 3 NDD, 4 consecutive patients with stage 4 NDD, and 4 consecutive patients with DD. PRF information included demographics; disease characteristics, and history; concomitant conditions; the most recently collected relevant laboratory values (Hb, transferrin saturation [TSAT], and ferritin levels); transfusion history; and current prescribed treatment for anemia. Hb, TSAT, and ferritin level data at initiation of current treatment were not available. Physician-perceived CKD progression was defined by the question “How would you describe the progression of this patient’s kidney disease?” with responses classified as “slower than expected,” “as expected” or “faster than expected.” Physician-perceived CV risk was defined by the question “Indicate the patient’s level of CV risk currently?” with responses classified as “very low”, “low”, “moderate” or “high”. Completion of the PRF was based on the judgement and diagnostic skills of the respondent physician, alongside existing patient clinical records, which is entirely consistent with decisions made in routine clinical practice.
Patients for whom the physician completed a PRF were invited to complete a patient self-completion (PSC) form, including complementary information on CKD history and a well-established patient-reported outcomes (PRO) questionnaire. Patients were aged ≥ 18 years with a CKD diagnosis confirmed by the nephrologist responsible for their care and had visited a participating physician during the survey collection period.
PRO questionnaire
Absenteeism (work time missed), presenteeism (impairment while working), overall work impairment, and total activity impairment were measured using the Work Productivity and Activity Impairment-Specific Health Problem (WPAI-SHP) Questionnaire [17]. This questionnaire uses a recall period of the past seven days; patients are asked for the number of hours worked and missed from work due to CKD, how much CKD affected their productivity and how they rated their overall work and activity impairment on a 0 to 10 scale (where 0 = no effect and 10 = completely impaired). Scores range from 0% to 100%, with a higher percentage indicating greater impairment and lower productivity [17].
Analysis
Descriptive analyses were performed for the total study population and stratified by dialysis status (NDD, DD), Hb level (< 10 g/dL, 10 to 12 g/dL, > 12 g/dL), type of anemia treatment (iron only, oral or intravenous [IV]; ESA only; iron + ESA) and Hb level for patients receiving anemia treatment (i.e., patients prescribed treatment for anemia with Hb ≥ 10 g/dL, patients prescribed treatment for anemia with Hb < 10 g/dL).
Patient demographics, clinical characteristics, prescribed anemia drug treatment patterns and WPAI-SHP data were analyzed. Means and standard deviations were calculated for continuous variables, and frequency counts and percentages were determined for categorical variables. Results were compared using chi-square tests (for categorical variables), Fisher’s exact test (for 2-by-2 categorical variable comparisons or where any cell had count of < 5), t tests (for continuous variables compared between 2 groups) and analysis of variance (ANOVA) tests (for numeric variables compared between > 2 groups), based on Hb levels and separately within NDD and DD patient groups. Logistic regressions were conducted on all anemia treatment and ESA only anemia treatment (currently prescribed or not prescribed) by NDD/DD, Hb (including the interaction of NDD/DD and Hb level), age, sex, type 2 diabetes, CV risk (very low, low, medium or high, as perceived subjectively by the physician), concurrent congestive heart failure, number of concomitant conditions, and employment status. Regression plots were generated showing the probability of treatment being prescribed by Hb level and NDD/DD, keeping all other covariates fixed to their mean values. Logistic regressions were also performed on overall work impairment and total activity impairment by Hb level in the NDD group of patients.
Missing data were not imputed; therefore, the base number of patients for analysis varied from variable to variable and is reported for each analysis. All analyses were conducted in Stata ver. 15.1 [18].
Ethical approval and consent to participate
Data were collected according to market research guidelines [19]; hence, no source validation was required. Patient and physician identities were unknown to the research team; all data were fully de-identified, and PRFs and PSCs for each patient were linked by unique numeric codes pre printed on the forms. Patients provided informed consent prior to completing a questionnaire.
Results
Participants
Data were available for 1,052 patients, provided by 90 physicians. Among the 1,052 patients, 66.9% of patients (n = 704) were NDD and 33.1% of patients (n = 348) were DD; seven NDD patients were at stage 5. Patient demographics and clinical characteristics stratified by Hb level are presented in Table 1.

Patient demographics and clinical characteristics by Hb level as reported by physicians
There was a difference in sex across Hb levels in both patient groups, which was significant in NDD patients; the highest proportion of males was observed in patients with Hb > 12 g/dL and the lowest was observed in patients with Hb < 10 g/dL. There were significant differences in employment status across Hb levels in both NDD (P = 0.006) and DD groups (P = 0.004). A numerically higher proportion of NDD patients were in part- or full-time work compared with DD patients across all Hb levels, while a higher proportion of DD patients were retired compared with NDD patients (there was no disabled option on the PRF).
Hb levels decreased with decreasing estimated glomerular filtration rate (eGFR) in NDD patients. Physician-perceived CKD progression varied significantly across Hb levels in NDD patients; patients with low vs. high Hb levels were considered more likely to have a faster CKD progression than expected (P < 0.001). The number of current symptoms (based on a PRF list of 24 symptoms) and concomitant conditions were both inversely related to Hb level in NDD patients, with differences in the occurrence of symptoms of fatigue/lack of energy and suppressed appetite and concomitant coronary heart disease particularly marked.
Anemia treatment
Data on prescribed anemia treatments are presented in Fig. 1.
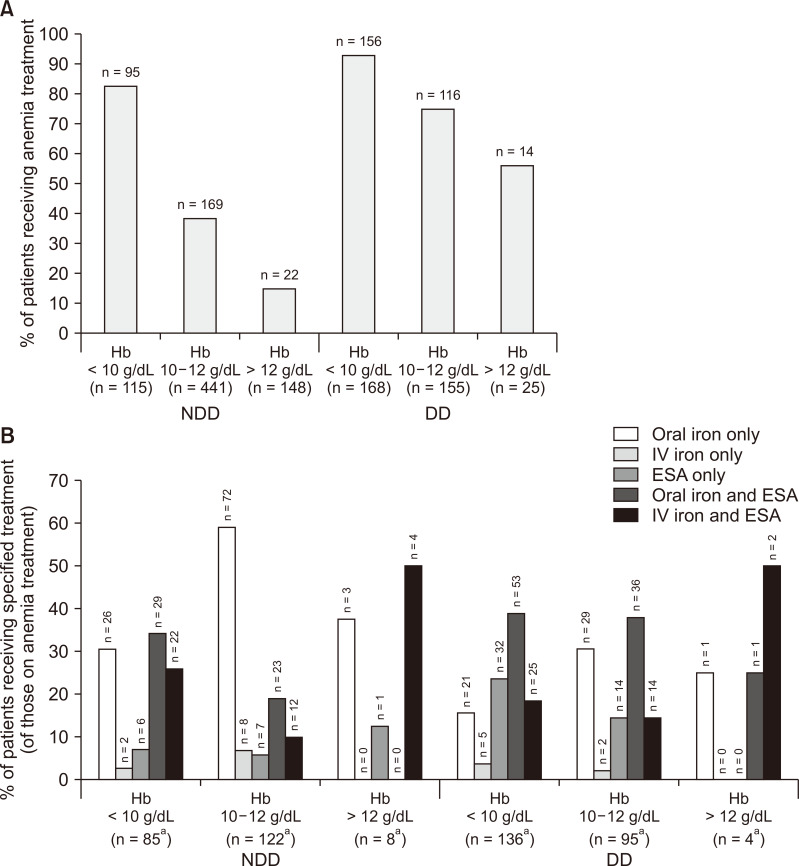
Prescribed anemia treatment.
(A) overall % of patients receiving anemia treatment, (B) % of patients receiving specified anemia treatments. aTreatment details were not reported for all patients receiving treatment, hence these numbers are lower than those shown in Fig. 1A. P values are the results of analysis of variance (ANOVA) comparing differences in anemia treatments across hemoglobin (Hb) levels.
DD, dialysis-dependent; ESA, erythropoietin-stimulating agent; NDD, non-dialysis-dependent.
Anemia severity was associated with the proportion of patients receiving treatment and the type of treatment. A significant difference was observed across Hb levels in the number of patients prescribed anemia treatment, with treatment more likely in patients with lower Hb levels, in both NDD and DD groups (both P < 0.001).
The type of anemia treatment differed significantly across Hb levels for NDD patients. Among NDD patients prescribed anemia treatment, two-thirds of patients with Hb < 10 g/dL were prescribed oral iron alone or iron with ESA. Only 10 NDD patients (1.4%) received IV iron. Approximately one-quarter of NDD patients prescribed iron alone and over half of NDD patients prescribed iron with ESA had Hb < 10 g/dL, while < 5% of NDD patients prescribed iron with ESA had Hb > 12 g/dL. ESA use in NDD patients with Hb < 10 g/dL was almost double that of patients with Hb 10 to 12 g/dL.
Numeric, non-significant differences were observed across Hb levels in the types of anemia treatment prescribed for DD patients. Compared with patients with Hb < 10 g/dL, those with Hb 10 to 12 g/dL were more likely to be prescribed oral iron alone and less likely to be prescribed an ESA. Only 7 DD patients (2.0%) received IV iron. Just under half of DD patients prescribed iron alone had Hb < 10 g/dL, and of those DD patients who were treated and had Hb < 10 g/dL, 19.1% were prescribed iron alone.
Based on regression analysis, decreasing Hb level was found to be associated with greater likelihood of receiving anemia treatment, with NDD patients less likely to be prescribed anemia treatment (at the same Hb levels of 7.5 to 13.5 g/dL Hb) compared with DD patients (Fig. 2).
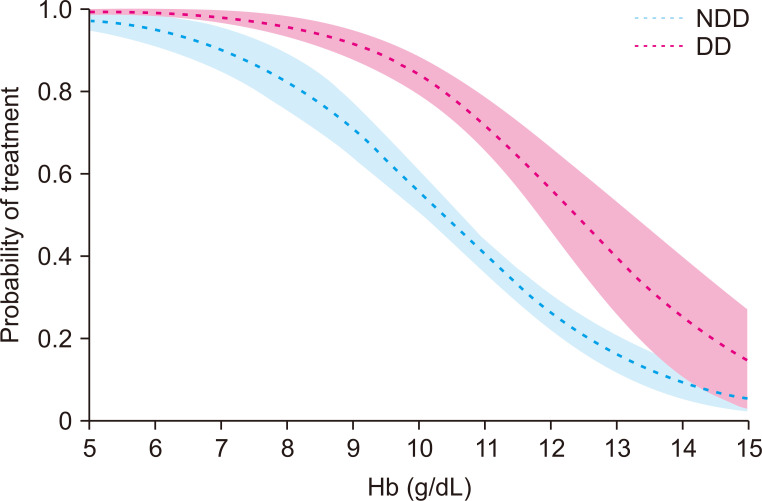
Regression plot of probability of any anemia treatment being prescribed, by hemoglobin (Hb) level and dialysis status.
Shaded regions show 95% confidence intervals for each plotted line. n = 990; Hb: P < 0.001; NDD/DD: P < 0.001.
DD, dialysis-dependent; NDD, non-dialysis-dependent.
In addition, regression analysis showed that at lower Hb levels, DD patients had a greater probability of being prescribed ESA treatment than NDD patients for the same levels of Hb (below approximately 11 g/dL Hb); at 8 g/dL Hb, the percentage of patients prescribed ESA was > 80% in DD patients but < 60% in NDD patients (Fig. 3). The probability of being prescribed an ESA decreased with increasing Hb at a faster rate in DD patients compared with NDD patients (Fig. 3). However, the probability of ESA being prescribed in NDD patients was not strongly correlated with Hb level. Further bivariate analyses identified a higher likelihood of ESA being prescribed rather than iron alone in younger patients; patients with lower eGFR, patients with longer CKD duration, patients considered by their physician to have CKD progressing faster than expected, and with higher numbers of symptoms and concomitant conditions (all P < 0.05).

Regression plot of probability of erythropoietin-stimulating agent (ESA) being prescribed by hemoglobin (Hb) level and dialysis status.
Shaded regions show 95% confidence intervals for each plotted line. n = 877; Hb: P < 0.001; NDD/DD: P < 0.001.
DD, dialysis-dependent; NDD, non-dialysis-dependent.
Regression analysis showed that the probability of being prescribed an iron decreased with increasing Hb at a slower rate in DD patients compared with NDD patients (Fig. 4). In patients with Hb above 9 g/dL, DD patients were more likely than NDD patients to be prescribed iron treatment (DD patients 60% vs. NDD patients 30% at 11 g/dL Hb).

Regression plot of probability of iron being prescribed by hemoglobin (Hb) level and dialysis status.
Shaded regions show 95% confidence intervals for each plotted line. n = 877; Hb: P < 0.001; NDD/DD: P < 0.001.
DD, dialysis-dependent; NDD, non-dialysis-dependent.
Aside from anemia severity, a range of demographic and clinical factors appeared to influence treatment choice, with physicians utilizing these factors when considering their particular approach to treating a particular patient’s anemia (Table 2, 3). There was a significant difference in the age of NDD patients prescribed different types of anemia treatment, with younger patients prescribed iron with ESA compared with those prescribed either treatment alone. There was also a significant difference in employment status in the NDD cohort, with patients prescribed iron and ESA more likely to be employed than those prescribed either treatment alone; only 10% of unemployed patients received iron and ESA compared with 20% of employed patients (Table 2).

Patient demographics and clinical characteristics by anemia treatment type for patients receiving anemia treatment, as reported by physicians

Association of anemia treatment with demographic and clinical characteristics
Patients with NDD CKD prescribed ESA alone were more likely to be considered to have a high CV risk compared with those prescribed iron alone or combined with ESA. Over half of NDD patients (57%) with a high physician-perceived CV risk were prescribed ESA (either alone or with iron). DD patients perceived to have high CV risk were more likely to be prescribed ESA (alone or with iron) than iron alone.
NDD patients who were prescribed iron with ESA had more symptoms and concomitant conditions than patients prescribed iron or ESA alone, with significant differences in mean numbers of symptoms and concomitant conditions across treatments. DD patients who were prescribed ESA with iron experienced a higher number of symptoms than patients on ESA or iron alone, with significant differences across treatments for nocturia, edema, and pruritus.
Anemia treatment and clinical characteristics
Considering only patients prescribed anemia treatment, a higher proportion of NDD patients had Hb ≥ 10 g/dL compared with DD patients (66.8% vs. 45.5%, respectively), indicating either less severe anemia or better response to treatment. Treated NDD patients with higher eGFR were more likely to have Hb ≥ 10 g/dL than Hb < 10 g/dL.
Of note, there was no difference in the proportion of treated patients with iron deficiency (based on current TSAT < 30% and ferritin < 500 ng/mL [7]) between patients with Hb < 10 g/dL and those with Hb ≥ 10 g/dL (Table 3). A significantly lower proportion of treated patients with Hb ≥ 10 g/dL had many of the concomitant conditions reported on the PRF, compared to patients with Hb < 10 g/dL, and patients with Hb ≥ 10 g/dL had a significantly lower mean number of concomitant conditions than those with Hb < 10 g/dL (Table 3). There was a significant difference in the proportion of treated patients with Hb ≥ 10 g/dL and those with Hb < 10 g/dL based on the rate of CKD progression in NDD patients; 59% of patients considered to have CKD progressing ‘as expected’ or ‘slower than expected’ had Hb ≥ 10 g/dL at treatment (Table 3).
When stratified by prescribed anemia treatments, chances of the Hb level being < 10 g/dL or ≥ 10 g/dL varied significantly across treatment types (P < 0.001). Of patients prescribed oral or IV iron alone, more than half of patients (69.1% and 58.8%, respectively) had Hb ≥ 10 g/dL, while of those prescribed ESA alone, oral iron and ESA or IV iron and ESA, more than half of patients (63.3%, 57.7%, and 59.5%, respectively) had Hb < 10 g/dL.
Work productivity
Productivity findings based on the WPAI-SHP are presented in Fig. 5.

Work Productivity and Activity Impairment-Specific Health Problem (WPAI-SHP) domain scores by current hemoglobin (Hb) level.
P values are the results of analysis of variance (ANOVA) comparing productivity impairment across Hb levels.
DD, dialysis-dependent; NDD, non-dialysis-dependent.
No clear trend across Hb levels was observed in WPAI-SHP absenteeism and presenteeism in NDD patients, although both were higher in patients with Hb ≤ 12 g/dL compared with patients with Hb > 12 g/dL. Significant differences across Hb levels were observed in the overall work impairment and total activity impairment (the other two productivity elements assessed by WPAI-SHP) in NDD patients, with the least impairment present at the highest Hb level. Regression analysis confirmed that NDD patients with Hb < 10 g/dL experienced greater total activity impairment compared with those with Hb 10 to 12 g/dL (P = 0.009) and Hb > 12 g/dL (P = 0.003), but no difference was demonstrated between patients with Hb < 10 g/dL and those with Hb 10 to 12 g/dL or > 12 g/dL for overall work impairment.
There was a trend in DD patients for greater presenteeism, overall work impairment and total activity impairment with lower Hb level, but these findings were non-significant and based on limited patient numbers. No clear trend was observed for absenteeism.
Discussion
We explored the association of anemia severity and treatment type with work productivity in Chinese CKD patients. To the best of our knowledge, this is one of the first publications describing real-world clinical practice data from a large cohort of Chinese CKD patients, as challenges relating to the accuracy, completeness, and consistency of data as well as lack of methodological rigor and funding have limited the availability of real-world datasets specific to China [20].
In NDD CKD patients, there was an association between lower Hb level and some clinical characteristics, including reduced eGFR, greater physician-perceived CV risk, and CKD progression rate, along with numbers of symptoms and concomitant conditions. We could not definitively establish that differences observed in comorbidities between patients with different Hb levels were directly related to anemia per se, rather than to worsening CKD and lower eGFR levels with lower Hb levels; however, the association of low Hb and negative clinical characteristics, including renal disease progression, increased CV disease and mortality and reduced health-related quality of life (HRQoL), has been consistently reported in the literature [21-23]. Although there is little evidence specific to China on the association of Hb level with clinical characteristics, one study in a Chinese NDD patient cohort reported low Hb as a risk factor for progression to ESRD [24]. Our findings support those results.
We found that anemia treatment was not prescribed for a proportion of CKD patients with anemia. NDD patients were less likely to be prescribed any type of anemia treatment compared with DD patients regardless of Hb level; our results showed that > 60% of NDD patients and approximately 25% of DD patients with Hb 10 to 12 g/dL were untreated, while 7% of DD and 17% of NDD patients received no anemia treatment despite having Hb < 10 g/dL. These findings suggest under-treatment of anemia in CKD patients in China. International guidelines recommend regular monitoring of Hb levels in CKD patients and treatment if needed to correct anemia [7,14]. Previous studies have reported a low frequency of anemia treatment in NDD patients in China. Mean Hb levels at dialysis initiation in both rural and large urban healthcare settings have been reported as 7.3 to 8.2 g/dL [25-28], and the mean Hb level of NDD patients entering a clinical trial for an anemia treatment in China was 8.8 g/dL [29]. Our findings align with data from a 2012 real-world, multi center, cross sectional study of anemia in Chinese patients with NDD CKD, which demonstrated relatively low levels of treatment despite international treatment guidelines, but did not suggest reasons for these observations [8].
Treatment with iron alone was the most common anemia treatment in our study, particularly in NDD patients; iron (oral or IV) was prescribed to > 30% of NDD patients and approximately 20% of DD patients with Hb < 10 g/dL, although few patients (≤ 2%) received IV iron. Although more than half of patients prescribed iron alone had Hb ≥ 10 g/dL, this does not indicate that the use of oral or IV iron alone is the most successful form of anemia treatment; the decision to prescribe oral or IV iron was probably driven by clinical parameters, such as high eGFR, indicating a likelihood that iron deficiency was the primary cause for anemia, rather than true CKD-related anemia. No significant associations were found between anemia treatment type and TSAT or ferritin levels.
The frequent use of iron to treat anemia observed in clinical practice in China suggests alignment with treatment guidelines by KDIGO and NKF-KDOQI, which recommend iron therapy to correct iron deficiency in NDD CKD patients, with the addition of other agents if iron alone does not increase Hb to the target level [13,15]. However, absorption of oral iron may be reduced in CKD patients, decreasing its bioavailability and efficacy; furthermore, oral iron is associated with poor adherence and gastrointestinal adverse events, while IV iron has been associated with serious adverse events such as anaphylaxis [30]. It is possible that the low cost of oral iron relative to other treatments also led to the relatively high use observed in the study.
Prescription of ESA with or without iron was observed in a substantial proportion of both NDD and DD patients, with a higher proportion of DD patients receiving ESA compared with NDD patients (no stage 5 patients were included in the NDD population), which is expected based on treatment recommendations [15]. As anemia is a risk factor for CV disease, physicians’ perception of patients’ CV risk might be expected to influence treatment choice. A substantial proportion of patients considered to be at high risk of CV disease were prescribed ESA, and the chances of receiving ESA increased with increasing subjectively perceived CV risk, despite treatment of anemia with ESA being associated with an increased CV risk [7,12,31].
When receiving anemia treatment, 67% of NDD and 45% of DD patients had an Hb level ≥ 10 g/dL. The relatively low proportion of DD patients in this study achieving an Hb level ≥ 10 g/dL is an interesting finding, given the severity of their condition and the expected intensive monitoring of Hb levels. Our findings showed a higher proportion of treated NDD patients with an Hb level ≥ 10 g/dL compared with results in a cross-sectional observational study of anemia in NDD patients in China, which reported only 26% of treated patients achieving a target of Hb 10 to 12 g/dL [7]. This could suggest that patients in our study had less severe anemia or less advanced CKD than those in the previous study.
To our knowledge, the association of CKD and anemia with the productivity of patients in China has not yet been investigated. In our study, unemployment was twice as high in NDD patients with Hb < 10 g/dL as in those with Hb > 12 g/dL. Although analysis of productivity in this study was limited as > 75% of patients were retired or unemployed, higher Hb levels appeared to be associated with greater productivity in both DD and NDD patients with anemia of CKD. In NDD patients, total activity impairment decreased with increasing Hb level, while absenteeism, presenteeism and overall work impairment were the highest in patients with Hb level of 10 to 12 g/dL and the lowest in patients with Hb > 12 g/dL. Although mean absenteeism, presenteeism, and overall work impairment were lower in patients with Hb < 10 g/dL than those with Hb 10 to 12 g/dL, it should be noted that these measures are only relevant to those who are actively employed. The lowest proportion of NDD patients in full-time work was observed among patients with Hb level of 10 to 12 g/dL, who were also the oldest NDD patients. It is possible that younger, actively employed patients receive more optimal anemia management, as their HRQoL, daily activities and subsequent productivity may be more adversely affected by anemia symptoms compared with older/retired patients. The complex relationship between employment status, productivity, anemia treatment, and Hb level are difficult to establish, but it is possible that the higher income from being in full-time work allowed employed patients access to more expensive therapy. In DD patients, trends for greater productivity impairment with decreasing Hb level were observed for all productivity variables, but findings were non-significant and based on low patient numbers. A previous analysis of data collected in Europe using the Adelphi CKD DSP also reported greater productivity impairment in CKD patients with lower Hb levels, with activity impairment inversely correlated with Hb level [13]. In addition, a US study found that anemia of CKD treatment with epoetin alfa in NDD patients was associated with decreased absenteeism and improved productivity [32].
Our study had some limitations. As PRFs were completed for 12 consecutive CKD patients at specified stages, the sample collected was pseudo-random rather than a truly random sample and might be biased towards patients who frequently consult their physicians and who may have more problems and comorbidities than a broader patient group. However, our patient population did not differ from CKD populations described elsewhere [33,34] and we do not believe this approach impacted our findings. As this was a cross-sectional study, we were only able to identify associations between variables and characteristics of interest and could not determine causality. Data were not available for patients’ Hb level or iron status (TSAT and ferritin levels) at the time of anemia treatment initiation, which precludes conclusions on treatment impact on Hb levels observed in patients’ receiving iron treatment. However, this was not one of the main aims of the study, as the focus was to investigate the relationship between anemia and work productivity. As with all observational studies, our methodology relied on accurate reporting by physicians and patients; however, this is consistent with how treatment decisions would be made in routine clinical practice. In cases in which physician-reported or patient-reported data were missing, these were not included in the analysis; therefore, the base number of patients for analysis varied from variable to variable and was reported separately for each analysis. This absence of reported data resulted in low patient numbers for some analyses, especially productivity data in DD patients. Despite these limitations, this survey presents data for > 1,000 Chinese CKD patients, allowing for a comprehensive description of patient characteristics, anemia treatment type, and productivity by Hb level. We believe our study provides a unique insight into the management of anemia of CKD patients in China and is the first publication of real-world data for a large cohort of Chinese CKD patients with anemia.
In conclusion, this analysis of real-world data explored the association of anemia severity and treatment with productivity in DD and NDD CKD patients in China. These findings show low Hb levels in a substantial proportion of CKD patients, despite the availability of effective anemia treatments. Our observations of the association of lower Hb levels with faster CKD progression, more symptoms and concomitant conditions, and reduced productivity support the need for effective treatment of CKD patients with anemia in China.
Acknowledgments
The authors would like to thank all patients and physicians who participated in the Adelphi Real World CKD DSP.
Medical writing support under the guidance of the authors was provided by Carole Evans, PhD, on behalf of Adelphi Real World, and was funded by AstraZeneca, in accordance with Good Publication Practice (GPP3) guidelines (Ann Intern Med 2015;163:461-464).
Notes
Conflicts of interest
James Jackson, Rebecca Moon, and Gary Milligan are employed by Adelphi Real World and declare no additional competing interests. Heleen van Haalen, Eirini Palaka, Alaster Allum, and James Sloand are full-time employees of AstraZeneca.
Funding
Funding for this project was provided by AstraZeneca.
Authors’ contributions
James Jackson and Rebecca Moon participated in the conception and design of the study, and acquisition of data, analyzed and interpreted the data, and participated in manuscript writing and revision of drafts. Heleen van Haalen participated in the conception and design of the study, data interpretation, discussion of results and manuscript writing. James Sloand, Alaster Allum and Eirini Palaka participated in the interpretation of the data, discussion of results and manuscript writing. Gary Milligan participated in analyzing the data and reviewed the manuscript.