


Introduction
Acute renal failure (ARF) with severe loin pain and patchy renal vasoconstriction (PRV) is a rare clinical syndrome that usually occurs several hours after exercise and is accompanied by severe loin pain [1]. Ishikawa and colleagues [2] reported the first case of this syndrome in 1981, which showed multiple wedge-shaped delayed enhancements on non-contrast computerized tomography (CT) 22Â hours after intravenous pyelography. Subsequently, similar cases were reported and categorized as a new clinical syndrome of ARF with severe loin pain after anaerobic exercise (ALPE) [1]. ALPE is differentiated from exercise-induced ARF with rhabdomyolysis because serum myoglobin and creatine phosphokinase (CPK) levels are normal or only slightly elevated. It is accompanied by severe pains in the loin or lower back area, and the prognosis is relatively better.
Although anaerobic exercise of mild to moderate intensity is considered to be a main cause of this syndrome, the etiology is still unclear. There are some cases without a definite history of anaerobic exercise [3]. It has been suggested that temporary vasoconstriction of intra-renal arteries resulting from exercise or other causes induces reversible renal ischemia, which in turn causes ARF with severe loin pain [2]. Renal hypouricemia is also considered to be an important risk factor, and it has been reported as being associated with up to 51% of patients [4], [5].
The diagnosis of ARF with PRV mainly depends on clinical history and radiologic study suggesting reversible renal vasoconstriction. A CT scan typically shows findings of multiple patchy wedge-shaped delayed contrast enhancements of the kidney and is considered to be one of the essential diagnostic methods [6]. However, physicians hesitate to perform contrast CT scans in patients with ARF without suspicion of PRV due to the concern of contrast-induced nephropathy. In fact, there may be more cases of ARF with PRV in clinical practice than those confirmed by CT scan. Therefore, characterization of the clinical presentation and the results of various radiologic studies are important for accurate and prompt diagnosis. Although ARF with PRV is known to be more prevalent in Asians, there have been limited reports of this syndrome in other areas than Japan [7], [8], [9]. In this report, we present 17 cases of ARF with severe loin pain and PRV confirmed by enhanced CT scans and investigate the clinical characteristics of these patients and the efficacy of diagnostic imaging tests.
Methods
This study was performed by a retrospective review of medical records from January 1984, when the first PRV patient was detected in Korea, to December 2010 in Seoul National University Hospital. We selected patients with ARF accompanied by definite loin, back, or abdominal pain who showed typical findings of PRV on enhanced CT scans. ARF was defined as a maximum creatinine level 1.5-fold higher than the level after recovery. Multiple patchy wedge-shaped delayed contrast enhancements that persisted and became more distinguished after washout of contrast media were defined as the typical findings of PRV. Patients with rhabdomyolysis with muscular symptoms and elevated muscle enzyme levels 10 times the upper limit of normal were excluded [10]. Clinical data, including the duration and area of pain, the type and intensity of exercise, the presence of previous upper respiratory infections, the intake of alcohol and analgesics, and the types of associated symptoms, were collected. Laboratory data were sequentially gathered according to the progression and recovery of renal failure. Hypouricemia was defined as a serum uric acid level below 2.0Â mg/dL. All of the results of imaging studies were initially reviewed by one physician and then confirmed by another radiologist. All of the data are expressed as the meanÂąstandard deviation (SD) with the range in parentheses or a number with the percentage if needed. This study protocol was approved by the institutional review board of the Seoul National University Hospital in Seoul, Korea.
Results
Clinical findings
Seventeen patients with ARF with severe loin pain and PRV were identified. The clinical characteristics of the 17 patients are summarized in Table 1. The mean age was 23.0Âą6.5 (16â35) years old. Fifteen patients were men and two patients were women. All of the patients presented to the hospital because of severe pain in the loin or abdomen (loin with or without back, 12; abdomen, 13). The duration of pain was 3.5Âą4.0 day. Exercise was suspected as the main cause of pain and PRV in 12 patients. Eleven patients (64.7%) had a typical history of exercise within several hours before the onset of pain. One patient (ID number 14) presented with abdominal pain on the 4th day after exercise. Track racing and running (91.7%, 11 patients of 12) was the most common type of exercise. The estimated running distance ranged from 200 to 2000Â m. The duration of exercise was mostly less than 1Â h.
However, five patients (ID numbers 9, 11, 12, 13, and 17) complained of pain without a definite history of exercise. One patient (ID number 9) reported heavy alcohol drinking 6 h before loin pain. Two patients (ID numbers 11 and 12) had symptoms of upper respiratory infections, such as sore throat and fever, before pain. One patient (ID number 13) had taken analgesics for 2 days before abdominal pain due to a toothache. We could not find any provocation factors in one patient (ID number 17).
Of all of the patients, seven (41.2%) had taken analgesics before the onset of pain. Nine patients (52.9%) had symptoms of upper respiratory infection, such as fever and sore throat, within the 2-week period before pain onset. Three patients (17.6%) drank alcohol several hours before pain onset. Nausea, febrile sense, vomiting, and headache were associated with pain onset in 14 (82.4%), 11 (64.7%), nine (52.9%), and six (35.3%) patients, respectively. Six patients (35.3%) showed oliguria at the time of admission. Costovertebral angle tenderness (CVAT) was found in 12 patients (70.6%). Seven cases of CVAT were bilateral, four cases were right sided, and one case was left sided. Only one patient (ID number 8) received hemodialysis due to severe azotemia, and all of the patients recovered to near-normal renal function before discharge. The duration of admission was 7.3Âą3.5 day, and the duration of renal dysfunction was 10.8Âą5.0 day. No patients revisited the hospital for the same ARF disease with severe loin pain and PRV (Table 4).
Laboratory findings
The laboratory findings are shown in Table 2. The initial blood urea nitrogen (BUN) level was 31.7Âą18.1 (11.0â67.4) mg/dL, and the initial serum creatinine was 4.64Âą2.84 (1.3â12.1) mg/dL. At 3.1Âą1.8 (1â7) days after the onset of pain, the maximal BUN was 36.1Âą17.7 (12.0â67.4) mg/dL, and the maximal serum creatinine level was 5.42Âą3.16 (1.4â12.1) mg/dL. The serum myoglobin, CPK, and lactate dehydrogenase (LDH) levels were normal or mildly elevated (myoglobin 77.8Âą55.0 ng/mL, CPK 244.5Âą176.7 IU/L, LDH 239.7Âą72.7 IU/L) but less than 3-fold greater than the normal values. The maximal serum uric acid level was 9.41Âą2.91 (6.0â15.8) mg/dL. Serum creatinine at the time of discharge was 1.40Âą0.16 (1.2â1.6) mg/dL. The serum uric acid level was only available for seven patients after recovery of renal function and was 5.49Âą2.08 (1.5â7.2) mg/dL. Only one patient (ID number 16) showed hypouricemia (serum uric acid 1.5Â mg/dL) after recovery.
Findings of the radiologic studies
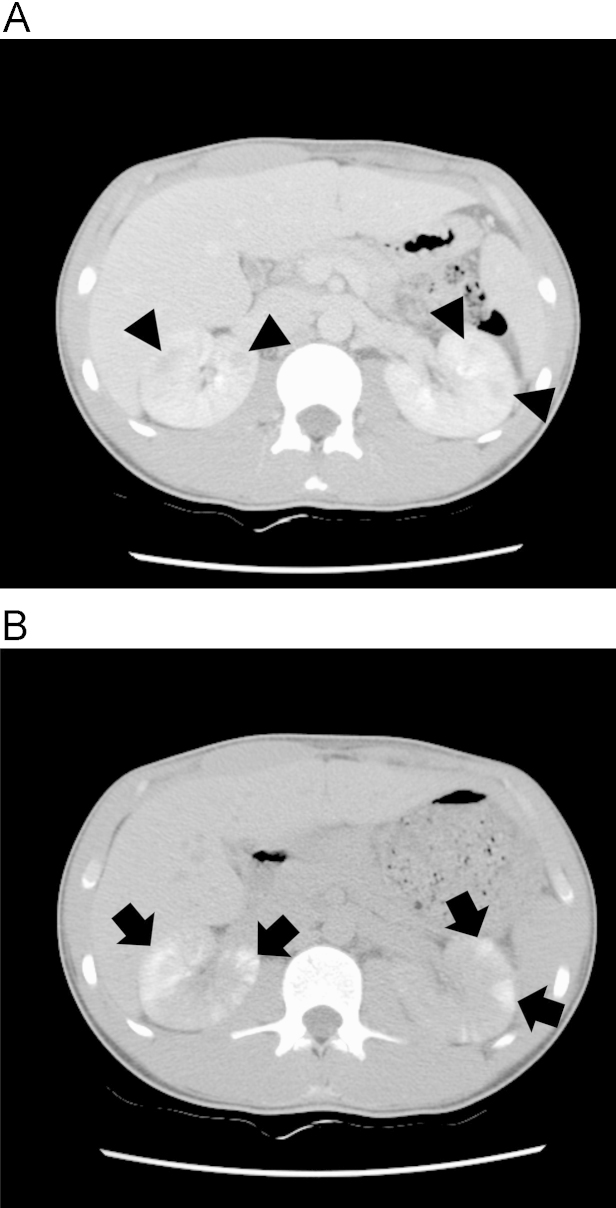
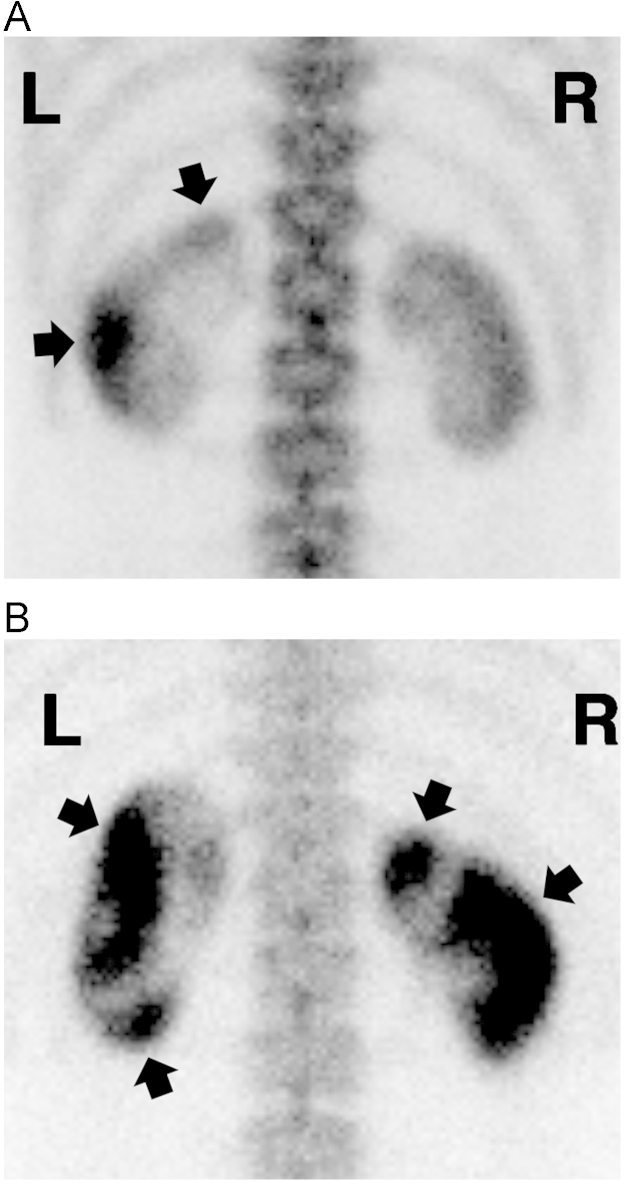
In CT scans taken immediately after contrast media injection, wedge-shaped patchy low attenuation lesions were observed in 12 patients (70.6%), and nonspecific diffuse enhancement was observed in five patients. However, in delayed CT images after 24 or 48Â h (except for two patients [ID numbers 11 and 16] who had taken delayed images after only 4 h), patchy lesions became prominent, and all of the 17 patients showed multiple wedge-shaped contrast enhancements (Table 3, Fig. 1). Although five patients had unilateral CVAT, all of the patients had bilateral wedge-shaped delayed enhancements. A total of 10 patients received a bone scan with technetium-99m methylene diphosphonate (99mTc-MDP), and eight patients (80%) showed multiple areas of irregular patchy uptake in both kidneys (Table 3, Fig. 2). The other two patients showed delayed excretion and diffusely increased isotope uptake on the kidney with prominent contours. Magnetic resonance imaging (MRI) was performed for three patients. Delayed contrast excretion, multiple irregular wedge shapes with high signal intensity, and the disappearance of the corticomedullary junction in T1-weighted images were detected.
Discussion
Various medical terms have been used for ARF, which usually occurs after exercise of moderate intensity accompanied by severe loin pain and shows multiple wedge-shaped contrast enhancements on delayed CT scans. Ishikawa and coauthors [2] first used the term âPRVâ to describe an ARF patient with typical findings on a CT scan. PRV, exercise-induced ARF with PRV, and exercise-induced ARF without rhabdomyolysis have also been widely used [6], [11]. Ishikawa and colleagues [1] collected 118 clinical cases and introduced the term ALPE to emphasize the typical symptoms of severe loin pain after anaerobic exercise. However, some cases of ARF have been reported to occur in daily activity or without exercise [3]. In this study, there were five patients without a definite history of exercise before the onset of pain. Therefore, we used the term ARF with severe loin pain and PRV because this term more accurately describes the pathogenesis and clinical and radiologic characteristics.
We compared the results of clinical, laboratory, and radiologic findings in this study with other case series reports (Table 4). ARF with severe loin pain and PRV was prevalent in young men, and the major symptoms were severe loin or back pain. The ages (23.0Âą6.5 years old) and male preponderance (88.2%) in this study were similar to the results of other studies. Although most of the patients (12 patients, 70.6%) reported loin pain as the chief complaint, five patients had only abdominal pain, and a total of 13 patients presented with abdominal pain (76.5%). Ohta and others [12] reported that loin pain (58.3%) and abdominal pain (36.7%) presented as a first symptom. It is noteworthy that abdominal pain is presented as frequently as loin pain and can be the chief complaint even without loin pain. The duration of renal dysfunction was shorter and the proportion of associated symptoms was lower in our subjects than those of other studies. Oliguria was found in six patients (35.3%), which was more than expected.
ARF along with severe loin pain and PRV usually results from anaerobic exercise of mild to moderate intensity, such as a short track race. The main cause of ARF in this study was track racing and running, as expected. Analgesics, such as acetaminophen and aspirin, and diuretics, such as hydrochlorothiazide and triamterene, have been suggested to be associated with PRV in other studies [11], [13]. Severe alcohol drinking, analgesics intake, and upper respiratory infection were found in four out of five patients who did not have a history of exercise before pain. In patients with severe loin pain and ARF of unknown cause, the presence of these factors should raise the possibility of PRV and should be thoroughly examined.
Renal hypouricemia is a well-known risk factor for ARF with PRV. It was reported that half of ALPE cases were associated with renal hypouricemia [1], [4]. Patients with exercise-induced ARF with renal hypouricemia have normal or mildly elevated levels of serum uric acid during ARF and show severe hypouricemia below 1.0Â mg/dL after the recovery of renal function [14], [15]. Hereditary renal hypouricemia is an autosomal recessive disorder characterized by hypouricemia with high uric acid clearance [16]. Most patients with hereditary renal hypouricemia have mutations in URAT1 or GLUT9, encoded by SLC22A12 or SLC2A9, respectively [17], [18], [19]. Hereditary renal hypouricemia is associated with severe complications, such as exercise-induced ARF [20], [21]. The estimated incidence of renal hypouricemia was reported to range from 0.12% to 0.72% and was especially higher in Asian populations [22], [23]. Therefore, the high incidence of ARF with severe loin pain and PRV was explained by the high prevalence of renal hypouricemia in Asians [24]. Although the pathogenesis of exercise-induced ARF associated with renal hypouricemia remains unclear, several hypotheses have been suggested. Acute uric acid nephropathy from increased uric acid excretion can cause ARF. Oxidative stress from oxygen free radicals produced during exercise can cause renal vasoconstriction and ischemic damage, and hypouricemia may enhance this mechanism because of decreased antioxidant defense [16], [20]. The serum uric acid levels in our patients were higher than other studies during renal dysfunction and after recovery. In this study, hypouricemia was only found in one patient after the restoration of renal function, and the proportion of patients with hypouricemia was much lower than that of other studies. The lower incidence of hypouricemia might be the cause of the mild severity of clinical manifestations in this study. Although we could only obtain serum uric acid data from seven patients after recovery and we did not perform a mutation analysis for SLC22A12 or SLC2A9, it may be possible that the prevalence of renal hypouricemia from mutations in URAT1 or GLUT9 might be lower in these study subjects.
Since the first report of ARF with multiple wedge-shaped contrast enhancements on delayed CT images, contrast-enhanced CT has been considered to be the gold standard in the diagnosis of ARF with PRV. These typical findings have been thought to be caused by delayed excretion of contrast media due to the reversible vasoconstriction of the interlobar or arcuate arteries, which penetrate and extend through the wedge-shaped renal column, and subsequent acute tubular necrosis [2]. CT findings of delayed patchy enhancement are found in patients with ARF induced by transient circulatory insufficiency, hepatorenal syndrome, rhabdomyolysis, and hemorrhagic fever with renal syndrome [25], [26], [27]. Through the review of CT scan results, we identified 20 additional patients who showed findings of PRV on a CT scan without typical loin pain symptoms. The medical conditions associated with these patients included acute bleeding, infections, malignancy, rhabdomyolysis, and others. Although multiple patchy delayed contrast enhancements are sensitive and characteristic findings of ARF with severe loin pain and PRV, wedge-shaped delayed enhancements are not pathognomonic and can be observed in other conditions, even in asymptomatic patients without ARF.
In ARF, the use of contrast media in enhanced CT scans can result in renal function deterioration. Other methods are also available for detecting patchy renal ischemia. Bone scintigraphy with 99mTc-MDP [28] and noncontrast MRI [6] are classical alternative diagnostic methods for the detection of PRV. In this study, eight out of 10 patients who undergone a bone scan at approximately the same time as the CT scan showed multiple irregular patchy uptakes in both kidney areas, and all three patients with simultaneous MRI tests showed typical findings suggesting PRV. Although the bone scan and MRI were performed in a limited number of patients in this study, they showed relatively high diagnostic performance. Previously, bone scans and MRIs had diagnostic sensitivities of 65% and 66%, respectively [1]. Plain [29] or Doppler sonography [30] and Tc-99m DTPA renography [31] can have a diagnostic role in PRV. Recently, the role of diffusion-weighted MRI in the diagnosis of ALPE has been reported, and it showed wedge-shaped signal hyperintensity [32]. Contrast-enhanced ultrasonography with Levovist was reported as a diagnostic tool and revealed wedge-shaped filling defects [33], [34]. Although the additional risk of contrast-induced nephropathy in patients with PRV has not been fully evaluated, a bone scan or diffusion-weighted MRI should be considered as an alternative diagnostic test.
ARF with severe loin pain and PRV is a rare but unique clinical syndrome that cannot be diagnosed without suspicion. Although most patients develop ARF with severe loin pain after several hours of exercise, some patients present with atypical symptoms of abdominal pain without a definite history of exercise. The prognosis is good, and almost all patients recover fully with conservative management. Renal hypouricemia is associated with the development of this syndrome in some patients. Therefore, a mutation analysis for SLC22A12 or SLC2A9 should be considered. Careful history taking and appropriate, timely imaging studies are critical in the diagnosis of this syndrome.
 PDF Links
 PubReader
 Full text via DOI
 Download Citation
 Print
Print


")


