


Introduction
Reduced renal function, which may progress to diabetic nephropathy (DN), is a major cause of mortality among diabetes mellitus (DM) patients [1,2]. An earlier study has demonstrated that mortality rate among type 1 DM patients without kidney disease approaches individuals free of the condition [3]. With an estimated quarter to a third of individuals with DM likely to develop DN [4–6], it is crucial to understand the predictors of renal decline to minimize their occurrence and ultimately, reduce chronic kidney disease among individuals with DM.
Among DM patients, tight glycemic control decreases the risk of decline of renal function and slows the progression of DN [7,8]. However, some DM patients with poor glycemic control never develop DN, whereas some with good glycemic control progress to DN [5]. Such occurrence indicates that factors other than glycemic control may be important for decline of renal function and subsequent progression to DN. One obvious candidate has been genetic factors because there is a strong familial risk for DN; however, there has been limited success in identifying specific genes that account for such predisposition among large DM population [9,10]. Other traditional risk factors influencing the initiation, sustenance, and progression of DN include high blood pressure and smoking [11–13]. For instance, hypertension is estimated to be present in ~80% of patients with kidney diseases [14]. However, the variability in the onset and progression of DN has not been fully explained as a function of the group differences in the aforementioned traditional risk factors alone [5]. Some nontraditional risk factors proposed to influence the renal decline in the general population include psychosocial stress, oxidative stress, advanced glycation end-products, and activation of protein kinase C [15–17]. The relationship between psychosocial stress and decline of renal function among DM patients has not been adequately investigated, which is the reason for the current study.
Psychosocial stress has been suspected as a potential factor in decline of renal function because of its established relationship with glycemic control, hypertension, and smoking [18–21]. Another proposed link between psychosocial stress and decline of renal function is through the increased engagement in behaviors that increase the risk of renal damage such as alcohol abuse, smoking, and drug abuse [15,22–24]. Although higher levels of psychosocial stress have been associated with overall poor health, high blood pressure, poor glycemic control, and smoking [18,25–29], the direct association between psychosocial stress and decline in renal function has not been adequately examined.
The primary aim of the present study was therefore to examine the direct relationship between psychosocial stress and renal function over time among individuals with DM. Although factors including glycemic control, blood pressure, smoking, and other sociodemographic factors have been associated with decline of renal function, the course of estimated glomerular filtration rate (eGFR) among DM patients can be complex and heterogeneous and may be affected by multiple factors including existing comorbid conditions [30]. For instance, albuminuria was identified as the strongest predictor of eGFR decline among Caucasians with DM [31], whereas among Japanese with DM, higher glycemic levels were the strongest predictor [32]. Owing to the variability in eGFR trajectory among different populations, our secondary study aim was to explore other documented predictors of decline of renal function among our unique study population.
Methods
Study population
We used data from a survey conducted in 2005 by a major health management organization (HMO) in the southeastern part of the United States that collected information on health and healthy behaviors. Study participants were working adults who, at the time of the survey in 2005, met the following inclusion criteria: (1) age 25–59 years; (2) employed by one of the 100 largest private or public employer groups offering the HMO as an insurance option; (3) enrolled in the HMO; (4) subscriber within the enrolled family; and (5) diagnosed with DM but without any of the following complications from diabetes—microalbuminuria or macroalbuminuria, overt proteinuria, retinopathy, nephropathy, and/or neuropathy.
Only individuals who reported their race as African American (black) or Caucasian (white) were included in the present study because other racial/ethnic groups represented a very small proportion of the HMO enrollees. The Institutional Review Board of the HMO reviewed and approved the study protocol.
Data and measures
The survey instrument included items and scales that had previously been used in other studies and which had demonstrated reliability and validity [33,34]. The survey was conducted once during 2005. Participants׳ 4-year clinical and pharmacy records from 2005 to 2008 were linked to their 2005 survey data.
Dependent variable
The main dependent variable was eGFR. Using the serum creatinine, the annual eGFR was estimated using the Modification of Diet in Renal Diseases equation [35].
Main independent variable
The main independent variable was psychosocial stress, assessed from social settings (family and friends) and the work environment. Social stress was assessed by two 4-item subscales: one reflecting friend/family support and the other measuring friend/family strain. The instrument was adapted from the Midlife in the United States (MIDUS) study [33]. The MIDUS study scales for family and friends are identical except for the reference (e.g., “How much do members of your family really care about you?” and “How much do your friends really care about you?”); therefore, we combined the references to create a single measure of social climate (e.g., “How much do your friends and family members really care about you?”). Each subscale was averaged and scaled from 0 (most strained, least supportive) to 100 (least strained, most supportive). The work-related psychosocial stress was assessed using the following four subscales from the MIDUS study [33]: work decision authority (6 items), job demands (5 items), coworker support (2 items), and supervisor support (3 items). Each item was assessed using a 5-response Likert scale: “all of the time,” “most of the time,” “sometimes,” “rarely,” and “never.” Each subscale was averaged and scaled from 0 (most strained, least supportive) to 100 (least strained, most supportive) by transforming each item response from 0 to 100 (and reverse coding where necessary).
Health-related covariates
Glycemic control was assessed using hemoglobin A1c (HbA1c) measures from participants׳ laboratory results from 2005 through 2008. Data on height, weight, systolic blood pressure, and diastolic blood pressure were obtained from medical records associated with participants׳ primary care visits. Height and weight were used to compute body mass index. Systolic and diastolic blood pressures were used to compute mean arterial pressure (MAP). A binary variable was created to indicate insulin use versus insulin nonuse. For individuals using oral hypoglycemic agents (OH), we estimated and included the proportion of days in 2005 with OH coverage.
Other sociodemographic measures
Participants׳ age (ranging between 25 years and 59 years) and sex (male=0 and female=1) were assessed from the HMO׳s computerized data. Race/ethnicity (black=0 and white=1), level of formal education (high school education or less=0, some college=1, college graduate=2, and postgraduate=3), and marital status (married=0 and not married=1) were assessed from the survey. Individual-level income information was generally not available and was not included in this study as a covariate. Instead, we used the neighborhood-based socioeconomic status, a validated census track-level scale comprised of seven measures from the US Census as described by Roblin [34].
Statistical analysis
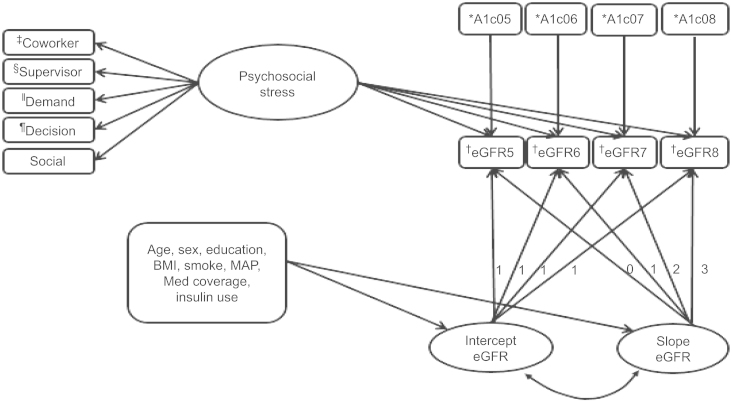
The percent missing on covariates ranged between 0% and 41%, and the percent pairwise coverage for the covariates ranged between 0.39 and 1.00. The percent missing for the stress indicators ranged between 0.5% and 1.6% with covariance coverage ranging between 0.98 and 1.00. For eGFR measures, 49% had a measure on all four waves, whereas 91% had a measure on at least two waves. To address the missing values on exogenous predictors, we performed multiple imputations (10 times) in SAS for the measurement and the growth models. Descriptive statistics was performed in SAS software, version 9.3 (SAS Institute Inc., Cary, NC, USA) [36], while all the other analyses were performed in Mplus statistical software, version 6.1 (Muthén & Muthén, Los Angeles, CA, USA) [37]. Latent psychosocial stress variable was specified using confirmatory factor analysis (CFA) by loading the stress subscales on the latent stress variable (Fig. 1). Bivariate regression analysis was performed between the latent psychosocial stress and selected covariates including age, race, insulin use, and MAP. An unconditional growth model was fit to the four eGFR waves. Without a priori hypothesis about the functional form of the relationship between psychosocial stress and eGFR over time, stress was specified with direct effects on the repeated measures to allow for the greatest flexibility to obtain a time-varying effect estimates in the final growth model (Fig. 1). We controlled for HbA1c measures, sociodemographic variables (sex, age, race, education, neighborhood-based socioeconomic status), smoking, body mass index, insulin use, medication coverage (proportion of days covered by OH), and MAP. Study participants were grouped into two—those who experienced decline in eGFR and those who did not and subgroup analysis was performed for the two groups. The robust maximum likelihood estimator was used. All statistical significance was determined at a two-sided alpha level of 0.05.
Results
Descriptive statistics
The study included 575 participants with the mean age of 49.6 ± 6.9 years. As indicated by Table 1, slightly higher proportions of the study sample were women and blacks. Individuals included in the study were highly educated, and the majority was married. The prevalence of current smoking was 16%. The mean eGFR at baseline was 83.2 mL/min/1.73 m2 (standard deviation=21.3), whereas the mean psychosocial stress for the subscales ranged between 47.1 and 66.0 (Table 2). Approximately 30% (173) of the participants experienced a decline in eGFR, whereas the remaining 70% (402) had their eGFR remain the same or improved during the study period. In the bivariate analysis, other than age, none of the other variables (MAP, race, and insulin use) was significantly associated with psychosocial stress.
The measurement and the growth models
Measurement model
Using supervisor support to scale the factors, the unstandardized factor loadings ranged between 0.106 and 0.787 (Table 3). The mean fit indices for the CFA were as follows: χ2
P<0.001, root mean square error of approximation (RMSEA)=0.072 [90% confidence interval (CI)=0.041–0.107], comparative fit index (CFI)=0.951, Tucker Lewis index (TLI)=0.902, and standardized root mean square residual (SRMR)=0.037. The mean factor score determinacy coefficient was 0.873, with values ranging between 0.869 and 0.878. The mean standardized residual variances of the stress subscales were all significant, with values ranging between 0.35 (supervisor support) and 0.99 (work demand; Table 3).
Structural model
The baseline model estimated an intercept parameter with time centered at 2005 (baseline) and a slope parameter that represented the mean annual rate of eGFR change during the study period. The model fit was adequate: χ2
P>0.001, RMSEA=0.058 (90% CI=0.061–0.094), CFI=0.94, TLI=0.926, and SRMR=0.037. Significant variance existed in the intercept (σ2=360.77, P<0.001) and the slope (σ2=10.49, P<0.016) parameters. The mean intercept was 82.62, whereas the mean slope was 0.88 (P=0.003). Table 3 contains both the unstandardized and the standardized estimates of the CFA model.
The fit for the final conditional model to estimate the direct association between psychosocial stress and eGFR was adequate: χ2
P>0.001, RMSEA=0.048 (90% CI=0.041–0.055), CFI=0.916, TLI=0.893, and SRMR=0.037. Psychosocial stress was not directly associated with any of the four measures of the eGFR. At the study baseline, age, race, MAP, and insulin use were significantly associated with eGFR. Over time, MAP was associated with eGFR decline. Table 4 contains the estimates of the final growth model. For the subgroup analysis, we did not observe significant association between psychosocial stress and eGFR among any of the two subgroups. However, among those whose eGFR values declined, the relationship was marginally significant (β=0.161, P=0.053) at study baseline.
Discussion
Changes in renal function have been associated with an increased risk of mortality [38,39]. Variability exists in changes in eGFR and may reflect in the variation in the onset and progression of DN [40]. In the present study, we examined the direct association between changes in eGFR and psychosocial stress. We also examined other documented predictors of eGFR decline among this study population.
Our primary hypothesis that psychosocial stress would be associated with eGFR was not supported in the final growth model. We did not observe an evidence of a direct association between psychosocial stress and eGFR. This null finding is consistent with the findings from the unique study by Tsurugano et al [41] that did not find a direct association between job stress and chronic kidney diseases (eGFR<60 mL/min/1.73 m2). A number of reasons may partly explain the null finding in the present study. First, psychosocial stress is a broad concept, spanning multiple facets of life including major life events, financial circumstances, perceived discrimination, social circumstances, and the work environment [42–44]. The present study included stress from two main sources—the work environment and social settings in assessing the psychosocial stress factor. It is therefore possible that the current measure had underestimated the level of psychosocial stress in this population. The measure might not have been comprehensive enough to assess all stressful situations in individuals that might predispose them to a decline in eGFR. Second, although our study participants were DM patients, they were relatively young (mean age of 49.9 years, standard deviation=6.9) and healthy without a major microvascular or macrovascular complications at the time of the study in 2005. The rate of decline of renal function increases with age with the greatest decline noted among those aged 50–60 years [45,46], which formed less than half of our study population. Therefore, the changes in renal function in this population may be slow. The 4-year follow-up may be too short to observe significant changes in eGFR, although a study with a median follow-up period of 3.4 years noted significant changes in eGFR that was associated with risk of death [47]. Future studies should consider a longer follow-up period or use one of the sensitive markers of eGFR such as albuminuria or proteinuria, both of which were not available in this study. Third, a major predictor of decline of renal function among DM patients is poor glycemic control. Goel and Perkins [48] demonstrated that higher HbA1c increases eGFR loss. The Diabetes Control and Complications Trial, the Epidemiology of Diabetes Intervention and Complications study, and a number of other studies also made similar findings of the association between HbA1c and eGFR [7,49–51]. During the 4-year study period, the mean HbA1c remained consistent with values ranging between 7.9% and 8.1%. A marginal but significant improvement in eGFR was also observed among the study population. Although unexpected, kidney function can be variable and may improve over time [52,53]. Finally, the study participants were in an integrated delivery system of well-established DM management program and might have received special care to prevent or slow eGFR decline [54]. Although no significant association was observed between depression and eGFR in the subgroup analysis, the marginal P value (P=0.053) observed among those who experienced decline in eGFR warrants further research. With only 173 individuals within this category, future studies with larger sample size should further explore this association.
Even though no direct association was observed between psychosocial stress and changes in eGFR, some of the study covariates were significantly associated with eGFR in the expected direction. This observed association validates the data and identifies factors that are important to changes in eGFR among the study population, providing information that could guide prevention efforts, especially for factors that can be modified. At baseline, race, age, insulin use, and MAP was each significantly related to eGFR. Blacks had lower eGFR values compared to their white counterparts. Racial differences in decline of renal function have been reported, with blacks experiencing the greatest disparity compared to whites [55,56]. Increasing age has been associated with eGFR decline among adults with DM. Use of insulin was associated with decline in eGFR which is consistent with the literature [30]. Insulin use may be related to having had DM for a long time, and/or poor glycemic control, particularly, among type 2 DM patients both factors of which have been associated with decline of renal function among DM patients [8,57–59]. Consistent with prior studies, increasing MAP was found to be associated with eGFR at both study baseline and over time [60–62]. Some interventional studies have demonstrated that antihypertensive treatment among DM patients may reduce the incidence or slow the progression of decline of renal function [63,64]. As presented in Fig. 2, the effect of MAP on eGFR trajectory during the study period indicated that not only were people with higher MAP started with lower eGFR value but their rate of decline was also faster.
The strengths of the study need to be noted. First, to the best of our knowledge, this is the first study to examine the direct association between psychosocial stress as a latent factor and renal function over time among individuals with DM. The use of CFA in the measurement and quantification of stress is preferred because it explicitly accounts for differential measurement error related to the different items, thus, yielding a more accurate and precise assessment of the underlying constructs [65,66]. The use of structural equation modeling allowed for the utilization of the latent stress variable that was created at the CFA step. Second, the study controlled for several covariates that may impact renal function among individuals with DM including HbA1c level, blood pressure, smoking, medication coverage, and demographic variables. The following points, however, need to be considered as study limitations: (1) our measure of psychosocial stress may be limited by the inclusion of fewer major sources of psychosocial stress; (2) we did not have data on albumin, C-reactive protein, and nutrition information which are important factors in renal changes; and (3) participants were enrollees of the HMO, and results may not be generalizable to uninsured patients, those in other health insurance systems, or patients in other geographic locations.
In conclusion, in a study of fairly healthy adult DM patients, we did not find a direct association between psychosocial stress and eGFR. However, predictors of changes in eGFR included age, race, insulin use, and blood pressure. Interventions to address decline of renal function among DM patients should address high blood pressure. Considering the inclusion of limited sources of psychosocial stress in creating the stress factor and unavailability of other important covariates such as albumin and C-reactive protein, we recommend that future studies should address these limitations.

 PDF Links
 PubReader
 Full text via DOI
 Download Citation
 Print
Print


")


