


Introduction
Chronic kidney disease (CKD) is a global health burden with an increasing prevalence [1ŌĆō4] and is associated with an elevated risk of cardiovascular events, kidney failure, and death [5ŌĆō7]. Metabolic syndrome, a complex cluster of disorders including hypertension, diabetes mellitus (DM), dyslipidemia, and obesity, is an independent risk factor for CKD [8ŌĆō12]. Kidney function can be preserved by downsizing the metabolic burden through the control of its components; therefore, the clinical significance of managing various metabolic components has been emphasized [13].
Recently, growing evidence on the hazardous effects of intraindividual variability of metabolic components has been identified in the general population [14ŌĆō17]. The association between high metabolic variability and higher risk of adverse outcomes has also been described in the CKD population [18]. Furthermore, the variability and its impact on cardiovascular outcomes may be more intensified in patients with CKD than in those with preserved kidney function [19]. Thus, additional investigations are warranted to determine whether the degree of association between cardiovascular risks and metabolic variability differs according to baseline kidney function, as kidney function impairment itself is associated with a higher burden of metabolic disturbance.
In this study, we hypothesized that the degree of association between high metabolic variability and high cardiovascular risk would be greater in individuals with a reduced baseline estimated glomerular filtration rate (eGFR). We constructed a large population-based cohort of approximately 10,000,000 Koreans with at least three metabolic component measurements to investigate the prognostic significance of metabolic variability on all-cause mortality, myocardial infarction (MI), and ischemic strokes according to baseline eGFR ranges.
Methods
Ethics approval and consent to participate
The study was conducted in accordance with the principles of the Declaration of Helsinki and approved by the Institutional Review Board (IRB) of Seoul National University Hospital (No. E-2111-037-1270). The Government approved the investigation using the Korea National Health Insurance Service (NHIS) database (REQ202203651-001). Since this was an observational study using an anonymous and de-identified public database, informed consent was waived by the IRB of Seoul National University Hospital.
Study setting
We conducted a retrospective observational cohort study using nationwide health screening data from a public database provided by the NHIS. In Korea, citizens who reside in the country are eligible for National Health Insurance (NHI). Approximately 52.8 million Koreans insured by NHI pay insurance contributions and receive medical services, including annual or biennial health screening from healthcare providers. The NHIS contains information on health screenings, as well as sociodemographic status, death registry, diagnosis, and claims information. Details of the NHIS system and data collection have been previously described [20]. In this study, the metabolic components and eGFR values were identified from health screening data, and follow-up information for death and cardiovascular risk was collected from the claims database. By subdividing the population by eGFR and metabolic variability, we aimed to analyze the differences in the association strengths between metabolic variability and cardiovascular risks according to baseline eGFR.
Study population
We included adults (aged Ōēź20 years) who completed three or more health screenings between 2007 and 2012/2013, as in our previous study [21]. Baseline health screening during the year 2012/2013 was determined as the cohort entry date. Follow-up was started on the day after the entry date until censored at the study outcome or death. Considering the common intervals (annual or biennial) of repetitive health screenings in the study population, the 5-year inclusion period was used because at least three measurements are necessary to calculate variability.
We excluded participants with preexisting MI or ischemic strokes to minimize possible confounding and reverse causality and studied incident outcomes. Patients who received kidney replacement therapy, including hemodialysis, peritoneal dialysis, or kidney transplantation, were excluded from the analysis. Participants with more than one missing data in exposures or covariates were also excluded. In addition, we excluded those without follow-up information (Ōēź1 year) for the study outcomes.
Participants were classified into four categories according to the ranges of eGFR (<15, Ōēź15 to <30, Ōēź30 to <60, and Ōēź60 mL/min/1.73 m2) on the basis of the 2012 KDIGO (Kidney Disease: Improving Global Outcomes) CKD classification [22] and further stratified into metabolic component variability quartiles.
Assessment of metabolic component variability
The variability of metabolic components was defined as intraindividual variability between measurements in each health screening using variability independent of the mean (VIM). Among variability indices, such as coefficient of variation, standard deviation (SD), VIM, and average real variability, VIM was used for the construction of the variability scoring method due to its strength of being less affected by measurement intervals and mean values compared to the other variability indices [23,24]. VIM was obtained by dividing SD by the mean to the power x (SD/meanx), and power x is modeled as SD = a ├Ś meanx from the linear regression analysis [17,25].
Following a previous study [17,21], the main metabolic components, including body mass index (BMI), fasting blood glucose (FBG), systolic blood pressure (BP), and total cholesterol, were collected during each health screening. The VIM values of the components were classified into four quartiles (Q1ŌĆōQ4). High variability was defined as the highest quartile (Q4) of variability, and low variability as the lowest quartile (Q1). The concept of metabolic variability score to represent the overall metabolic burden has been introduced in previous studies [17,21]. The cumulative metabolic variability score was defined as the total number of high-variability (Q4) metabolic components, which ordinally ranged from 0 to 4. The participants were classified into five categories according to their metabolic variability score (0ŌĆō4).
Data collection and definitions
We collected covariate data, comprising clinical, socioeconomic, and demographic information. Clinical information including height, weight, BMI, waist circumference, FBG, systolic and diastolic BP, total cholesterol, high-density lipoprotein (HDL), low-density lipoprotein (LDL), triglyceride, and eGFRŌĆöusing the Modification of Diet in Renal Disease study equation [26]ŌĆöwas collected at each health screening. Demographic information, including age, sex, and low income (lower 20% percentile of the nation), was collected. Additionally, health behaviors, including smoking (nonsmoker, ex-smoker, current smoker), alcohol consumption (nondrinker, mild drinker, 0ŌĆō30 g/day; heavy drinker, Ōēź30 g/day), and regular physical exercise (moderate-intensity physical activity of Ōēź5 days/week or vigorous-intensity physical activity of Ōēź3 days/week), were collected by questionnaires. Comorbidities were identified according to the International Classification of Diseases, 10th Revision (ICD-10) and prescription codes. DM was defined by ICD-10 codes E11 to E14 with relevant antidiabetic medication prescriptions. Hypertension was defined by ICD-10 codes I10 to I13 and I15 with relevant antihypertensive medication prescriptions. Dyslipidemia was defined as ICD-10 code E78 with a relevant lipid-lowering medication prescription.
Study outcomes
The study outcomes included all-cause mortality, newly diagnosed MI, and ischemic stroke and we analyzed the three outcomes separately considering the competing risks. Data on all-cause mortality events were collected from Statistics Korea. MI was defined as ICD-10 codes I21 or I22 recorded during hospitalization [16,17,21], while ischemic stroke was defined as ICD-10 codes I63 or I64 recorded during hospitalization, with claims for brain magnetic resonance imaging or brain computed tomography. Individuals were followed-up on from the day after the health screening visit of the index year until censored by the first occurrence of the following conditions: death, MI, and ischemic stroke (whichever occurred first).
Statistical analyses
Baseline characteristics were presented as mean ┬▒ SD for continuous variables or number (percentages) for categorical variables.
The incidence rate of the outcomes was calculated by dividing the number of events by the total follow-up duration (person-years). The chronological trends of all-cause mortality, newly diagnosed MI, and ischemic stroke were presented with Kaplan-Meier survival curves and analyzed using a log-rank test according to the number of high-variability metabolic parameter (Q4). The Cox regression analyses, including metabolic variability components such as exposures and adverse outcomes, were performed. We performed an analysis with stratification of baseline eGFR to estimate whether there were differences in the degree of association between metabolic variability and adverse outcomes according to eGFR levels. Two multivariable models adjusted for covariates including age, sex, health behaviors, comorbidities, and BMI were used. Interactions according to baseline eGFR categories were evaluated with p-value for interaction in the multivariable model to determine whether the associations between metabolic variability and adverse outcomes were significantly different according to the eGFR categories.
Statistical analyses were performed using SAS version 9.4 (SAS Institute), and two-sided p-values of <0.05 were considered statistically significant. The p-value for trend for the higher exposure grades was calculated. The p-value for interaction of <0.05 was considered indicative of a significant presence of an interaction.
Results
Study population
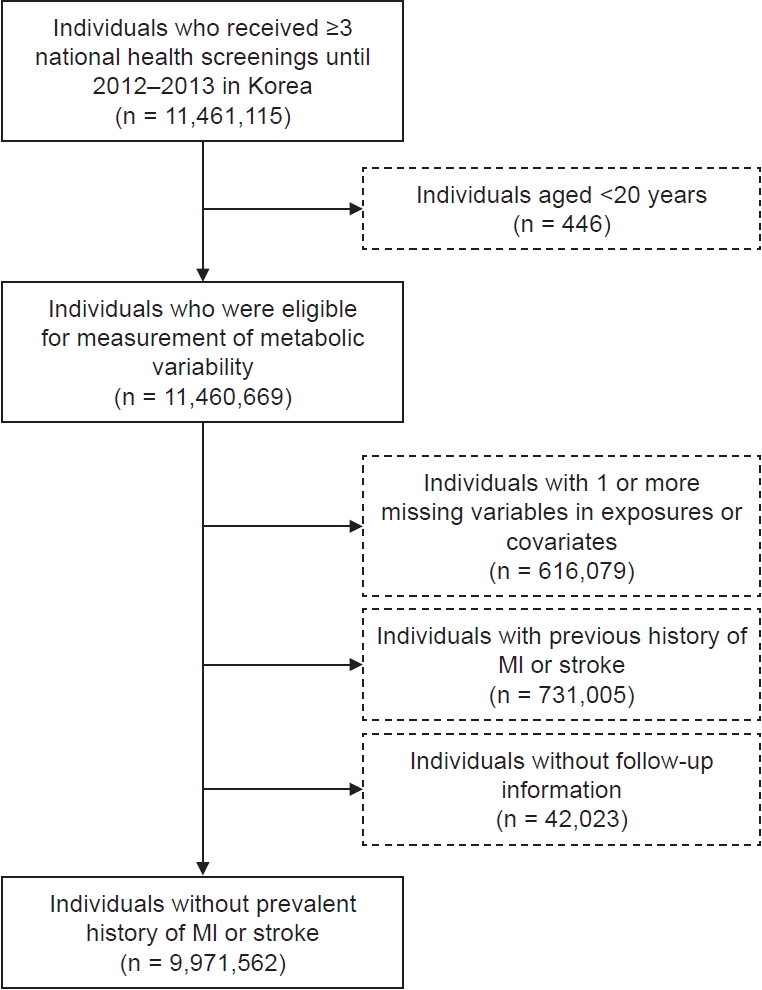
We identified 19,959,581 individuals who underwent health screening during the index year (Fig. 1). There were 11,461,115 individuals who underwent three or more health screenings, and among them, 11,460,669 individuals were aged >20 years. We excluded patients with a medical history of MI (n = 258,515) or ischemic stroke (n = 572,490). Individuals with one or more missing data in exposures or covariates were excluded (n = 616,079). After excluding those whose follow-up information was unavailable, the remaining 9,971,562 participants with or without CKD were included in the study.
Baseline characteristics
The mean age of the study population was 49.7 ┬▒ 13.4 and 55.0% were male. The population according to baseline eGFR category were as follows: 1) <15 mL/min/1.73 m2 (n = 15,327, 0.2%), 2) Ōēź15 to <30 mL/min/1.73 m2 (n = 362,063, 3.6%), 3) Ōēź30 to <60 mL/min/1.73 m2 (n = 5,051,054, 50.7%), and 4) Ōēź60 mL/min/1.73 m2 (n = 4,543,118, 45.6%).
The baseline characteristics of the study population stratified by BMI variability are presented in Table 1. Individuals with high (Q4 VIM) BMI variability were more likely to be female and have low income, whereas those with low (Q1 VIM) BMI variability were more likely to engage in regular exercise. The prevalence of DM was highest in those with high BMI variability, while the prevalence of hypertension and dyslipidemia were highest in those with low BMI variability. Moreover, baseline eGFR was higher in those with higher BMI variability.
The study population was divided into two subgroups according to the presence of CKD and further stratified according to BMI variability (Supplementary Table 1, available online). The mean age was the oldest among those with CKD and high BMI variability. Unlike individuals without CKD, the mean eGFR was the lowest in those with high BMI variability in CKD.
Prognosis according to baseline estimated glomerular filtration rate and metabolic variability score
During a mean follow-up of 6.0 ┬▒ 0.7 years, there were 223,531 all-cause mortality (2.2%), 107,140 MI (1.1%), and 116,182 ischemic stroke events (1.2%). A higher cumulative metabolic variability score was significantly associated with a higher risk of all-cause mortality, MI, and ischemic stroke in the regression analysis adjusted for covariates in the study population (Supplementary Table 2, Supplementary Fig. 1; available online).
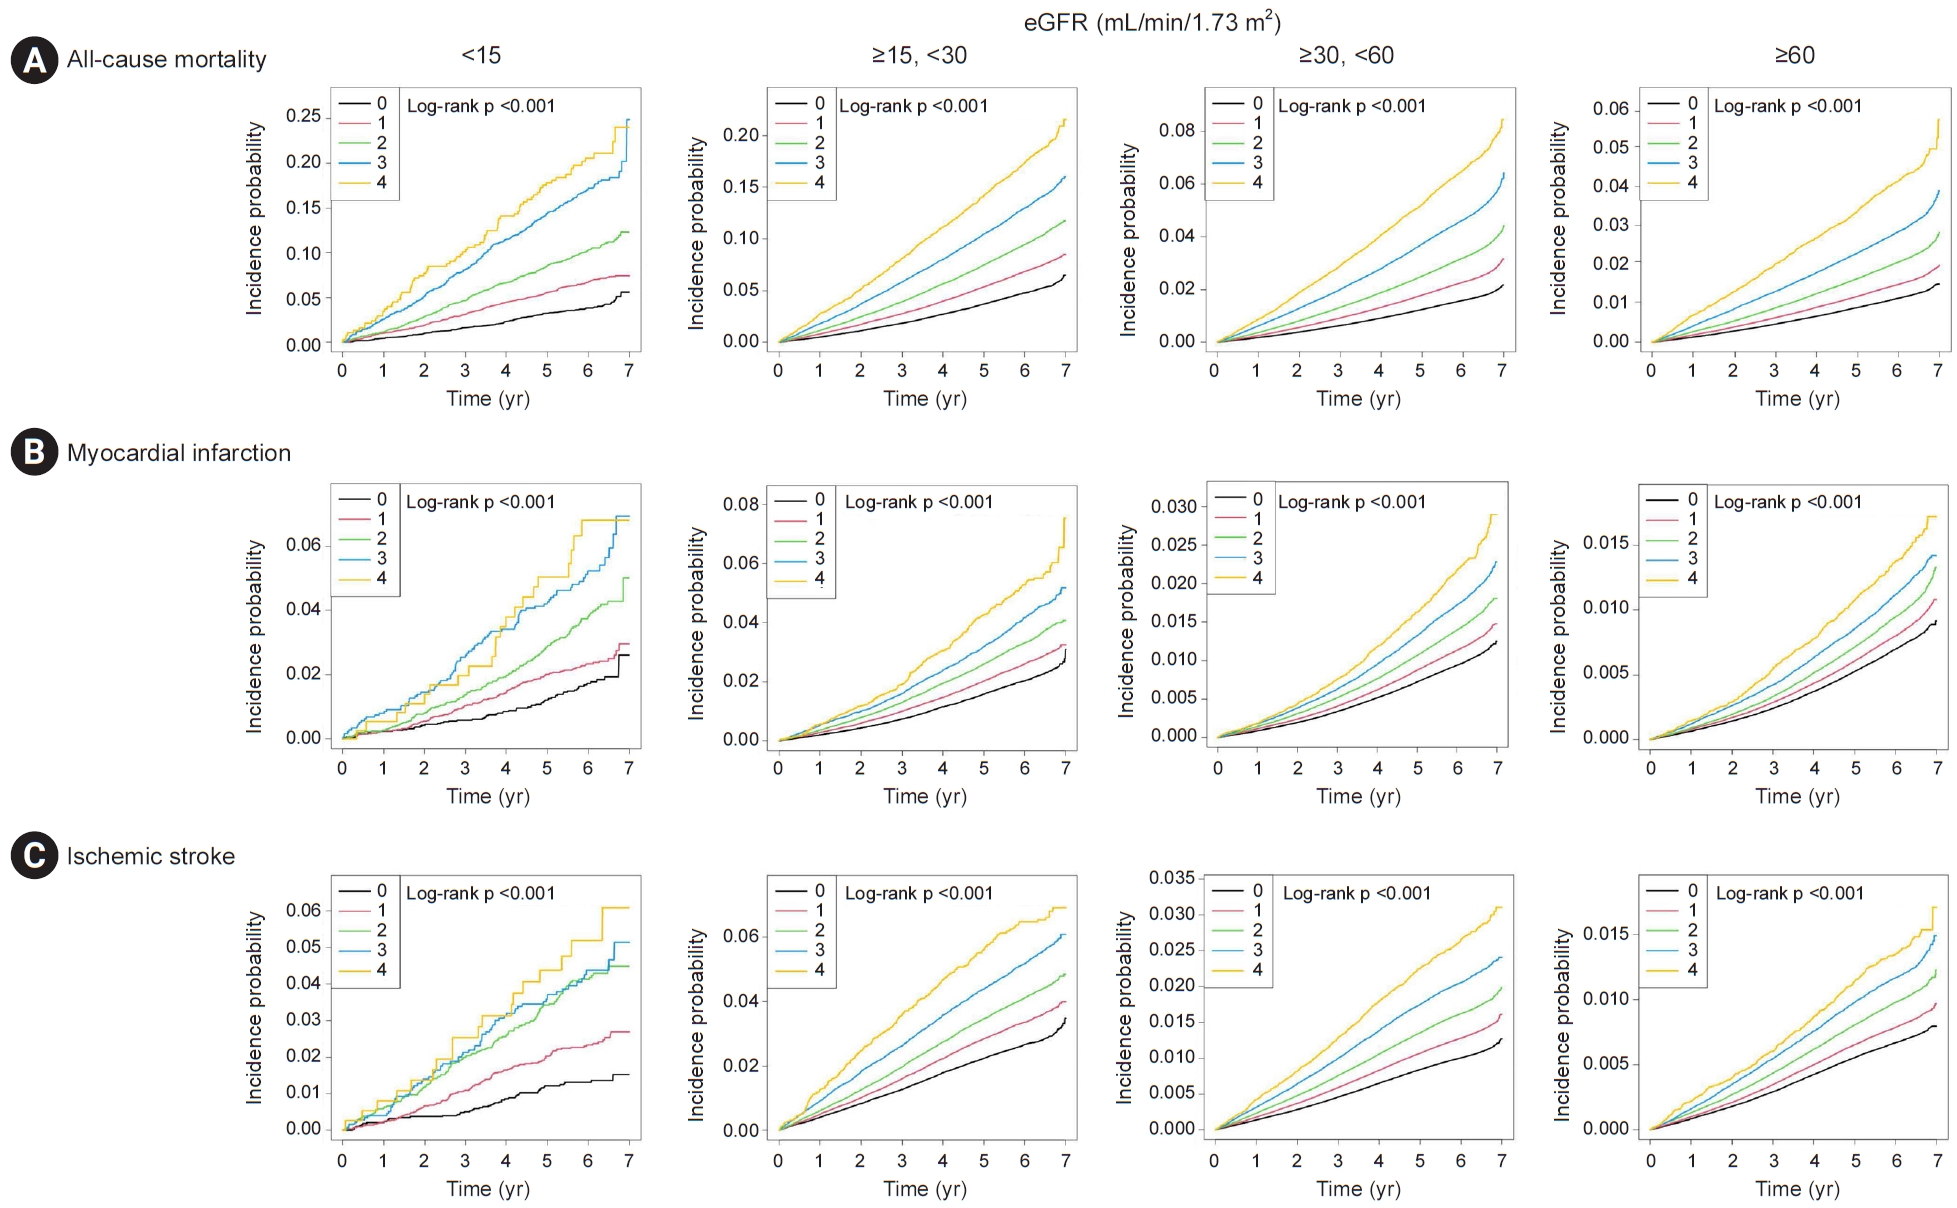
For the main analysis, we categorized the study population by baseline eGFR and again assessed the association between metabolic variability and the risk of adverse outcomes (Table 2 and Fig. 2, 3; Supplementary Table 3, available online). Overall, those with low eGFR categories exhibited higher hazards for adverse outcomes. Furthermore, a higher metabolic variability score was significantly associated with a higher risk of all-cause mortality, and the degree of association was significantly larger in those with low eGFR categories than in those with preserved eGFR (p for interaction < 0.001). The results were similar when MI or ischemic stroke outcomes were assessed, and those with low eGFR categories exhibited a larger degree of association between metabolic variability and the risk of adverse outcomes. In addition, the interaction by eGFR categories was identified to be significant when MI or ischemic stroke outcomes were assessed (p for interaction < 0.001).
Prognosis according to baseline estimated glomerular filtration rate and metabolic component variability
We assessed the association between baseline eGFR and adverse outcomes, including all-cause mortality, MI, and ischemic stroke, according to various metabolic component variabilities. The stronger associations between high metabolic component variability and higher risk for adverse outcomes in those with reduced baseline eGFR were consistent for each metabolic variability score component, comprising BMI, systolic BP, TC, and FBG (Supplementary Table 4, available online). The association remained similar in the multivariable model adjusted for various factors, including age, sex, income, social behaviors, and comorbidities. Moreover, the eGFR categories significantly interacted with the association between metabolic component variabilities and the risk of adverse outcomes, and the degree of association was significantly greater in those with lower eGFR categories.
In addition, high variability of other metabolic components, such as body weight, waist circumference, diastolic BP, LDL, HDL, and triglyceride, also showed a stronger association with adverse cardiovascular outcomes in patients with reduced baseline eGFR (Supplementary Table 5, available online).
Discussion
In this large-population cohort study, we found that the significant associations between metabolic variability and the risks of all-cause mortality, MI, and ischemic stroke were even accentuated in those with low eGFR categories. The results were consistently significant after adjusting for various clinicodemographic and social factors, and each metabolic component variability was assessed. In addition to the expected higher risk of adverse outcomes in those with low eGFR values, our study results suggest a synergistic adverse effect from low eGFR and high metabolic variability, which was greater in those with lower eGFR categories. Therefore, this study suggests that clinicians should pay attention to the clinical significance of metabolic variability, particularly in those with kidney function impairment.
In previous studies, metabolic variability has been an independent risk factor for cardiovascular and mortality outcomes. In these studies, visit-to-visit fasting glycemic variability [27,28], BP fluctuation from ambulatory BP monitoring [29], long-term total cholesterol variability [30], and body weight and waist circumference variability were independent risk factors for all-cause mortality and cardiovascular events [31,32]. Several mechanistic studies have suggested possible factors that explain these associations. For example, oxidative stress and production of inflammatory cytokines due to glucose variability [33,34], fluctuation of cholesterol plaque composite and structure caused by cholesterol variability [35], and shear stress on the vascular wall and cardiovascular system induced by BP fluctuation result in endothelial damage and dysfunction, leading to an increased risk of cardiovascular outcomes [36]. In the repeated overshoot theory, vascular injury is explained as the result of weight variability-induced fluctuations in various cardiovascular and renal risk factors, including intraglomerular pressure, blood glucose, cholesterol, and BP [37].
Several studies have suggested that patients with CKD may be more vulnerable to metabolic component variability. Impaired clearance of triglyceride-rich lipoproteins and reduced HDL cholesterol production are commonly observed in patients with reduced kidney function [38]. Additionally, altered insulin secretion, clearance, and sensitivity caused by uremia, metabolic acidosis, and dialysis in CKD contribute to glycemic variability [39]. In a prospective cohort study, elevated visit-to-visit BP variability was found to be more prevalent in patients with CKD [19]. Moreover, the effect of elevated metabolic variability in patients with CKD may be particularly important given the higher risk of adverse cardiovascular outcomes in this population [40]. However, whether the association between metabolic variability and cardiovascular risk is intensified in those with impaired kidney function, compared to those with preserved eGFR, has rarely been investigated. Herein, we demonstrated that the risks of cardiovascular outcomes and mortality according to metabolic variability increased further, corresponding to baseline eGFR. The strength of our study is that 1) we examined a large-scale general population cohort including >10 million individuals and a large number of CKD patients; 2) major cardiovascular and mortality outcomes were assessed by implementing a nationwide claims database; and 3) we performed detailed stratification by metabolic components and eGFR values, directly measured in the general health screenings. Based on our results, we suggest that the adverse linkage between metabolic variability and risks of mortality or adverse cardiovascular events may be strengthened in patients with kidney function impairment.
In this study, we again confirmed that the risk of cardiovascular events and death in patients with high metabolic component variability was higher than that in those with low variability in this large-scale cohort. In addition, metabolic variability was generally higher in patients with a lower GFR category, supporting the clinical importance of metabolic variability in those with kidney function impairment. We further identified that the interaction by eGFR categories was significant for the association between metabolic variability and adverse outcome risk, and the degree of association was greater in those with lower eGFR levels. This finding suggests that individuals with kidney function impairment are not only at higher risk of metabolic fluctuation but also that the cardiovascular and mortality risks related to metabolic variability would be intensified by their reduced eGFR values. Therefore, our study demonstrates that the aim of intervention for metabolic components in patients with CKD should be focused on both lowering the components to the target level and reducing the fluctuation. Furthermore, greater attention should be paid to patients with advanced CKD, as the synergistic adverse effect of lower eGFR and high metabolic variability was observed in this population-scale evidence.
This study had several limitations. First, due to the observational nature of the study, the remaining confounding effects and reverse causation between baseline eGFR and metabolic component variability may be present. To minimize reverse causality, we excluded subjects with a history of MI or ischemic stroke. Second, the grading of kidney function was limited to baseline eGFR. Although the severity of albuminuria should also be evaluated when assessing kidney function, it was excluded because the NHIS database does not include quantitative data on albuminuria. Third, our study population was limited to Koreans; therefore, the generalizability of our findings may be limited. Fourth, there may be heterogeneity in the measurement modalities between medical centers. Finally, there is a potential selection bias because not all eligible individuals receive regular health screenings and individuals with worse health conditions are more likely to undergo medical examinations.
In summary, this large-population observational study showed the intensified risks of all-cause mortality, MI, and ischemic stroke according to the metabolic component variability observed in patients with lower baseline eGFR. Further studies are warranted to investigate the clinical efficacy of reducing metabolic variability to ameliorate cardiovascular risks, particularly in CKD patients.

 PDF Links
 PubReader
 ePub Link
 Full text via DOI
 Download Citation
 Supplement table 1
 Print
Print


")


