


Introduction
Chronic kidney disease (CKD) is an emerging medical burden worldwide and is associated with high cardiovascular (CV) and mortality risks [1]. Early identification and management of patients at high risk of CKD are crucial to improve their prognosis. Notably, abnormal lipid metabolism contributes to the decline in kidney function [2]. Thus, lipid-lowering therapy and prevention of metabolic syndrome have been suggested to slow the decline in kidney function [3,4]. However, the relationship between abnormal lipid profiles and kidney dysfunction remains unclear. Furthermore, the atherogenic indices among lipid profiles that primarily contribute to the development and progression of CKD remain controversial.
Atherogenic indices are indicators of abnormal lipid metabolism and are assessed by various ratios of lipid profiles, including the atherogenic index of plasma (AIP), which is calculated as the logarithmically transformed molar ratio of triglyceride (TG) to high-density lipoprotein cholesterol (HDL-C) [5]. Recent studies have compared the usefulness of these atherogenic indices in predicting adverse CV events and mortality. Among these, AIP has been identified as a novel and useful marker for atherosclerosis and CV disease [6,7]. For kidney disease, few studies have found an association between atherogenic indices and kidney function. A cross-sectional study using the National Health and Nutritional survey (2009–2016) data showed that AIP was negatively correlated with the estimated glomerular filtration rate (eGFR) [8]. Moreover, a longitudinal study with a Japanese cohort found that a high TG to HDL-C ratio was significantly associated with the risk of the development and progression of CKD in participants with or without CKD [9]. Nevertheless, evidence of abnormal lipid metabolism and kidney outcome is still lacking. In particular, the role of atherogenic indices in individuals with underlying metabolic derangements in kidney function remains unclear [10–12].
Therefore, this study aimed to investigate the role of atherogenic indices, including AIP, on the development and progression of CKD in adults with metabolic derangements.
Methods
This study was approved by the Institutional Review Board of Gangnam Severance Hospital (No. 3-2020-0114) and conducted in accordance with the Declaration of Helsinki. The requirement for written informed consent was waived due to the study’s retrospective nature.
Data source and study population
This study used data from the Gangnam Severance Medical Cohort (GSMC, 2006–2021). The GSMC data is a retrospective cohort study consisting of patients who visited Gangnam Severance Hospital (a tertiary university hospital in Seoul, South Korea) with at least one metabolic derangement including diabetes mellitus (DM), fatty liver, and hypertension (HTN). The definition of each metabolic derangement is described in Supplementary Methods (available online). The aim of establishing the GSMC data was to identify risk factors and assess the outcomes of metabolically unhealthy individuals residing in the urban area of South Korea. The GSMC cohort was combined by each sub-cohort including DM (n = 2,021), fatty liver (n = 4,287), and HTN (n = 2,709). The sub-cohort was determined by the disease category based on the diagnosis of each specialist (endocrinologist, gastroenterologist, and cardiologist) or the prescription of medication. Finally, 9,017 participants who regularly visited the Gangnam Severance Hospital every 3 to 6 months between 2006 and 2021 were enrolled in the GSMC data. For this study, participants who were under 18 years of age, whose medical records and laboratory data were missing, whose baseline eGFR of <15 mL/min/1.73 m2, who had already been on renal replacement therapy, or whose follow-up duration was less than 90 days were excluded. After exclusion, a complete case data set was used for the study analysis. Consequently, a total of 4,176 participants were analyzed in this study (Fig. 1). The participants of this cohort were followed up at least at intervals of 90 days, from the date of their first visit and blood sampling, until the earliest date of 1) incident occurrence of the composite kidney outcome, 2) all-cause death, and 3) censoring (censoring for loss to follow-up or end of the study).
Variables and definition
Demographic data, past medical history, and laboratory data were collected from medical records at the time of study enrollment. Demographic data included age, sex, status of smoking and alcohol, body mass index (BMI), systolic blood pressure (SBP), and diastolic blood pressure (DBP). Data on medical history, including HTN, DM, coronary artery disease (CAD), cerebral infarction, dyslipidemia, and fatty liver were collected. The medical history was primarily determined based on the presence of cases corresponding to the codes of the International Classification of Diseases, 10th revision (ICD-10). Additionally, cases that satisfied the diagnostic criteria for each specific disease were also considered in the determination of medical history. Detailed methods including ICD-10 codes used for searching the medical history records are in Supplementary Methods and Supplementary Table 1 (available online). Laboratory data included serum levels of hemoglobin, albumin, creatinine, fasting plasma glucose, total cholesterol (TC), low-density lipoprotein cholesterol (LDL-C), HDL-C, and TG. The eGFR was calculated using the Chronic Kidney Disease-Epidemiology Collaboration equation [13]. Proteinuria and albuminuria were assessed by analyzing a spot urine sample using the urine protein to creatinine ratio (UPCR) and urine albumin to creatinine ratio (UACR). Atherogenic indices were defined as the ratio of lipid profiles: AIP was calculated from the log-transformed molar ratio value of TG/HDL-C (log[TG (mmol/L)/HDL-C (mmol/L)]), TC/HDL-C, LDL-C/HDL-C, and non-HDL-C/HDL-C. Each atherogenic index was stratified into quartiles and also treated as a continuous value.
Study outcome
The study endpoint was the composite kidney outcome defined as a composite of eGFR <60 mL/min/1.73 m2 in at least two measurements among the participants with baseline eGFR of ≥60 mL/min/1.73 m2, ≥30% decrease in eGFR from baseline among the participants with baseline eGFR of <60 mL/min/1.73 m2, or initiation of dialysis or kidney transplantation.
Statistical analyses
Continuous variables are expressed as mean ± standard deviation (SD) or median (interquartile range [IQR]), and categorical variables are expressed as absolute numbers (%). The groups were compared using analysis of variance for continuous variables and the chi-square test or Fisher exact test for categorical variables. The Kolmogorov-Smirnov test was conducted to determine the normality of the distribution of parameters. If the resulting data did not show a normal distribution, the geometric mean ± SD was reported. The association between atherogenic indices, including AIP and composite kidney outcome, was evaluated using multivariable Cox proportional hazards regression and Kaplan-Meier curves with log-rank tests. Hazard ratios (HRs) for composite kidney outcome were assessed using atherogenic indices as quartiles and continuous variables. Variables that showed statistical significance in the univariable analyses or were considered to have clinical significance were included in the multivariable models. Restricted cubic spline analysis was performed to observe the linearity between atherogenic indices and risk of composite kidney outcome. Restrictive cubic splines were used as the smoothing technique, and spline degrees of freedom were selected based on the lowest set. To evaluate the discrimination performance of the multivariable Cox proportional hazards regression models by AIP, Harrell’s concordance index (C-index), net reclassification index (NRI), and integrated discrimination improvement (IDI) of AIP were compared with the traditional risk factors for CKD [14]. The traditional risk factors for CKD were such as age, sex, status of smoking and alcohol, BMI, SBP, hemoglobin, eGFR, medication history of lipid-lowering agents, and past histories of HTN, DM, CAD, cerebral infarction, dyslipidemia, and fatty liver [15–18]. For subgroup analysis, the participants were stratified by age, sex, BMI, and sub-cohorts including DM, fatty liver, HTN, CKD and stages of CKD, and the use of lipid-lowering drugs. Several sensitivity analyses were performed to validate the results of the primary analysis. First, competing risk analysis for composite kidney outcome treating all-cause death as competing risk was performed by a Fine and Gray subdistribution hazard model. Second, multivariable Cox analysis was performed between two groups based on the cutoff value of AIP which increases the risk of composite kidney outcome. Third, the association between AIP levels and the risk of each kidney outcome was separately evaluated in two groups with or without CKD at baseline (whose eGFR <60 mL/min/1.73 m2 or albuminuria at baseline). For all analyses, a value of p < 0.05 was statistically significant. All statistical analyses were conducted using SPSS version 25.0 (IBM Corp.) and Stata version 17 (StataCorp.)
Results
Baseline characteristics
The current study included 4,176 participants. The baseline characteristics are shown according to the composite kidney outcome (non-progressor vs. progressor) (Table 1). The mean age of the overall cohort was 57.0 ± 13.1 years, and 2,585 (61.9%) were male. The progressors had older age, lower BMI, higher proportion of smoking and alcohol status, and higher SBP and DBP than non-progressors. The progressors were more likely to have past histories of HTN, DM, CAD, cerebral infarction, and CKD, while less likely to have fatty liver, and were more frequently using lipid-lowering agents than non-progressors. In the laboratory data, the progressors had lower levels of hemoglobin, albumin, TC, LDL-C, and HDL-C than non-progressors, but the levels of TG and fasting glucose were not significantly different between progressors and non-progressors. Also, the progressors had significantly higher levels of UPCR and UACR than non-progressors. The mean value of AIP in the total study population was 0.5 ± 0.3, and the level of AIP in progressors was significantly higher than that in non-progressors. In the other atherogenic indices, LDL-C/HDL-C showed lower values in progressors than in non-progressors, and TC/HDL-C or non-HDL-C/HDL-C showed no significant difference between progressors and non-progressors.
Atherogenic indices and composite kidney outcome
During the median follow-up of 6.0 years (IQR, 2.5–11.0 years), 1,266 cases (30.3%) of composite kidney outcome occurred (specific kidney events of eGFR <60 mL/min/1.73 m2, 814 [19.5%]; 30% decline in eGFR, 363 [8.7%]; and end-stage kidney disease, 89 [2.1%]). First, the Kaplan-Meier analyses of composite kidney outcome according to the quartiles of atherogenic indices were performed. The risk of composite kidney outcome was significantly higher in the highest quartile of AIP than in the lowest quartile (p = 0.01) (Fig. 2A). Moreover, the risk for composite kidney outcome was significantly decreased in the highest quartile of LDL-C/HDL-C compared with the lowest quartile (p = 0.04) (Fig. 2C). However, the quartiles of TC/HDL-C and non-HDL-C/HDL-C showed no significant association with the risk of composite kidney outcome (p = 0.53 in TC/HDL-C and p = 0.53 in non-HDL-C/HDL-C) (Fig. 2B, D).
Next, multivariable Cox regression analyses for composite kidney outcome according to atherogenic indices were performed after adjustment for traditional risk factors such as age, sex, status of smoking and alcohol, BMI, SBP, hemoglobin, eGFR, medication history of lipid-lowering agents, and past histories of HTN, DM, CAD, cerebral infarction, dyslipidemia, and fatty liver. In multivariable Cox models, only AIP showed significant results; the highest quartile of AIP was associated with a higher risk of composite kidney outcome compared with the lowest quartile (HR, 1.31; 95% CI, 1.12–1.54; p = 0.001 in the highest quartile of AIP) (Table 2). A similar association was observed when AIP was treated as a continuous variable (HR per 1.0 increased in AIP levels, 1.51; 95% CI, 1.21–1.88; p < 0.001) (Table 2). Although the highest quartile of LDL-C/HDL-C showed a decreased risk of composite kidney outcome, no significant association was observed in the multivariable Cox regression model (HR, 0.94; 95% CI, 0.79–1.10; p = 0.43 in the highest quartile of LDL-C/HDL-C) (Table 2). A similar trend was observed when LDL-C/HDL-C was treated as a continuous variable (HR per 1.0 increase in LDL-C/HDL-C levels, 1.00; 95% CI, 0.94–1.06; p = 0.83). Other indices, including TC/HDL-C and non-HDL-C/HDL-C, showed no significant association with the composite kidney outcome when treated as quartiles and continuous variables.
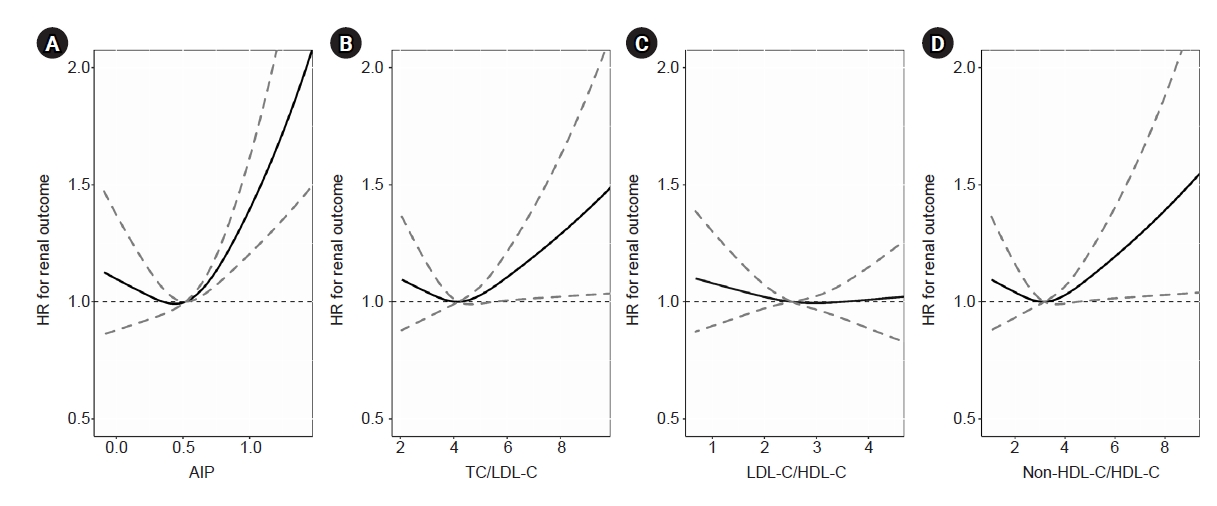
Finally, restricted cubic spline curve analyses were performed to evaluate the linear relationship between the risk of composite kidney outcome and atherogenic indices. Only the AIP levels revealed a significant linear association, and the HRs for the composite kidney outcome significantly increased with increasing AIP levels. The cutoff value of the AIP that increased the risk of composite kidney outcome was 0.51 (Fig. 3).
Incremental prognostic value of atherogenic index of plasma over the risk factors of composite renal outcome
Table 3 shows the incremental prognostic value of AIP compared to the traditional risk factors for CKD (model 1) and traditional risk factors plus eGFR (model 2). The traditional risk factors for CKD were such as age, sex, status of smoking and alcohol, BMI, SBP, hemoglobin, eGFR, medication history of lipid-lowering agents, and past histories of HTN, DM, CAD, cerebral infarction, dyslipidemia, and fatty liver. The C-index (0.773; 95% CI, 0.760–785; p < 0.001), NRI (0.064; 95% CI, 0.011–0.110; p = 0.03), and IDI (0.004; 95% CI, 0.001–0.010; p = 0.02) were significantly improved with the addition of AIP to the traditional risk factors plus eGFR model (model 3).
Subgroup analyses
To investigate whether the association between AIP and composite kidney outcome was robust in the sub-population, a subgroup analysis was performed (Fig. 4). Participants were stratified by age (<50 years vs. ≥50 years), sex (male vs. female), BMI (<25 kg/m2 vs. ≥25 kg/m2), and sub-cohorts by DM, fatty liver, HTN, CKD (no vs. yes), stages of CKD (stages 1–2, 3A, 3B, and 4), and the use of lipid-lowering agents (no vs. yes). When AIP was treated as a continuous variable, no significant interaction between AIP and each subgroup for the composite kidney outcome was found (p for interaction > 0.05, for all subgroups). This finding suggested that AIP significantly increased the risk of composite kidney outcome regardless of subgroup.
Sensitivity analyses
Several sensitivity analyses were performed to validate the main findings. Firstly, when competing risk analysis for composite kidney outcome treating all-cause death as competing risk, cumulative incidences showed that the highest quartile of AIP and the lowest quartile of LDL-C/HDL-C were significantly associated with an increased risk for composite kidney outcome (Supplementary Fig. 1, available online). After adjustment for covariates, only AIP showed significant results that high AIP levels were associated with an increased risk for composite kidney outcome (subdistribution HR [SHR], 1.27 [95% CI, 1.09–1.51]; p = 0.003, in the highest quartile; SHR per 1.0 increase in AIP, 1.44 [95% CI, 1.15–1.78]; p < 0.001) (Supplementary Table 2, available online). Secondly, we evaluated the characteristics between groups based on the cutoff value of AIP (<0.51 or ≥0.51) which was determined by restricted cubic spline analysis between AIP levels and composite kidney outcome. The group with AIP ≥0.51 were younger, more likely to be male, smoker, drinker, and had higher BMI and DBP levels than those with AIP <0.51. Moreover, the group with AIP ≥0.51 was more likely to have medical histories including HTN, DM, dyslipidemia, and CKD. In the laboratory data, the group with AIP ≥0.51 showed higher levels of TC, LDL-C, TG, and fasting plasma glucose than those with AIP <0.51. In the aspect of atherogenic indices, the levels of AIP, TC/HDL-C, LDL-C/HDL-C, and non-HDL-C/HDL-C were higher in AIP ≥0.51 group (Supplementary Table 3, available online). When the risk for composite kidney outcome was compared using the multivariable Cox model between groups with AIP <0.51 and ≥0.51, the group with AIP ≥0.51 showed significantly higher risk than those with AIP <0.51 (HR, 1.52; 95% CI, 1.28–1.80; p < 0.001) (Supplementary Table 4, available online). Lastly, to further investigate whether the association between high AIP levels and an increased risk of composite kidney outcome are differed by the baseline kidney function, multivariable Cox regression analysis was performed separately in the group without underlying CKD (whose baseline eGFR of ≥60 mL/min/1.73 m2 and no albuminuria at baseline) or in group with CKD (whose baseline eGFR of <60 mL/min/1.73 m2). In both groups, only the highest quartile of AIP was significantly associated with an increased risk of kidney outcomes. These results were consistent when AIP levels were treated as a continuous variable (Supplementary Table 5, 6; available online).
Discussion
In this study, we examined the association between various atherogenic indices including AIP and the risk of composite kidney outcome. Among the atherogenic indices, only high AIP levels were significantly associated with a high risk of composite kidney outcome. When adding AIP levels to the risk prediction model for composite kidney outcome, including traditional risk factors plus eGFR, the predictive value was significantly improved. Additionally, subgroup analysis stratified by age, sex, BMI, and sub-cohorts such as DM, fatty liver, HTN, CKD, and the use of lipid-lowering agents yielded consistent results; the high AIP levels with increased risk for composite kidney outcome were regardless of subgroup.
Numerous prospective cohort and cross-sectional observational studies conducted in the general population have found associations between different types of dyslipidemia and declining kidney function. The abnormality of lipid profile is a pathophysiological condition that is strongly linked to kidney damage, which can occur even in the early stages of kidney dysfunction and tends to worsen as CKD progresses [2]. Especially, high TG, low HDL-C level, and high TC/HDL-C ratio were significantly associated with an increased risk of developing decreased kidney function [10,11,19]. Hou et al. [20], in a cross-sectional study, have demonstrated that high TG levels are closely related to the risk of mildly decreased eGFR in the Chinese healthy general population. Interestingly, the association between TG levels and eGFR was consistent in participants with normal serum lipid profiles. This finding implies that elevated TG levels could appear in the early stages of kidney dysfunction. Furthermore, results of a longitudinal study of the Japanese general population supported that hypertriglyceridemia is independently associated with the development of CKD [21] and proteinuria [22]. Regarding HDL-C level, Bowe et al. [23] noted from a cohort of male US veterans that low HDL-C is significantly associated with the risk of incident CKD and CKD progression. Moreover, a recent Mendelian randomization study, using the largest lipid and CKD cohorts, showed that the HDL-C reduces the risk of development of CKD and decline in eGFR, but not the quantitative increase in albuminuria [24]. Prior studies have identified that the higher ratio of TG and HDL-C levels was associated with the decline in kidney function, proteinuria, development, and progression of CKD in longitudinal and cross-sectional studies in the general population for a relatively short period of time [9,25,26]. Although there have been studies regarding the association between the individual or simple ratio of lipid profiles and kidney outcome in the general healthy population or lipid and CKD cohorts, no studies have been conducted on participants with metabolic derangements. Moreover, no longitudinal cohort studies on the association between AIP and composite kidney outcome in the population with metabolic derangements have been reported until now. Zhou and Shang [8], in a cross-sectional observational study based on the national health and nutrition examination survey of 15,836 participants of the general population from 2009 to 2016, reported not only a linear association between AIP and reduced eGFR, but also the ability of AIP to optimize the risk stratification of reduced eGFR. However, because the results originated from a cross-sectional design, there are limitations to explaining the causality between AIP and reduced eGFR. Another study by Yuan et al. [27], which consisted of 2,485 participants from a cross-sectional study and a small longitudinal cohort of adolescent and young adults from a Chinese healthy general population, indicated that elevated AIP increased the risk of developing subclinical kidney damage and was associated with UACR and eGFR; however, there were some limitations with regard to the number of participants in the longitudinal cohort (approximately 338 participants), which was too small and there was no robust analysis in the evaluation of the predictive value of AIP about the kidney function decline and progression of CKD. In our study with large numbers of adults with at least one metabolic derangement, high AIP significantly increased the risk of composite kidney outcome regardless of subgroups with metabolic derangements. Our study findings suggest that AIP may be a simple predictor of CKD development and progression in all types of metabolic derangements, including DM, fatty liver, and HTN.
The underlying pathogenic mechanism of AIP with increased risk of kidney outcome is unclear. However, there are several possible explanations. First, AIP may serve as an indirect indicator for the size of LDL-C particles, which is associated with a higher risk of atherogenicity [2,5]. In a study involving 1,433 participants from 35 different cohorts with various atherosclerosis risk factors such as HTN, DM, and dyslipidemia, a robust positive association was found between the AIP and the cholesterol esterification rate in apolipoprotein-B-lipoprotein–depleted plasma, which is an indirect measurement of LDL-C particle size [5]. This result indicates that AIP is directly linked to the risk of atherosclerosis and can be used as a marker of plasma atherogenicity. Previous experimental pilot studies confirmed the close association between AIP and lipoprotein particle size, as well as free cholesterol esterification rate [5,28–32]. Decreased level of HDL-C leads to reduced reverse cholesterol transportation and results in the accumulation of lipids in glomeruli [33]. As a result, the accumulation of the foam cells leads to glomerulosclerosis and progression of kidney dysfunction [2,34]. Thus, AIP may be a potential marker for predicting kidney damage due to the possibility of an increase in the proportion of small and dense lipoprotein particles, along with elevated esterification rates. Another possible explanation is that a high AIP level is associated with insulin resistance, which is a known risk factor for kidney disease [35–37]. Recent studies showed that the ratio of plasma TG/HDL-C was found to be a predictor of insulin resistance [35]. Insulin resistance increases the concentrations of TG and HDL-C, and in turn, the AIP may affect insulin secretion, β-cell dysfunction, and cause poor glycemic control in patients with DM [36]. As a result, simultaneous association with insulin resistance and faster insulin secretory loss leads to poor glycemic control and reduces liver TG synthesis, LDL-C export, as well as lipolysis of TG-rich particles via affecting lipoprotein lipase. Furthermore, previous studies showed that AIP played a critical role in predicting the risk of development of CAD and fatty liver disease, and acute ischemic stroke, which are resulting from insulin resistance [37–39]. Therefore, AIP may indirectly increase the risk of kidney disease by insulin resistance [40].
The present study had some limitations. First, because of the nature of retrospective studies, causality between AIP and composite kidney outcome cannot be concluded. It is unclear whether the correction of AIP to a normal level reduces the risk of composite kidney outcome. Second, although the study population contained a real-world cohort of participants with metabolic derangements, selection bias might have occurred because the participants were derived from only one center-based cohort. Third, the glomerular filtration rate was not directly measured by the gold-standard method using inulin clearance. Instead, serum creatinine-based eGFR equation was used and this may have overestimated or underestimated the actual glomerular filtration rate. Fourth, our analyses were performed only with the Asian population. Thus, caution is needed to generalize the study results to other ethnics.
In conclusion, the present study demonstrated that high AIP was associated with an increased risk of composite kidney outcome in patients with metabolic derangements. The addition of AIP to the known traditional risk factors for the development and progression of CKD improved the prognostic value of composite kidney outcome. These findings suggest that AIP may be useful for predicting CKD development and progression.


 PDF Links
 PubReader
 ePub Link
 Full text via DOI
 Download Citation
 Supplement 1
 Print
Print


")


