


Introduction
Insulin resistance is defined as reduced sensitivity of target organs to the effects of insulin, leading to a compensatory rise in circulating insulin to maintain normal blood glucose levels [1–3]. Insulin resistance contributes to obesity, type 2 diabetes mellitus (DM), hypertension (HTN), and metabolic syndrome [4–6]. Insulin resistance is prevalent in both diabetic and nondiabetic patients with chronic kidney disease (CKD) and end-stage renal disease (ESRD) [7–9]. Insulin resistance itself may also accelerate the progression of CKD. For instance, one study reported that insulin resistance was directly related to low glomerular filtration rate (GFR) [10], and another study reported that insulin resistance was associated with the progression of immunoglobulin A nephropathy [11]. However, the precise mechanisms by which insulin resistance affects renal dysfunction in CKD remain poorly identified. Further, the association between insulin resistance and renal dysfunction in a population with normal renal function is not unclear.
For assessment of insulin resistance, the hyperinsulinemic euglycemic glucose clamp is the gold standard because it directly measures the effects of insulin to promote glucose utilization under steady state [12]. However, the complexity of the methodology and labor-intensive procedure limits its use. Therefore, a simple index for insulin resistance, such as homeostasis model assessment-insulin resistance (HOMA-IR), is widely used in clinical studies [13]. There are also several other indices including the quantitative insulin sensitivity check index (QUICKI), homeostasis model assessment-adiponectin (HOMA-AD), and leptin-adiponectin ratio (LAR) [4,14].
In this study, we aimed to investigate whether insulin resistance is associated with the development of incident CKD in the general population from the Korean Genome and Epidemiology Study (KoGES), which is a community-based prospective cohort study [15]. We also evaluated the difference in the effects of insulin resistance indices on the development of incident CKD.
Methods
This study was performed in accordance with the Declaration of Helsinki and was approved by the Institutional Review Board of Chonnam National University Hospital (No. CNUH-EXP-2022-140). All the study participants voluntarily enrolled in this study after providing informed consent.
Study population
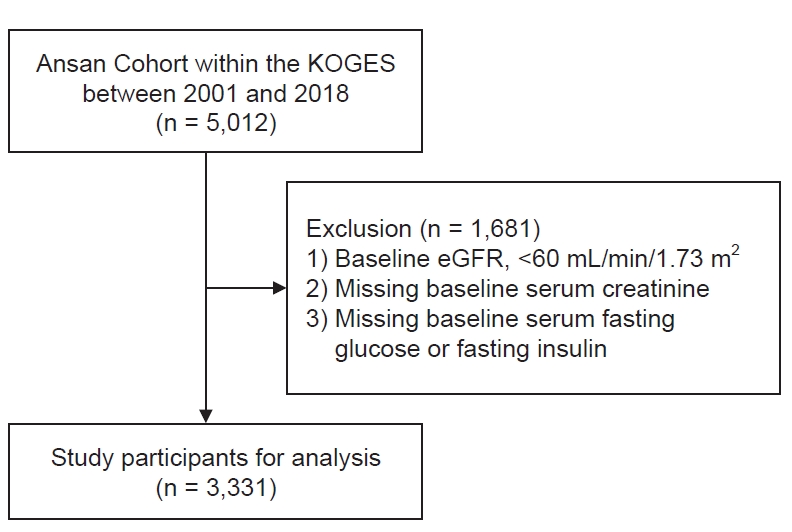
The KoGES is a large prospective community-based cohort study funded by the government. The detailed profile and methods concerning the development of KoGES have been previously described [15]. In this study, participants who were residents of Ansan, which is a city in the Republic of Korea, were recruited from the KoGES cohort population. A total of 5,012 participants (age range, 40–69 years) were recruited. Serial health examinations and surveys were performed biennially from 2001 to 2018. From the study database, we excluded those with estimated GFR (eGFR) of <60 mL/min/1.73 m2. We also excluded those with missing baseline serum creatinine and missing baseline serum fasting glucose or fasting insulin. A total of 3,331 participants were included in the final analysis (Fig. 1).
Anthropometric and laboratory data
All participants underwent comprehensive medical health examinations and filled out questionnaires on health and lifestyle at the time of enrollment. Demographic and socioeconomic data, including age, sex, alcohol intake, smoking status, and medical histories were obtained. HTN was diagnosed on the basis of the responses to the past medical history in the administered questionnaire. Anthropometric parameters such as height and body weight were measured by skilled study workers following standard methods. Blood and urine samples were obtained after an 8-hour fasting and transported to a central laboratory (Seoul Clinical Laboratories, Seoul, Republic of Korea). The following biochemical data were determined using fasting blood samples: concentrations of blood urea nitrogen, creatinine, albumin, glucose, total cholesterol, triglyceride, low-density lipoprotein cholesterol, high-density lipoprotein cholesterol, hemoglobin A1c, hemoglobin, and C-reactive protein. Serum creatinine levels were measured using an isotope dilution mass spectrometry-traceable method. The eGFR was calculated by using CKD-EPI (Chronic Kidney Disease Epidemiology Collaboration) equation [16].
Total serum adiponectin and leptin concentrations were measured using a commercially available enzyme-linked immunosorbent assay (ELISA) kit (Mercodia). Insulin was measured in the fasting serum samples using an immunoradiometric assay (Gammar Counter_Cobra; Packard).
Insulin indices, study outcomes, and definitions
Insulin resistance was determined by the HOMA-IR: fasting glucose (mg/dL) × fasting insulin (µIU/mL)/405 [13]. The other insulin resistance indices were also calculated: QUICKI, 1 / (log fasting glucose [mg/dL] + log fasting insulin [µIU/mL]); HOMA-AD, fasting glucose (mg/dL) × fasting insulin (µIU/mL) / (405 × adiponectin [mg/mL]); and LAR, leptin (mg/mL) / adiponectin (mg/mL). The higher the HOMA-IR, HOMA-AD, and LAR levels, the higher the insulin resistance. On the other hand, the lower the QUICKI level, the higher the insulin resistance [4].
The endpoint was incident CKD, which was defined as a composite eGFR of <60 mL/min/1.73 m2 during the follow-up period. In our study, we defined the ‘high group’ as individuals with a HOMA-IR level greater than the 75th percentile value for participants, and the level was >1.9.
Statistical analysis
Statistical analyses were performed using R version 4.0.2 (R Foundation for Statistical Computing). Continuous variables are expressed as mean ± standard deviation, and categorical variables as number (percentage). All data were tested for normality before the statistical analysis. A t test or Mann-Whitney U test was conducted to compare continuous variables. Meanwhile, the chi-square test was performed to compare categorical variables. We used a restricted cubic spline curve to illustrate the nonlinear association between the HOMA-IR level and the risk of incident CKD. We used four knots for the restricted cubic spline curve. The Kaplan-Meier survival curves with log-rank tests and a univariate Cox proportional hazards model were used to examine the effect of HOMA-IR level on incident CKD. Multivariate Cox proportional hazards regression analysis was used to assess independent variables with incident CKD. Hazard ratios (HRs) and 95% confidence intervals (CIs) were calculated to estimate the risk of incident CKD. We examined the as sumption of the proportional hazard in the Cox model using cox.zph() in R. Age and sex-adjusted HRs were first calculated (model 1), and the results were further adjusted for HTN, body mass index (BMI), and total cholesterol (model 2). The results were further adjusted for alcohol drinking, smoking status, and baseline eGFR (model 3). For all analyses, a p-value of <0.05 was considered statistically significant.
Results
Baseline characteristics of the study population
The participants’ baseline characteristics according to their HOMA-IR level are presented in Table 1. We defined the ‘high group’ as individuals with a HOMA-IR level of >1.9. Participants in the high group were predominantly male (54.0% vs. 48.7%, p = 0.008), had a higher incidence of HTN (17.6% vs. 9.5%, p < 0.001), had a higher serum creatinine (0.9 mg/dL vs. 0.8 mg/dL, p < 0.001), had a higher hemoglobin (13.9 g/dL vs. 13.6 g/dL, p < 0.001), had a higher total cholesterol (202.1 mg/dL vs. 193.9 mg/dL, p < 0.001), and had a higher BMI (26.0 kg/m2 vs. 24.2 kg/m2, p < 0.001) than those in the normal group.
Risk of incident chronic kidney disease by homeostasis model assessment-insulin resistance
During a mean follow-up of 11.03 ± 4.22 years, incident CKD occurred in 414 participants (12.4%). We created a Cox regression model using a restricted cubic spline curve to assess the association between HOMA-IR level and HR of incident CKD (Fig. 2). The HOMA-IR level exhibited a positive correlation with incident CKD risk.
Multivariable Cox proportional hazard models were used to determine whether HOMA-IR level and falling into the high HOMA-IR group were independent risk factors for incident CKD (Table 2). After adjustment for age, sex, history of HTN, BMI, total cholesterol, alcohol drinking status, smoking status, and baseline eGFR, the risk of incident CKD increased with higher HOMA-IR levels (HR, 1.13; 95% CI, 1.05–1.22; p = 0.001). Compared with the normal group, the high group had an increased risk of incident CKD (HR, 1.40; 95% CI, 1.13–1.74; p = 0.002).
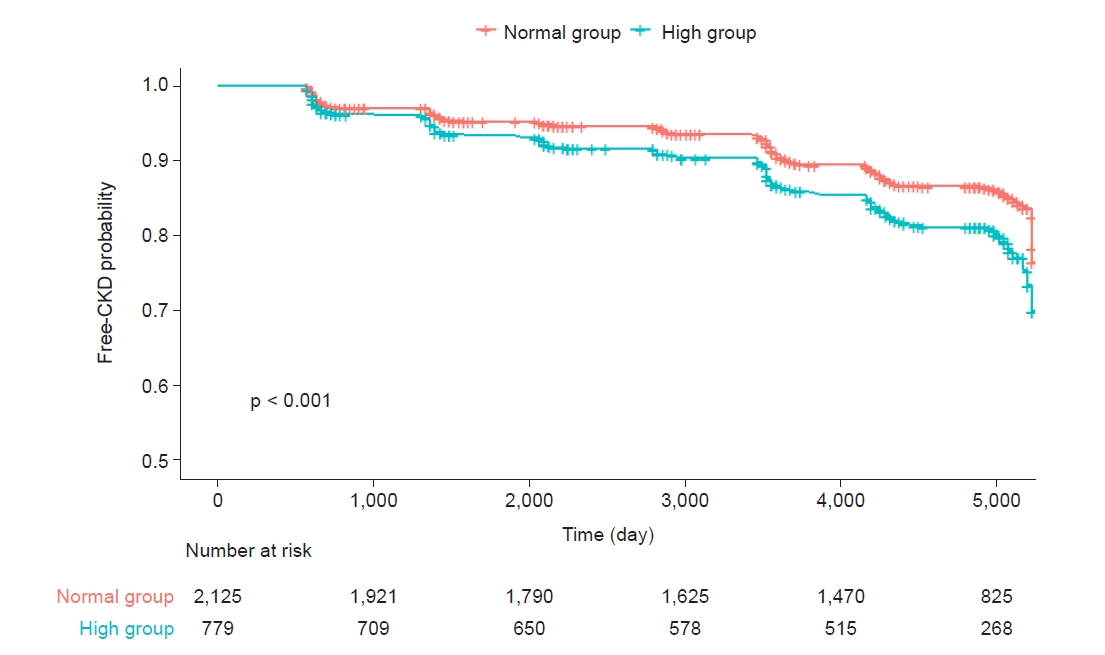
The Kaplan-Meier curves for free-CKD probability according to the normal and high groups are shown in Fig. 3. The high group showed a significantly higher risk for the development of CKD compared to the normal group (p < 0.001).
Impact of insulin resistance indices on incident chronic kidney disease
Next, we evaluated the association between other insulin resistance indices and the risk of incident CKD. Multivariable Cox proportional hazard models were used to determine whether insulin resistance indices were independent risk factors for incident CKD (Table 3). After adjustment for age, sex, history of HTN, BMI, total cholesterol, alcohol drinking status, smoking status, and baseline eGFR, the risk of incident CKD increased with the lower QUICKI levels (HR, 0.62; 95% CI, 0.41–0.92; p = 0.02) and higher LAR level (HR, 1.23; 95% CI, 1.06–1.42; p = 0.006).
Subgroup analyses
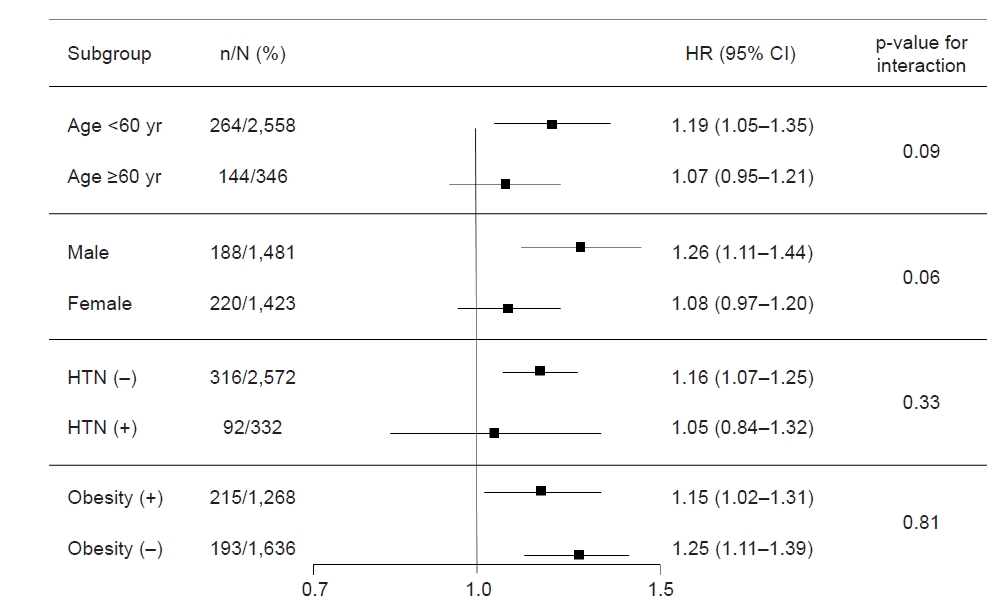
To evaluate whether the association of HOMA-IR level and the risk of incident CKD is modified by subgroups, we conducted subgroup analyses (Fig. 4). The subgroups were stratified by age (<60 or ≥60 years), sex, HTN, and obesity (BMI ≥25 kg/m2 or <25 kg/m2). Cox regression analysis regarding the association between HOMA-IR level and the risk of incident CKD revealed that p for interaction was >0.05 for all subgroups, suggesting that the association of high HOMA-IR level with increased risk of incident CKD is not modified by these factors.
Discussion
In this study, we identified a significant positive association between increased insulin resistance and incident CKD in a population with normal renal function. Higher HOMA-IR levels significantly increased the risk of incident CKD in multivariable analyses. Moreover, higher LAR levels and lower QUICKI levels also increased the risk of incident CKD. These findings suggest that management of insulin resistance is helpful in preserving renal function even in a population with normal renal function. In addition, our subgroup analyses showed that insulin resistance had an effect on incident CKD regardless of age, sex, and HTN. This result reinforces that management of insulin resistance is important in the general population.
Our findings are consistent with those of the previous community-based studies that investigated the cross-sectional association of insulin resistance and GFR [10,17]. These studies assessed the insulin resistance by HOMA-IR or hyperinsulinemic euglycemic glucose clamp, and increased insulin resistance was found to be associated with low GFR. However, these studies had limitations of being cross-sectional studies. Our study is noteworthy because of long-term follow-up performing survival analysis.
Insulin resistance has been suggested to contribute to the development of renal impairment via numerous different pathophysiologic pathways. Hyperglycemia and hyperinsulinemia promote the expression and activation of insulin-like growth factor (IGF)-1, transforming growth factor beta (TGF-β), and endothelin-1 whose profibrotic activity leads to increased production of extracellular matrix by mesangial cells [18,19]. Insulin and IGF-1 molecules are similar; thus insulin can act on the IFG-1 receptors and promote vascular proliferation through both enhancing IGF-1 production and stimulating its receptors [20]. Insulin also stimulates TGF-β1 production from the proximal tubule cells, leading to an increase in type IV collagen gene expression and its accumulation in the extracellular matrix [21].
Insulin resistance and hyperinsulinemia are also associated with oxidative stress. Oxidative stress is defined as a disturbance in the normal homeostatic balance between reactive oxygen species and antioxidant substances [22]. Glucose control plays an important role in the homeostatic balance, and hyperglycemia is well known to cause oxidative stress through various mechanisms: glucose autoxidation, protein glycation and formation of advanced glycation end products, and the polyol pathway [23]. Oxidative stress plays an important role in tubulointerstitial fibrosis and glomerulosclerosis by myofibroblast activation, mesangial sclerosis, and parietal epithelial cell injury [24]. Increased oxidative stress has been reported in patients with stage 3 to 5 CKD, especially in patients with DM and hypercholesterolemia [25].
Insulin resistance is associated with increased activity of proinflammatory cytokines that contribute to increased risk of endothelial dysfunction and atherosclerosis [1]. Endothelial dysfunction and arterial stiffness are pervasive in CKD and ESRD and are themselves risk factors for renal deterioration. Endothelial dysfunction exacerbates renal interstitial fibrosis through increased fibroblast proliferation and collagen production [26]. Endothelial dysfunction and atherosclerosis are powerful predictors of cardiovascular mortality in a population with CKD. Several studies suggest that insulin resistance is associated with the risk of cardiovascular disease in patients with CKD by contributing to the pathogenesis of atherosclerosis, endothelial dysfunction, and chronic inflammation [1,27–29]. In a prior study, HOMA-IR predicted cardiovascular mortality in patients with ESRD [29].
HOMA-IR has been reported to contribute to the progression of renal dysfunction in patients with CKD [30,31]. However, our study has certain strengths and originalities including a large sample size, prospective study design, community-based study, and long-term follow-up performing survival analysis. Moreover, not only HOMA-IR but also other insulin resistance indices were used to estimate insulin resistance. This study has some limitations. HOMA-IR is calculated from a single measurement of serum glucose and insulin; hence, it cannot reflect the changes in beta cell dysfunction over time. Further, although the gold standard method to measure insulin resistance and changes in beta cell dysfunction is the hyperinsulinemic euglycemic glucose clamp, we did not use the method. However, in the real practice world, it is a complex and labor-intensive procedure to use. We suggest the usefulness of insulin resistance indices such as HOMA-IR by identifying the association between insulin resistance indices and incident CKD.
In conclusion, increased insulin resistance was associated with incident CKD in a population with normal renal function. Efforts to reduce insulin resistance, such as weight loss and diet control, can lead to the protection of renal function in a healthy population.

 PDF Links
 PubReader
 ePub Link
 Full text via DOI
 Download Citation
 Print
Print


")


