


Introduction
The prevalence of hypertension is increasing as an emerging worldwide epidemic. Elevated blood pressure directly contributes to various complications, such as ischemic heart disease, heart failure, cerebrovascular disease, and chronic kidney disease (CKD) [1]. One of the major target organs influenced by high blood pressure is the kidney [2], and the second-most common cause of kidney failure is well-known to be hypertensive nephrosclerosis [3]. Inadequate control of blood pressure induces a decline in renal function and substantially increases the hypertension-related cardiovascular risk in patients with kidney disease who are already at higher cardiovascular risk [4,5]. Therefore, successful management of high blood pressure is of paramount importance in preserving cardiovascular and renal health; however, the optimal blood pressure target for long-term kidney outcomes is yet to be determined.
Recommendations of the practice guidelines on lowering blood pressure with respect to kidney disease are primarily based on data from secondary analyses of randomized controlled trials (RCTs), in which renal outcomes were considered secondary endpoints. However, results from these studies have been inconclusive about the advantages of intensive blood pressure control regarding the prevention of de novo CKD or attenuation of CKD progression [6ŌĆō11]. As the rapid initial drop in estimated glomerular filtration rate (eGFR) by intensive blood pressure treatment reported in trials might have been predominantly hemodynamically related and reversible, it is pointed out that studies with a longer follow-up duration are necessitated to draw a more definitive conclusion about the effect of intensive blood pressure control on renal outcomes, which is hardly achieved in many RCTs.
To examine the effect of one or more risk factors on subsequent study outcomes, the use of Kaplan-Meier curves or Cox regression techniques may not be suitable in some cases where the effect of the exposure (e.g., hypertension) measured at a single moment on a future event (e.g., CKD) may vary over time, or the estimation may be biased due to uncontrolled time-dependent confounders [12ŌĆō14]. Several analytical methodologies have been implemented to overcome these limitations. While the time-dependent Cox model has been commonly used to deal with time-dependent exposures or outcomes, it is pointed out that this statistical model usually implies short-term effects only [12]. On the other hand, a marginal structural model (MSM) can reflect the effect between time-dependent exposures and a study outcome accumulated over an entire study period [13,15]. In this context, we reported a significant association between incrementally higher systolic blood pressure (SBP) and the risk for incident CKD using the MSM to address time-dependent confounding variables in our previous work [16], which was consistent with observational follow-up studies and subsequent meta-analysis on some of the RCTs that showed a benefit of intensive blood pressure control associated with a reduced risk of kidney function decline [17ŌĆō19]. However, few studies have compared risk estimations between analytical techniques, such as the time-dependent Cox model and the MSM, and considered time-dependent effects with varying follow-up durations.
In this study using the National Health Insurance cohort data, we aimed to examine the association between SBP and the development of CKD among the general population without preexisting kidney disease and to verify whether there would be any differences in the risk estimation among analytical models of the Cox regression model with fixed baseline variables, the time-dependent Cox model, and the MSM.
Methods
This study complied with the Declaration of Helsinki and was approved by the Institutional Review Board of the NHIS Ilsan Hospital (No. NHIMC-2018-06-003). The requirement for informed consent from patients was waived due to the retrospective design of the study.
Study population and design
The second version of the National Health Insurance Service-National Sample Cohort (NHIS-NSC) is a population-based retrospective cohort based on a 2% representative sample of Korean citizens. As Korea operates a single-payer national health system, the NHIS maintains medical records of all inpatient and outpatient visits, including procedures, prescriptions, and death information for all covered individuals. The sampling process by a systematic stratified random sample with proportional allocation within each stratum and the representativeness of the cohort were previously described [20]. Person-level longitudinal data from the NHIS-NSC claims data between January 1, 2009 and December 31, 2015 were used, as the study cohort further included two more years until 2015 since the second version is available from 2017.
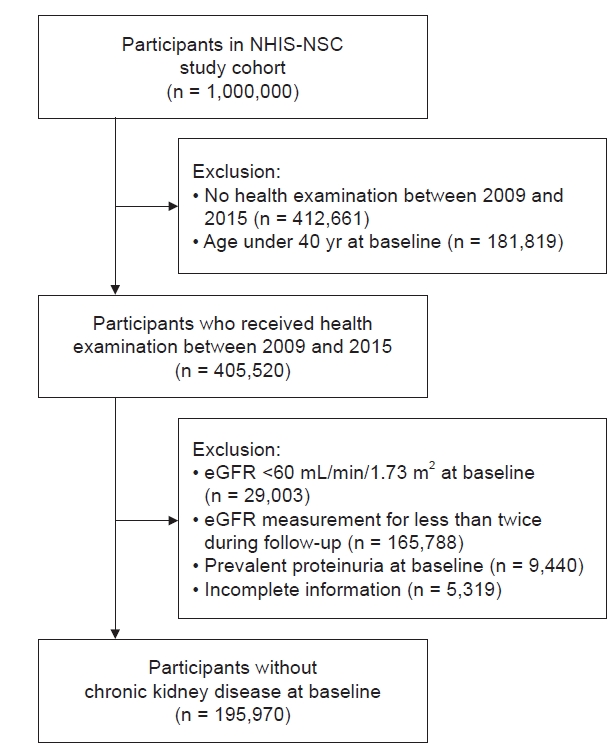
From the NHIS-NSC of 1,000,000 individuals, 405,520 participants aged >40 years who received a health screening examination between 2009 and 2015 were identified. The first health examination was regarded as the baseline if there were multiple examination results during this period. We then further excluded participants with an eGFR of <60 mL/min/1.73 m2 at baseline (n = 29,003), eGFR measurements conducted less than twice during follow-up (n = 165,788), prevalent proteinuria at baseline (n = 9,440), and missing information for baseline variables (n = 5,319) from the study cohort. As a result, a total of 195,970 study participants were included in the analysis (Fig. 1).
Data collection and measurements
Sociodemographic information, including age and sex, was collected at baseline. Comorbid conditions were verified from insurance claims data, which was ascertained by the presence of the following diagnostic codes at least once during a 2-year look-back period based on the International Statistical Classification of Diseases and Related Health Problems, 10th revision (ICD-10) coding algorithm: diabetes (E10ŌĆō14), ischemic heart disease (I20ŌĆōI25), congestive heart failure (I10.1, I13.0, I13.2, I25.5, I42, and I50), peripheral artery disease (I702), cerebrovascular disease (I60ŌĆōI64 and G459), chronic obstructive pulmonary disease (J43 and J44), and malignancy (C00ŌĆōC97). The use of antihypertensives, including angiotensin-converting enzyme inhibitors, angiotensin receptor blockers, diuretics, beta-blockers, calcium channel blockers, and 3-hydroxy-3-methylglutarylŌĆōcoenzyme A reductase inhibitors (i.e., statins) was determined based on the Korean Drug and Anatomical Therapeutic Chemical codes if a prescription for these medications was identified for at least 3 months within the year before the health examination visit. Because of routine audits of the claims by the NHIS, the data are considered reliable and have been used in numerous works of literature [20,21]. The results of free annual or biennial health screening examinations provided by the NHIS, which include a health risk assessment to all insured citizens aged 40 years and above in Korea, with approximately 72% of eligible beneficiaries undergoing screening examinations, were collected, wherein clinical and biochemical parameters and questionnaire-based lifestyle information were obtained. According to relevant national laws and regulations, examination centers are designated and overseen for quality control. Details of the NHIS health examinations are described elsewhere [22]. Trained medical staff measured blood pressure using auscultatory or oscillometric methods according to the standard protocol that recommends at least 5 minutes of rest in a seated position followed by two measurements averaged in a 5-minute interval [23]. The CKD Epidemiology Collaboration equation was used to calculate eGFR using serum creatinine measured by the isotope-dilution mass spectrometryŌĆōtraceable method [24]. Other collected variables included body mass index (kg/m2), smoking status (nonsmoker, past smoker, or current smoker), alcohol consumption (0, 1ŌĆō19, or Ōēź20 g/day), physical activity (low if <600 metabolic equivalent of task [MET]/min, middle if 600ŌĆō3,000 MET/min, or high if >3,000 MET/min), and serum levels of fasting glucose, triglyceride, high-density lipoprotein (HDL) cholesterol, and low-density lipoprotein (LDL) cholesterol. Participants with a high fasting glucose level (Ōēź126 mg/dL) were considered to have diabetes mellitus.
Exposure and outcome
The exposure of interest was time-dependent SBP, which was treated as follows: 1) a continuous variable in 10-mmHg increments and 2) a categorical variable and classified into five groups (<110, 110ŌĆō119, 120ŌĆō129, 130ŌĆō139, and Ōēź140 mmHg). According to the recent clinical practice guideline, we defined the 120ŌĆō129 mmHg category as the reference group based on thresholds to define hypertension [25].
Primary outcome was the development of CKD, defined as a composite of events of a decrease in eGFR to <60 mL/min/1.73 m2 or a newly developed proteinuria, defined as higher than 1+ level from dipstick urine test results, for at least two consecutive measurements separated by at least 90 days during follow-up, according to the definition of CKD in the clinical practice guideline [26]. Secondary outcomes were a decrease in eGFR to <60 mL/min/1.73 m2 for at least two consecutive measurements and a newly developed proteinuria for at least two consecutive measurements, assessed separately. At-risk time began the day after the examination of baseline. Participants who had no event were censored at the date of death, the last health examination, or December 31, 2015, whichever came first.
Statistical analysis
Data from descriptive analyses were summarized as number (percentage), mean ┬▒ standard deviation, or median with interquartile range (IQR), as appropriate. To examine the effects of SBP on the development of CKD, the traditional Cox regression model with SBP at baseline was used. It was adjusted for baseline confounding variables including age, sex, eGFR at study enrollment, the behavioral status of smoking, alcohol consumption, and physical activity, comorbid conditions including diabetes mellitus, ischemic heart disease, congestive heart failure, peripheral arterial disease, cerebrovascular disease, chronic obstructive pulmonary disease, and malignancy, laboratory results of triglycerides, LDL and HDL cholesterol, and medicationsŌĆÖ use of blood pressure- and lipid-lowering drugs at baseline. Covariables were selected a priori on the basis of their possible association with SBP and outcomes. To explore possible collinearity between covariables, we compared regression coefficients, standard errors (in the form of confidence intervals), and variance inflation factors (VIFs) and verified that the VIFs of all covariables were <10. To assess the relationship between SBP and the outcome while accounting for changes in SBP over time and to reflect potential time-dependent confounding, we used the time-dependent Cox model and the MSM with time-dependent SBP. For construction of the time-dependent Cox model, the same variables that were included for the adjustment in the traditional Cox regression model were used, except body mass index, laboratory results, and medication usage were treated as time-dependent confounding variables. To construct the MSM, stabilized inverse probability of treatment and censoring weights were used [13ŌĆō15]. In each health examination visit from baseline to the end of the study period, multinomial logistic regression models were fit to acquire the inverse probability of treatment (exposure to SBP categories) and censoring weights (being uncensored), upon a function of both time-dependent covariables and the rest of covariables at baseline, which were the same covariables used in the time-dependent Cox model. After that, inverse weights were stabilized by each inverse probability multiplied by treatment weights for the probability of treatment and censoring weights for censoring, which are calculated by logistic regression. To prevent a potential violation of the positivity assumption, stabilized weights were truncated below the 0.1st or above the 99.9th percentiles after estimating the final stabilized weight. This method created a pseudo-population using inverse probability of treatment and censoring weights, which balanced the distributions of confounders across SBP categories [27ŌĆō31]. Calculated values of stabilized inverse weights accounting for treatment and censoring weights according to the duration of follow-up are presented in Supplementary Table 1 (available online). We performed each analysis with different follow-up durations ranging from 3 to 5 years to compare the three analytical models. Hazard ratios (HRs) with 95% confidence intervals (CIs) were calculated for all models. Statistical significance was set at p < 0.05. All analyses were performed using SAS, version 9.4 (SAS Institute).
Results
Baseline characteristics of the study population
The characteristics of the study population according to the groups stratified by SBP exposure (five categories: <110, 110ŌĆō119, 120ŌĆō129, 130ŌĆō139, and Ōēź140 mmHg) are shown in Table 1. Mean age of study participants was 53.5 ┬▒ 9.6 years, among whom 52.1% were female. The mean and median baseline SBP values were 123 ┬▒ 15 and 121 mmHg (IQR, 112ŌĆō131 mmHg), respectively. The participants with higher SBP were more likely to be male, older, have a higher body mass index, and have more comorbid conditions. Those with a higher SBP had lower eGFR and HDL-cholesterol levels, and higher triglyceride levels at baseline, and were prescribed more blood pressure-lowering medications and statins, compared with that observed in those with a lower SBP.
Relationship between systolic blood pressure and incident chronic kidney disease
During the follow-up period of 5 years, 3,355 (1.7%) incident CKD events occurred. There were 203 (0.8%), 599 (1.3%), 723 (1.5%), 1,016 (2.2%), and 814 (3.1%) primary outcome events of incident CKD in patients with SBP levels of <110, 110ŌĆō119, 120ŌĆō129, 130ŌĆō139, and Ōēź140 mmHg, respectively (p for trend <0.001) (Supplementary Table 2, available online). This trend toward an increased incidence with a higher SBP was consistent even when the follow-up durations were censored at 3 and 4 years.
For the analyses in which SBP was treated as a continuous variable, each 10-mmHg increment in SBP was significantly associated with a higher risk for the primary outcome, regardless of the analytical model used and follow-up duration. For the analysis examining a follow-up duration of 5 years, the Cox model with baseline covariables revealed a significant association between higher SBPs and the increased risk of incident CKD. Specifically, higher SBP (Ōēź130 mmHg) was associated with a higher risk of incident CKD, and lower SBP (<110 mmHg) was associated with a lower risk. Compared to the reference group with a SBP of 120ŌĆō129 mmHg, adjusted HRs for the SBP categories of <110, 130ŌĆō139, and Ōēź140 mmHg were 0.78 (95% CI, 0.67ŌĆō0.91), 1.13 (95% CI, 1.02ŌĆō1.24), and 1.27 (95% CI, 1.15ŌĆō1.41), respectively. The trends were similar in the analyses encompassing different follow-up durations of 3 and 4 years. These associations were largely consistent in the analyses of the time-dependent Cox model. On the other hand, for the analyses using the MSM, similar associations were also observed, but the group with SBP of 110ŌĆō119 mmHg was additionally associated with a significantly lower risk for the primary outcome. HRs (95% CIs) in the analysis of 5 years of follow-up for the SBP groups of <110, 110ŌĆō119, 130ŌĆō139, and Ōēź140 mmHg were 0.70 (0.62ŌĆō0.80), 0.85 (0.77ŌĆō0.95), 1.16 (1.05ŌĆō1.27), and 1.63 (1.47ŌĆō1.80), respectively, compared to the reference SBP group. This association remained consistent with differing follow-up durations (Fig. 2; Supplementary Table 2, available online).
For the analyses of secondary outcomes, when SBP was treated as a continuous variable, graded associations between incrementally increasing SBP and increased risk for each outcome were similarly observed in all three analytical models with differing follow-up durations from 3 to 5 years. However, for the analyses of the secondary outcome as a decrease in eGFR to <60 mL/min/1.73 m2, significant associations between higher SBP and higher risk were only observed in the group with a SBP of Ōēź140 mmHg when using the Cox model with baseline covariables and in the groups with a SBP of 130ŌĆō139 and Ōēź140 mmHg when using the time-dependent Cox model, wherein there was no significant association observed between lower SBP and lower risk in either model with differing follow-up durations. On the other hand, in the MSM with 5 years of follow-up duration, HRs (95% CI) among the groups with SBP of <110, 110ŌĆō119, 130ŌĆō139, and Ōēź140 mmHg were 0.67 (0.57ŌĆō0.79), 0.87 (0.77ŌĆō0.98), 1.22 (1.09ŌĆō1.37), and 1.91 (1.70ŌĆō2.15), respectively, compared to the reference group with a SBP of 120ŌĆō129 mmHg. For the analyses of the secondary outcome as a newly developed proteinuria, only the group with SBP of Ōēź140 mmHg was consistently associated with a higher risk in all analytical models with differing follow-up durations (Supplementary Table 3, available online).
Discussion
In this nationwide cohort study, we found a significant relationship between incrementally higher SBP and the increased risk for incident CKD regardless of the analytical technique employed, including the Cox model with baseline covariables, time-dependent Cox model, and MSM. Especially for the analyses using the MSM, lower SBP groups of not only <110 but also 110ŌĆō119 mmHg were associated with a reduced risk of CKD. These findings contribute to the current literature on the potential significance of high SBP as a preventable risk factor for the development of future CKD in those with preserved renal function.
In the absence of RCTs that have investigated the effect of lower blood pressure targets on the development of de novo CKD as the primary endpoint, several observational cohort studies of the general population have shown a favorable association between lower blood pressure targets and incident CKD or kidney failure [32ŌĆō34]. While RCTs have demonstrated that intensive blood pressure management does not reduce the risk of kidney disease, which was defined as the secondary endpoint, the discrepancy between observational studies and RCTs may be partly due to the differences in the characteristics of study participants. As with previous observational studies, our study also included the general population with fewer comorbidities and blood pressure-lowering medications. In this general population with relatively low risk, we observed both associations of a higher SBP of Ōēź130 mmHg with a higher risk and of a lower SBP of <120 mmHg with a reduced risk, which was consistent with the results of previous studies [32ŌĆō34]. These findings suggest that an adequate blood pressure target may be individualized according to each patientŌĆÖs risk profile to prevent the development of CKD.
In contrast with the other two analytical models, the MSM showed an additional significant relationship between SBP of 110ŌĆō119 mmHg and a lower risk of the primary outcome as incident CKD. Furthermore, opposing the MSM, the Cox model with baseline covariables and the time-dependent Cox model demonstrated that the relationship between some SBP groups and CKD development became nonsignificant in the analyses of secondary outcomes. The effect of hypertension on health outcomes may not be constant because of the variability in blood pressure, modifications of antihypertensive agents according to changes in previous blood pressure readings, and altered health outcome status such as CKD (which in turn affects the degree of blood pressure elevation). The Cox regression model with only baseline variables may be insufficient to reflect such sequential confounding occurring past the baseline and possibly biased to estimate the effect of an exposure on an outcome [13,14]. The time-dependent Cox analysis is commonly used to deal with time-dependent exposures or outcomes, which enables risk estimation considering the updated information on this exposure when demonstrating its association with study outcomes. However, although the traditional Cox regression analysis is modeled with only fixed baseline risk factors, it still addresses the relatively long-term effects of the risk factor on the outcome, whereas the time-dependent Cox analysis only addresses relatively short-term effects [12]. Another caveat of the time-dependent Cox model is that it may not be appropriate to adjust time-dependent confounding variables with repeated measurements that are or can be a result of the risk factor of interest, acting as an intermediate in the causal pathway between the exposure and outcome [35,36]. In contrast, the MSM is particularly effective in evaluating the whole effect between a time-dependent exposure and the outcome, adjusting for time-dependent confounding variables in the cohort or observational studies, which is attributed to the assignment of the inverse probability of treatment weight at each observation and the generation of a pseudo-population in which the exposure is independent of the time-dependent confounding variables [13]. As with previous studies that implemented the MSM to deal with time-dependent confounding variables in medical research [14,37,38], our study attempted to estimate the marginal causality between blood pressure and the incident CKD. There were some discrepancies in the results regarding the association between SBP and CKD development across analytical models in our study. Although the MSM showed a consistent trend toward an association between higher SBP and increased risk of eGFR decline, caution should be exercised in interpreting these results, given that each analytical approach may estimate a different effect.
There are notable strengths of this study, such as the extensive nationwide cohort with a relatively large sample size; the inclusion of the longitudinal individual-level information encompassing data on sociodemographic factors, comorbidities, anthropometric measures, medication usage, and laboratory results; and the use of various analytical methods, including advanced causal inference techniques like the MSM to address time-dependent confounding variables. Despite these strengths, several limitations in this study should be acknowledged. First, it should be noted that our study, like all observational studies, is limited in its ability to establish a definitive causal relationship between blood pressure and the risk of CKD. Additionally, we cannot rule out the potential for residual bias resulting from unmeasured confounding variables in this study whereby the information regarding covariables was obtained from the NHIS dataset. Even though it can be addressed, at least in part, by vigorous adjustments for measured covariables such as demographic, clinical, and laboratory parameters in this study, unmeasured confounders, such as health behaviors, including dietary habits, may have affected the association between SBP status and the development of CKD. Second, blood pressure measurements taken annually or biennially at the office may not be sufficient to capture accurately diverse blood pressure patterns that change over time. Considering that infrequent measurements of blood pressure were obtained at certain time points and a different method for blood pressure measurement was used at health examination compared with that in major trials, inferring the risk of blood pressure on outcomes may be limited. However, the preparation for blood pressure measurements and use of the mean value from multiple occasions were in accordance with the recommendation of current practical guidelines [39]. Third, it is essential to note that our study relied solely on claim data using ICD-10 codes to identify comorbid conditions, which may not have fully captured the true extent of the disease burden for all individuals. Since several comorbidities may act as potential risk factors that may mediate the association between SBP and CKD, we could not assume that it was sufficient to adjust for all biases. Fourth, the cohort primarily consisted of the general population with relatively few comorbidities, which raises the possibility of selection bias. Fifth, because we assumed the positivity assumption in the MSM, there could have been a trade-off between reducing confounding bias and increasing variance, which may have led to the sparsity of data and the increased likelihood of random zeros as more confounders were included [13]. As shown in Supplementary Table 1 (available online), we truncated extreme values of estimated weights below 0.1 percentile or above 99.9 percentile, which are indicative of nonpositivity of the weight model, and this resulted in mean values of weights close to 1.0. Sixth, there could have been a possible competing risk by death before the incident CKD. In this study, we censored participants at the date of death who died before the event of CKD development. Besides, we assumed that the bias subject to censoring and competing risk by death was partly reduced by applying stabilized inverse weight accounting for both censoring and treatment.
In conclusion, in this large national study of the general population in Korea, we found that an SBP Ōēź130 mmHg and an SBP <120 mmHg are associated with higher and lower risks for CKD, respectively. Further studies are needed to define optimal blood pressure targets to prevent the development and progression of CKD based on an individualized assessment of health status and cardiovascular risk.

 PDF Links
 PubReader
 ePub Link
 Full text via DOI
 Download Citation
 Supplement table 1
 Print
Print


")


