


Introduction
In the context of the increasing number of patients with chronic kidney disease (CKD) and end-stage renal disease (ESRD) worldwide, it is reasonable to explore more efficient and safer renal replacement therapy (RRT) and contend whether all these patients required “full dose” dialysis initially. As a peritoneal dialysis (PD) modality, incremental PD (iPD) was first recognized in the 1990s and has recently gained widespread attention [1]. In Italy, 27.5% of patients were initiated on PD using an incremental strategy [2], and this proportion was 44% in Canada [3]. iPD is generally defined as the strategy of dialysis prescribing less than “full dose” at the start of PD for the existence of residual kidney function (RKF), and gradually increasing afterward to compensate for ongoing individual RKF loss to achieve individualized clearance goals [4]. This strategy aligns with the guideline of the International Society for Peritoneal Dialysis (ISPD), which recommends the prescription of prescribe high-quality, goal-directed, and patient-centered PD [5]. There are many potential advantages of iPD, including better quality of life; preservation of RKF; and reduced glucose exposure, peritonitis episodes, and cost [6–9]. iPD is also considered a favorable bridge to renal transplantation [10].
With an aging population, the proportion of older patients with ESRD has increased worldwide. It was estimated that nearly half of the patients with CKD were over 60 years of age in 2015 in China, and patients aged >65 years accounted for 49.9% of the patients on RRT in the United States in 2018 [11,12]. Compared with younger patients with PD, older patients usually have multiple comorbidities, decreased physical and cognitive functions. Therefore, some PD prescriptions that are appropriate for younger patients may not be suitable for older patients. However, the efficacy and safety of iPD for older patients is unknown. Therefore, the objective of this study is to analyze the clinical outcomes of older patients with iPD, and further investigate the feasibility of iPD in those patients.
Methods
Patients and study design
All incident patients who were aged 60 years or older and initiated PD therapy in our center from 1 January 2008 to 31 December 2017 were enrolled in this retrospective cohort study. We excluded patients who missed the data of daily exchanges, urine volume, or RKF; whose daily urine was less than 200 mL at the time of initiating PD; who withdrew from the study within 6 months; transferred from permanent hemodialysis (HD) or failed renal transplantation. All patients were followed up until December 31, 2019. Since icodextrin solution was unavailable in our PD center during the study period, all the patients used 1.5%, 2.5%, or/and 4.25% glucose-based PD solution with a calcium concentration of 1.25 mmol/L.
Statement of ethics
The study was conducted in accordance with the ethical principles of the Declaration of Helsinki and this study protocol was reviewed and approved by the Human Ethics Committees of First Affiliated Hospital, Sun Yat-Sen University (No. [2016]215). In this study, written informed consent was obtained from all participants to participate in the study.
Data collection and measurements
We collected demographic and clinical biochemical data during the first 3 months after PD therapy initiation, including age, sex, primary cause of ESRD, history of cardiovascular disease (CVD), presence of diabetes, body mass index (BMI), systolic blood pressure (SBP) and diastolic blood pressure (DBP), hemoglobin (Hb), serum albumin (Alb), uric acid, total cholesterol, triglycerides (TG), calcium, phosphorus, serum creatinine (sCr), blood urea nitrogen (BUN), intact parathyroid hormone (iPTH), normalized protein catabolic rate (nPCR), RKF, 24-hour urine volume, 24-hour ultrafiltration, daily dwell volume, and exchanges. The adequacy of PD (evaluated by weekly creatinine clearance [CrCl] and urea clearance normalized to total body water [Kt/V]) was recorded during the first 6 months after PD initiation. For iPD patients, the Kt/V data and dwell volume were collected during the iPD period or at the time closest to the iPD period, and for full dose PD patients, these data were collected when Kt/V measured for the first time within 6 months of PD. We also collected clinical data before the PD catheterization, which included serum potassium, sCr, BUN, estimated glomerular filtration rate (eGFR), carbon dioxide (CO2), Hb, Alb, serum calcium, and potassium. Patients were required to visit our PD center every 3 months for a general medical assessment, and we also collected the 24-hour urine volume at each visit. Each episode of PD-related peritonitis was recorded.
Definition and study outcomes
In our PD center, all patients underwent urgent-start PD, and the detailed procedure was described in our previous study [13]. In general, patients underwent intermittent PD for about 1 week after PD catheter insertion. During this transition period, the intermittent PD regimen would be gradually increased from 500 mL × 8 cycles to 1,500 mL × 6 cycles, and then switched to continuous ambulatory PD (CAPD; 4 × 2 L exchanges per day). During the follow-up visit, the physicians would decide whether to decrease the PD dose to ≤3 × 2 L exchanges according to patient’s clinical symptoms, RKF, fluid and solute clearance. A reduction to ≤3 × 2 L exchanges would be considered if patients had better RKF; significant improvements in diet, sleeping, and mental status; and achieved solute clearance target and fluid balance. Therefore, in this study, we defined full dose PD as patients who remained on PD regime ≥4 × 2 L exchanges per day during the first 6 months of PD initiation, while iPD was defined as those who adjusted the PD regime ≤3 × 2 L exchanges per day during the period. For patients with 3 × 2 L exchanges, most of the patients received exchange every 8 hours, while some patients received daytime PD with a dry night due to the peritoneal faster transport. To determine whether to increase the dialysis dose for patients on iPD, we closely monitored their clinical conditions and made the decision primarily according to a comprehensive evaluation focusing on patient-reported outcome measures, including clinical well-being, correction of anemia, malnutrition, mineral disorder, and metabolic acidosis, as well as diuresis and volume status, an approach advocated by recent ISPD guideline [5]. Anuria was defined as urine volume of <100 mL per day. Cardiovascular (CV) death refers to death due to sudden cardiac arrest, congestive heart failure, cardiac arrhythmia, acute myocardial infarction, peripheral vascular disease, or cerebrovascular accident [14]. Peritonitis was defined as the presence of at least two indices according to the ISPD guidelines: abdominal pain and/or cloudy dialysis effluent; presence of white blood cells, >100/mL or >0.1 × 10⁹/L (after a dwell time of at least 2 hours) in the peritoneal effluent, with at least 50% polymorphonuclear leukocytes; and a positive dialysate microbiological culture [15]. Death-censored technique failure was defined as switch to HD at least 3 months by any reasons. The censored events for death-censored technique survival were renal transplantation, abandoning treatment, transferring to other PD centers, death, loss to follow up, and still on PD at December 31, 2019. eGFR was evaluated with the CKD-EPI (Chronic Kidney Disease Epidemiology Collaboration) creatinine equation [16]. RKF was calculated by the average of urea and CrCl and normalized to the body surface area.
The primary outcome of this study was anuria-free survival. Secondary outcomes were all-cause and CV mortalities, peritonitis, and death-censored technical survival.
Statistical analysis
The study population was divided into incremental group and full dose group according to the daily PD exchanges. Data were presented as means ± standard deviation for normally distributed continuous quantitative variables, as medians with interquartile range (IQR) for nonnormally distributed continuous quantitative variables, and as frequency and percentage for categorical variables. The Wilcoxon test, chi-square test, or t-test was used as appropriate to determine the differences in baseline variables between the two groups. Poisson analysis was applied to compare the incidence of peritonitis between these two groups.
Survival was analyzed using the Kaplan-Meier method, and the log-rank test was used to estimate the differences in survival distributions between the two groups. We further explored the risks of anuria and all-cause/CV mortalities using Cox proportional hazards regression models, checked the proportional hazards assumptions of the models, and calculated the hazard ratio (HR) and 95% confidence interval (95% CI). In the multivariate Cox regression models, we finally adjusted those covariates with p < 0.1 in the univariate regression model and those considered to be risk factors for measured clinical outcomes.
To validate the results, we further matched the iPD and full dose groups at a ratio of 1:2 using propensity score matching (PSM) and reanalyzed the associations of PD regimens with clinical outcomes in older patients. The propensity score was evaluated using logistic regression models with the nearest neighbor method and a caliper width of 0.05. Covariates including 24-hour urine volume, RKF, and nPCR were included in the model for adjustment. Additionally, we analyzed the clinical outcomes of older PD patients between diabetes and non-diabetes.
IBM SPSS version 22.0 (IBM Corp.) and R software version 4.4.1 (R Project for Statistical Computing) were used to perform the statistical analyses. Statistical significance was set at a p-value of <0.05.
Results
Demographic and clinical characteristics
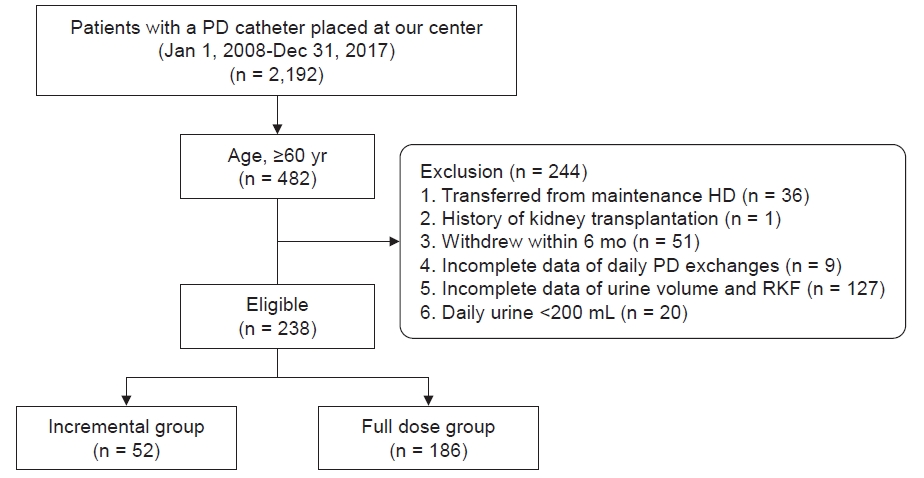
A total of 482 incident patients older than 60 years commenced PD treatment in our PD center from 2008 to 2017, of whom 244 individuals were excluded in accordance with the exclusion criteria: 36 were transferred from permanent HD, one had a history of renal transplantation, 51 withdrew within 6 months, nine missed the data of daily exchanges, 127 had incomplete data of the urine volume and/or RKF, 20 had daily urine less than 200 mL at the time of initiating PD. Among the 51 patients who withdrew within 6 months of PD, 33 patients died, eight patients transferred to HD, one patient transferred to kidney transplantation, five patients transferred to other centers, one patient regained normal kidney function, and three patients gave up PD treatment. Eventually, 238 eligible patients on PD were included in the cohort, with 52 and 186 patients in the incremental group and full dose group, respectively (Fig. 1).
Before PD catheterization, the patient characteristics including eGFR, sCr, serum potassium, and CO2 were comparable between patients of the iPD and full dose groups (Supplementary Table 1, available online). The demographic and baseline clinical data of the included patients are shown in Table 1. The mean age of the enrolled patients was 67.8 ± 5.7 years, 45.8% were females, 71.0% had a history of CVD, and 55.0% had diabetes. The mean RKF at the initiation of PD therapy for iPD and full dose group were 5.06 ± 2.41 and 3.90 ± 2.32 mL/min/1.73 m2, respectively. Compared with the full dose group, patients in the iPD group had lower TG (p = 0.009), sCr (p = 0.03), average daily glucose exposure (p < 0.001), peritoneal CrCl (p < 0.001), peritoneal Kt/V (p < 0.001), 24-hour ultrafiltration (p = 0.001), and daily dwell volume (p < 0.001); and a higher BUN (p = 0.02), iPTH (p = 0.02), nPCR (p = 0.001), renal Kt/V (p < 0.001), renal CrCl (p < 0.001), RKF (p = 0.002), and 24-hour urine volume (p = 0.002). The average time to reduce PD regimens from 4 × 2 L to 3 × 2 L daily exchanges in older PD patients was 3.1 (± 1.8) months, and the mean iPD duration was 29.6 months in the iPD group. The proportion of patients in the iPD group who changed their daily exchanges to 4 × 2 L gradually increased from 13.4% in the first years of PD initiation to 61.5% at the end of 48 months (Supplementary Fig. 1, available online).
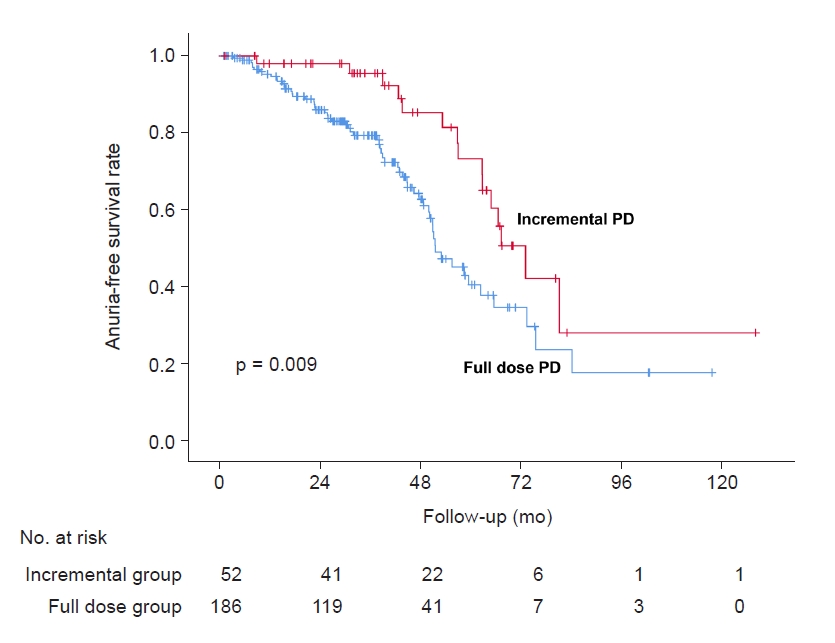
Anuria-free survival
A total of 15 patients (27.2%) in the incremental group and 60 (32.3%) in the full dose group had developed into anuria gradually until the end of follow-up. Associations between these two groups and anuria-free survival were assessed using the Kaplan-Meier curve and log-rank test, which are summarized in Fig. 2. The incremental group had a higher anuria-free survival rate compared to the full dose group (p = 0.009). In the univariate Cox regression analysis, the HR of anuria was 0.47 (95% CI, 0.27–0.84; p = 0.01) for patients in iPD group (vs. full dose group), as shown in Table 2. In model 2 adjusting for sex, BMI, Hb, Alb, DBP, nPCR, and RKF, the HR of anuria was 0.49 (95% CI, 0.26–0.90; p = 0.02) for patients in iPD group. In model 3 adjusting for sex, BMI, Hb, Alb, DBP, nPCR, and urine volume, the HR of anuria was 0.44 (95% CI, 0.24–0.81; p = 0.008) for patients in iPD group. The HRs of the adjusted variables are listed in Supplementary Table 2 (available online).
All-cause and cardiovascular mortalities
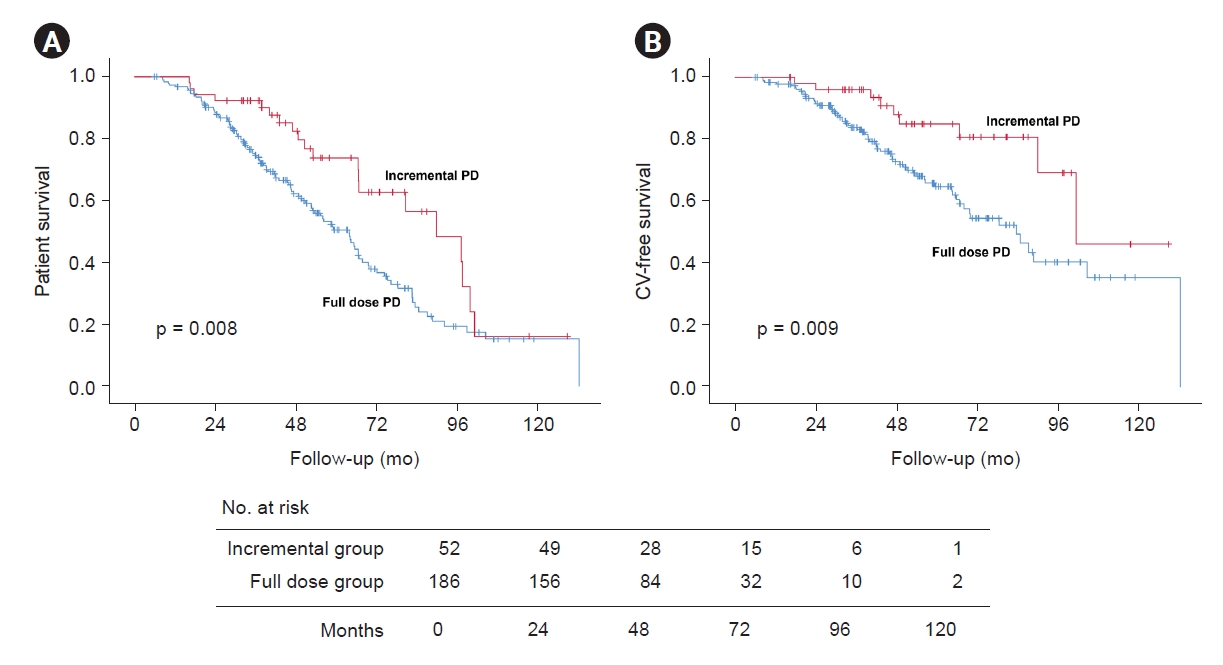
During a median of 69.7 months (IQR, 45.0–102.6 months) of follow-up, a total of 124 deaths (52.1%) were recorded, of which 72 (58.1%) were due to CV events. Kaplan-Meier estimates of survival for these two groups are shown in Fig. 3. Compared to the full dose group, patients on iPD had lower all-cause and CV mortalities (log-rank test; p = 0.008 and p = 0.009, respectively).
The results of the association between PD regimens and mortality measured using the Cox regression models are summarized in Table 2. The iPD group showed a significantly decreased risk of all-cause mortality in model 2 adjusting for sex, BMI, presence of diabetes, history of CVD, DBP, BUN, Hb, nPCR, and RKF (HR, 0.55; 95% CI, 0.34–0.92; p = 0.02), as well as in the model 3 adjusting for sex, BMI, presence of diabetes, history of CVD, DBP, BUN, Hb, nPCR, and urine volume (HR, 0.59; 95% CI, 0.36–0.98; p = 0.04). For CV mortality, the iPD group was associated with significantly reduced risk (HR, 0.42; 95% CI, 0.20–0.87; p = 0.02) when adjusting for sex, BMI, presence of diabetes, history of CVD, DBP, nPCR, and RKF. However, when adjusting the variables of sex, BMI, presence of diabetes, history of CVD, DBP, nPCR, and urine volume, a marginally significant association of iPD with CV mortality (HR, 0.51; 95% CI, 0.25–1.05; p = 0.07) was observed. The HRs of the adjusted variables are listed in Supplementary Table 2 (available online).
Incidence of peritonitis
During the follow-up period, 103 patients (43.3%) suffered from 198 episodes of peritonitis in total, of which 44 episodes occurred in 20 patients with iPD and 154 happened in 83 patients with full dose dialysis. A comparison of peritonitis rates between the incremental group and full dose group is shown in Table 3. During the first 12 months after PD initiation, the peritonitis rate in the incremental group was 0.096 episodes per person-year, and the peritonitis rate (0.217 episodes per person-year) in the full dose group was twice as high as that in the incremental group. At 36 months after PD commencement, the incidence of peritonitis was significantly lower in the incremental group than that in the full dose group (0.115 episodes per person-year vs. 0.197 episodes per person-year; p = 0.03).
Death-censored technical survival
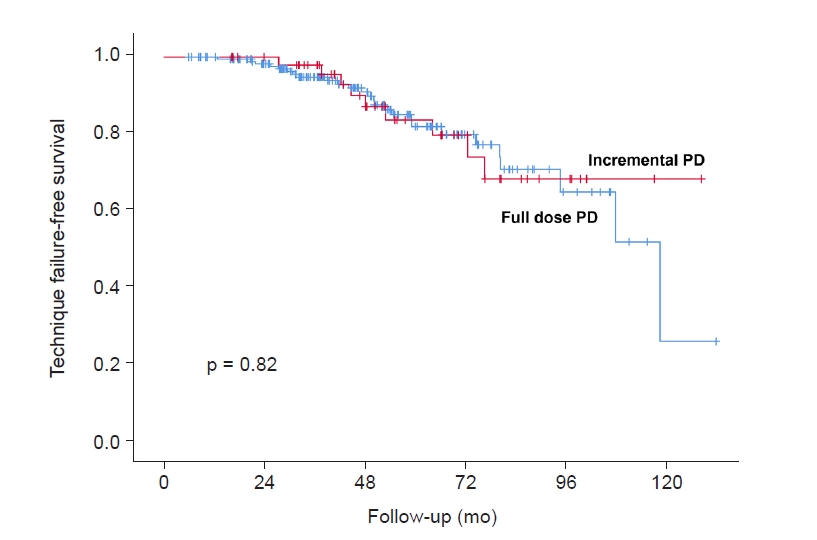
A total of 35 patients (14.7%) occurred PD technique failure during the follow-up period, of whom, nine patients (25.7%) came from incremental group and 26 patients (74.3%) came from full dose group. For death-censored technical survival, there was no significant difference between the two groups as calculated using the Kaplan-Meier method and log-rank test (p = 0.82) (Fig. 4).
Sensitivity and subgroup analyses
In the matched cohort, the baseline characteristics were balanced between the iPD and full dose groups, especially the RKF and urine volume (Supplementary Table 3, available online). Compared to the full dose group, the anuria-free survival (p = 0.03), patient survival (p = 0.04), and CV-free survival (p = 0.04) were all significantly higher in the iPD group, as shown in Supplementary Fig. 2 (available online). Cox regression models showed that patients in the iPD group had decreased risk of anuria (HR, 0.47; 95% CI, 0.24–0.93; p = 0.03), all-cause mortality (HR, 0.57; 95% CI, 0.33–0.98; p = 0.04) and CV mortality (HR, 0.45; 95% CI, 0.21–0.99; p = 0.047) compared to patients in the full dose group (Supplementary Table 4, available online). These results were similar to those of the unmatched cohort. Peritonitis rates in the iPD group were lower than those in the full dose group in the first year and the third years of PD, although the difference was insignificant (Supplementary Table 5, available online). Death-censored technical survival rates were comparable between the two groups (p = 0.42).
In the subgroups analysis, the interaction for anuria (p = 0.11), all-cause mortality (p = 0.33), and CV mortality (p = 0.53) between PD regimens and diabetes were not statistically significant. When RKF was included in the multivariable models, the risk for all-cause mortality of iPD group in older patients without diabetes was significantly reduced (HR, 0.38; 95% CI, 0.16–0.91; p = 0.03), while the risks of anuria and CV mortality were comparable. When urine volume was included in the multivariable models, the risk of anuria in older patients without diabetes was significantly decreased (HR, 0.34; 95% CI, 0.13–0.92; p = 0.03) in the iPD group, while the risks for all-cause and CV mortalities were similar. In the diabetes subgroup, the risks of anuria, all-cause mortality, and CV mortality were comparable between the iPD group and full dose group (Supplementary Table 6, available online). Peritonitis rates were also similar between the two groups both in patients with and without diabetes (Supplementary Table 7, available online).
Discussion
In our observational cohort study, we demonstrated that older patients on iPD initially had better anuria-free survival, better patient survival, and a lower incidence of peritonitis than the patients on full dose PD, while death-censored technical survival was comparable.
The preservation of RKF in PD patients is the focus of nephrologists. In the entire population of patients on PD, most studies support the idea that iPD is beneficial for the preservation of RKF. In older patients undergoing PD, we also found that the iPD strategy was associated with better RFK retention, which was reflected in better anuria-free survival. Lee et al. [9] illustrated that the iPD group (less than four exchanges per day initially) had a lower risk of developing anuria as well. Borràs Sans et al. [7] showed that iPD (three exchanges per day initially) improved the loss of RKF compared to the predialysis period. Sandrini et al. [17] reported similar results. The concept of ‘the intact nephron hypothesis in reverse’ developed by Golper and Mehrotra [18] could partly explain the slower decline in RFK in iPD patients. In this concept, the diseased kidney may undergo compensatory adaptation to compensate for progressively reduced renal function, but initiation of dialysis may inactivate the adaptive stimulation [18]. However, incremental dialysis may continue to stimulate the diseased kidneys’ adaptation in its development [18]. In this way, iPD may help preserve the RKF of older patients. Another possible explanation may be the reduced exposure to glucose and glucose degradation products, which have been demonstrated to have deleterious effects on RKF [19]. Furthermore, the potential functions of preventing fluid over-removal and reducing episodes of peritonitis were also beneficial for the preservation of RKF.
Impaired physical and cognitive functions, such as reduced visual acuity, hand tremors, and paralysis, are common complications in older patients on PD and are barriers to performing PD operations [20]. Some older patients may even require assistant PD. These characteristics of older patients on PD make them more susceptible to peritonitis and poor clinical outcomes, as proven in our previous studies and other studies [21–23]. Evidence has shown that an increasing number of daily exchanges can lead to an increased occurrence of peritonitis [8]. iPD can reduce the number of daily exchanges, which not only reduces the frequency of operations performed by older patients with mobility problems but also reduces exposure to glucose. All of these factors are beneficial in reducing peritonitis [24]. In this cohort study, we showed that older patients with iPD had significantly lower incidence of peritonitis in the first 36 months after PD initiation. Huang et al. [25] found that patients with iPD (<8 L of exchange volume per day) had longer peritonitis-free survival, and that older age was a predictor of longer iPD use. Additionally, a randomized controlled trial from China reported that the patients with three exchanges per day had nominally longer peritonitis-free survival times than those receiving four exchanges per day. Dialysis-associated peritonitis is also an important cause of mortality and hospitalization, which leads to an increased economic burden and compromised quality of life for PD patients [26,27]. iPD has excellent advantages over full dose PD for improving the quality of life in older patients. Furthermore, our results showed that even in older patients with diabetes, the iPD group had similar clinical outcomes compared to the full dose group, which indicated that the iPD regimen was also feasible for older patients with diabetes.
Although the survival outcomes were not the main focus of the present study, we found that older patients on iPD had better survival outcomes. The reanalysis of CANUSA study demonstrated that an improved RKF is associated with better survival outcomes in PD patients [28]. Our results showed that older patients on iPD could better preserve RKF, and this might partly account for better survival in iPD patients. Notably, our results showed that the protective effect of baseline RKF for survival in older PD patients did not reach significance. This might be due to the increase of comorbidities such as diabetes and CVD in older patients, which weakened the protective effect of RKF. The reduction in glucose exposure and glucose degradation products in patients on iPD is another protective factor for superior survival. Glucose exposure and glycation products derived from glucose dialysate can impair the function of the peritoneal membrane and RKF [19,29], leading to systemic complications such as hyperglycemia, dyslipidemia, and metabolic syndrome [30,31]. The function of iPD in reducing peritonitis episodes is another possible explanation.
It is important to note that “incremental” does not mean “early initiation.” Our previous study showed that older patients with early PD initiation had a significantly higher risk of death [32]. In this study, the average eGFR before PD initiation was 4.66 ± 1.55 mL/min/1.73 m2, and there was no difference between the full dose and iPD groups. Additionally, laboratory examinations such as serum potassium, sCr, and CO2 were not significantly different between the two groups. These results suggest that the older patients on iPD in our study had a similar clinical condition as the full dose group and did not start PD early. It is also worth noting that after 3 months of dialysis, RKF of the iPD group was better than that of the full dose group in this study. It is recognized that RKF has a great impact on the clinical outcomes of patients on dialysis [33]. However, we still found a significant anuria-free survival and patient survival benefit for patients on iPD in the multivariate analysis after adjustment of baseline RKF, as well as in the matched cohort that balanced the baseline characteristics. This phenomenon has also been reported in other studies [9,34–36]. The baseline RKF of iPD (dialysate volume, ≤6 L/day) in Yan et al.’s study [36] is better than the full dose PD group as well, but the full dose PD group remains associated with higher death after adjusting for RKF, which was consistent with our result.
Regular follow-up and pre-education for patients on iPD should be emphasized. Since the dialysis dose will gradually increase to a full dose as the RKF declines, regular follow-up for the adjustment of PD prescription is particularly important. At the same time, an increase in the PD dose may result in the reduction in patient compliance, especially in older patients. Thus, all patients must be well-informed in advance of the necessity of subsequent prescription adjustment [37].
The strengths of our study include the long-term regular follow-up and comprehensive tracking of outcomes. This is the first study to delineate the features, efficacy, feasibility, and safety of iPD in older patients. However, this study has some limitations. First, only patients with CAPD were included in this study, and patients with automated peritoneal dialysis were excluded because of the small sample size at our PD center. In addition, none of the patients in this study used icodextrin solution. Secondly, as a single-center observational study, some bias cannot be avoidable, and we are unable to conclude the causal relationship of PD regimen with survival outcomes. Although we have performed PSM to minimize the imbalance of the baseline characteristics between the iPD and full dose groups and obtained consistent results, these results are insufficient to provide solid evidence for the benefits of iPD in older patients. Future prospective studies on iPD and full dose PD in older patients are warranted. In addition, we defined the older individual as patients with an age of ≥60 years rather than 65 years due to the small number of patients older than 65 years in this cohort. And our major objective in this study was to determine the feasibility of iPD in older patients, with the purpose to provide evidence for the PD regimen selection and adjustment of this special population, rather than trying to demonstrate that iPD in older patients was more appropriate than those in younger patients. Therefore, we did not compare the outcomes of iPD initiation between patients older than 60 years and those younger than 60 years in this study. In the future study, we will compare the feasibility of iPD for older patients and younger patients.
In summary, because older patients on PD have a relatively short life expectancy, more attention should be paid to improving their quality of life and reducing the inconvenience caused by their mobility disorders. In this study, we demonstrated that older patients with iPD had better preservation of RKF and reduced peritonitis compared to full dose PD. Our results indicate that the iPD strategy might offer a feasible option for older PD patients.
 PDF Links
 PubReader
 ePub Link
 Full text via DOI
 Download Citation
 Supplement table 1
 Print
Print


")


