


Introduction
Cardiovascular (CV) disease is a major cause of mortality in end-stage kidney disease (ESKD) patients [1]. Both atherosclerosis and arteriosclerosis contribute to arterial disease in these patients by causing extensive media and intima calcification [2]. Inappropriate calcification of vessel walls can be measured by diverse noninvasive methods, and computed tomography (CT) is the gold standard for quantification of vascular calcification (VC) [3]. Abdominal aortic calcification can be used to assess both atherosclerosis and arteriosclerosis [4]. We previously demonstrated that the aortic calcification index (ACI), an estimate of abdominal aortic calcification, is a significant predictor of all-cause death and CV events in ESKD patients [5,6].
Red blood cell distribution width (RDW) is an index of erythrocyte size heterogeneity [7]. In addition to its role as a marker for differential diagnosis of anemia, RDW has emerged as an independent marker for predicting various medical conditions. We previously reported that increased RDW after initiation of dialysis independently predicts CV events and deaths in ESKD patients [8]. In addition, RDW has been reported to have a prognostic role in patients with various stages of chronic kidney disease (CKD), including ESKD [9,10]. However, the interaction between serum RDW and VC has not been investigated in clinical studies. We hypothesized that higher RDW at baseline would augment the risk of all-cause mortality and CV events associated with VC. This study evaluated the clinical impact of VC and RDW in ESKD patients starting dialysis.
Methods
Study population
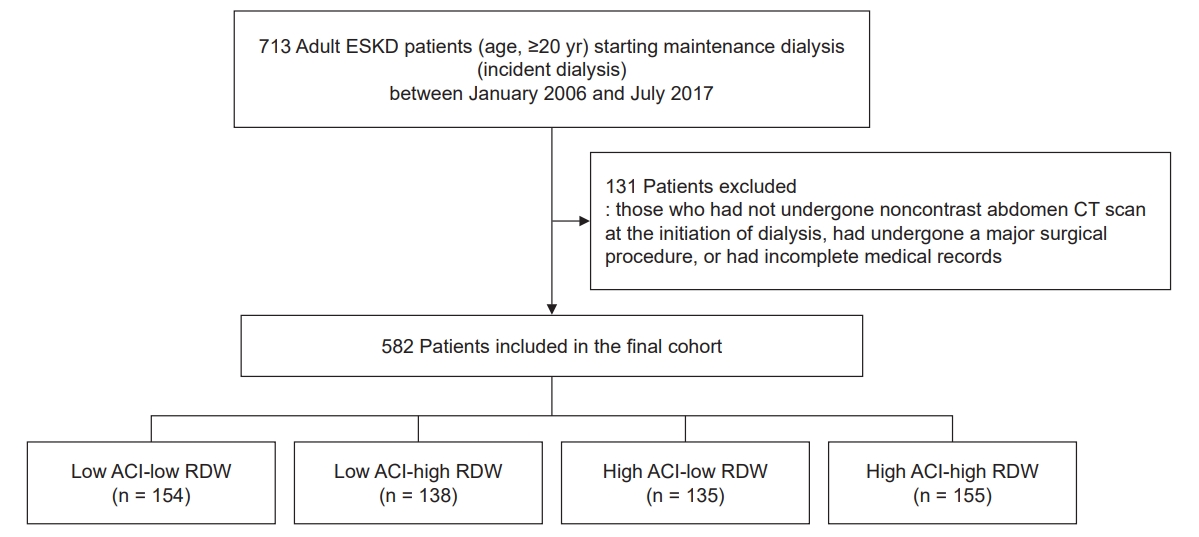
In our center, we perform CT of the abdomen at the initiation of dialysis to evaluate for the presence of acquired cystic lesions and malignancy in the kidney. Among 713 adult ESKD patients (age, ≥20 years) starting maintenance dialysis (incident dialysis patients, including emergency dialysis) between January 2006 and July 2017, 131 patients who had not undergone noncontrast abdomen CT at the initiation of dialysis, who had undergone a major surgical procedure, or had incomplete medical records were excluded. A total of 582 patients who started maintenance dialysis and who underwent a noncontrast abdominal CT scan at the initiation of dialysis between January 2006 and July 2017 were included (Fig. 1).
The study was approved by the Institutional Review Board of The Catholic University of Korea (No. OC19OISI0172) and was conducted according to the principles of the Declaration of Helsinki. This was a retrospective study of anonymized patient data and therefore the need for written consent was waived.
Assessment of abdominal aortic calcification
The abdominal aorta was examined by noncontrast CT on consecutive, sequential 8-mm slices. The proportion of the aortic circumference covered by the most extensive arteriosclerotic portion was quantified in cross-section and expressed as the ACI [11]. Semiquantitative measurement of the ACI was conducted independently by two observers and was reproducible for the patients examined.
Data collection and definitions
Demographic characteristics including age, sex, smoking status, body mass index (BMI), dialysis modalities, comorbidities, laboratory data, and treatment characteristics were compared. Blood samples were obtained from all patients at the initiation of dialysis. BMI was defined as the patient’s weight in kilograms divided by their height in meters squared (kg/m2). Estimated glomerular filtration rate (eGFR) was calculated using the following dialysis-specific equation recommended by Shafi et al. [12]: eGFR (mL/min/1.73 m2) = 2.4 × blood urea nitrogen0.984 × creatinine−1.868. Serum levels of creatinine, blood urea nitrogen, albumin, alkaline phosphatase, calcium, phosphorous, total cholesterol, triglycerides, high-density lipoprotein cholesterol, low-density lipoprotein cholesterol, intact parathyroid hormone (PTH), iron, transferrin saturation, ferritin, vitamin B12, folate, and high sensitivity C-reactive protein (hs-CRP) were measured by laboratory tests, and hemoglobin content, RDW, leukocyte count, and platelet count were also determined. History of medication use such as erythropoiesis-stimulating agents, iron replacement medications, renin-angiotensin-aldosterone system (RAAS) blockers, beta-blockers, calcium channel blockers, calcium-based phosphorus-binders, non-calcium-based phosphorus-binders, statins, and vitamin D analogues was recorded.
Patients were divided into four groups (low ACI-low RDW, low ACI-high RDW, high ACI-low RDW, and high ACI-high RDW) according to median ACI (17.12) and RDW (14.3) values.
Echocardiography
In our center, we perform echocardiography at the initiation of dialysis to evaluate cardiac function. Two-dimensional echocardiographic measurements were performed by trained sonographers according to the recommendations of the American Society of Echocardiography [13]. Left ventricular (LV) end-systolic volume, LV end-diastolic volume (LVEDV), LV posterior wall thickness, interventricular septal thickness (IVST), and LV internal dimension (LVID) were assessed. LV ejection fraction and left atrial (LA) diameter were measured by biplane Simpson’s rule. LV mass index was calculated according to the Devereux formula and indexed to body surface area [14]. LV diastolic dysfunction was estimated by measuring mitral inflow velocities and myocardial velocities using pulsed-wave Doppler imaging. Peak velocity of early filling (E), peak velocity of atrial filling (A), and ratio of E to A waves (E/A ratio) were also recorded. Septal mitral annular early peak velocity (E’) and E/E’ ratio were determined by tissue Doppler imaging.
Outcome measures
The primary study endpoint was the composite of patient mortality and CV events. CV events were defined as the incidence of coronary heart disease (angina pectoris or myocardial infarction), heart failure, cerebrovascular disease (transient ischemic attack, cerebral infarction, or cerebral hemorrhage), peripheral vascular disease, or pulmonary vascular disease.
Statistical analysis
Baseline characteristics of the study cohort stratified by ACI and RDW are expressed as means ± standard deviations or medians with interquartile ranges (25th–75th percentile) for variables with a skewed distribution. Categorical data are expressed as numbers with percentages. Continuous variables were compared using the Kruskal-Wallis test or a one-way analysis of variance as appropriate. Categorical data were compared using the chi-squared test. Survival distributions of the different groups were estimated using Kaplan-Meier curves and compared using log-rank tests. Cox regression analysis was used to identify prognostic variables contributing to all-cause mortality and CV events. Univariate analysis was followed by multivariate analysis using the forward method. Variables with statistical significance were included in multivariate analysis. Estimated standard error of the coefficient (β1) was used to establish the 95% confidence interval (CI) of the hazard ratio (HR). An interaction model was conducted in the context of Cox regression analyses using the forward method. In an interaction model, a third variable influences the relationship between an independent and dependent variable [15]. In this study, to determine if ACI mediated the relationship between RDW and the primary study endpoint, or to determine if RDW mediated the relationship between ACI and the study endpoint, a two-way interaction term between ACI and RDW was included in the model. Correlations among variables were assessed by Spearman correlation analysis. A p-value less than 0.05 denoted statistical significance. Statistical analyses were performed using PASW Statistics version 18.0 (IBM Corp., Armonk, NY, USA).
Results
Patient characteristics
In total, 582 patients were included in the analysis (low ACI-low RDW, n = 154; low ACI-high RDW, n = 138; high ACI-low RDW, n = 135; and high ACI-high RDW, n = 155). Table 1 compares patient characteristics among the four groups. Four hundred seventeen patients (71.6%) were hemodialysis patients, and 165 (28.4%) were peritoneal dialysis patients. Patients in the high ACI groups were older, more likely to have diabetes mellitus and CV disease, and have higher eGFR, serum leukocyte counts, and calcium and folate levels at the initiation of dialysis than patients in the low ACI groups. The cause of ESKD, BMI, serum albumin, phosphorus, hemoglobin, triglyceride, intact PTH, hs-CRP, and iron levels, in addition to RDW, platelet count, and ACI differed significantly among the four groups. Patients in the high ACI groups used significantly less calcium-based and non-calcium-based phosphorus-binders and vitamin D analogues and significantly more beta-blockers than those in the low ACI groups. Levels of serum urea nitrogen, alkaline phosphatase, total cholesterol, high-density lipoprotein cholesterol, low-density lipoprotein cholesterol, transferrin saturation, ferritin, and vitamin B12, in addition to dialysis modality, sex, smoking percentage, and the use of erythropoiesis-stimulating agents, iron replacement medications, RAAS blockers, calcium channel blockers, and statins did not differ among the four groups.
Echocardiographic measurements
Table 2 compares echocardiographic measurements among the four groups. A total of 318 patients underwent echocardiography at dialysis initiation. LVID in diastole, LVID in systole, LVEDV, IVST at end-diastole, LA diameter, E/A ratio, and E/E’ ratio differed significantly between the four groups. Patients in the high ACI groups had a significantly lower LVID in systole, LVID in diastole, and LVEDV, as well as a significantly higher IVST at diastole, LA diameter, and E/E’ ratio, than patients in the low ACI groups.
Cardiovascular events and deaths
A total of 165 CV events (28.4%) and 124 deaths (21.4%) occurred during the follow-up (median duration, 3.1 years; range, 1.5–5.5 years). Kaplan-Meier analysis showed that cumulative event-free survival was significantly lower in the high ACI groups than in the low ACI groups (p < 0.001) (Fig. 2). There was a significant difference in cumulative event-free survival between the low ACI-high RDW group and the low ACI-low RDW group (p = 0.03), whereas cumulative event-free survival was not significantly different between the high ACI-low RDW group and high ACI-high RDW group (p = 0.99).
Predictors of cardiovascular events and death
Factors associated with CV events and death were compared using the low ACI-low RDW group as the reference (Table 3). In univariate analysis, the risk of CV events and death was higher in the low ACI-high RDW, high ACI-low RDW, and high ACI-high RDW groups than the low ACI-low RDW group. Moreover, multivariate analysis adjusted for older age, diabetes mellitus, history of CV disease, eGFR, hemoglobin level, ACI value per se, RDW value per se, albumin, hs-CRP, and total cholesterol levels, and use of non-calcium-based phosphorus-binders verified that the HR was increased in the low ACI-high RDW (adjusted HR, 1.66; 95% CI, 1.04–2.66; p = 0.03) and high ACI-low RDW (adjusted HR, 1.95; 95% CI, 1.21–3.14; p = 0.006) groups and was highest in the high ACI-high RDW group (adjusted HR, 2.23; 95% CI, 1.42–3.52; p = 0.001). In addition, there was a significant interaction between ACI and RDW for the composite endpoint (p for interaction = 0.005).
In subgroup analysis of patients with baseline echocardiographic data (n = 318), the high ACI-high RDW group (adjusted HR, 3.34; 95% CI, 1.62–6.89; p = 0.001) exhibited the highest HR in multivariate analysis after adjusting for older age, diabetes mellitus, history of CV disease, ACI, albumin and total cholesterol levels, use of non-calcium-based phosphorus-binders, and LV ejection fraction (Table 4). The interaction between ACI and RDW for the composite endpoint was also statistically significant (p for interaction = 0.001).
Correlation between aortic calcification index and red blood cell distribution width
In Spearman correlation analysis, ACI and RDW were not significantly correlated (r = 0.068 and p = 0.100) (Fig. 3).
Discussion
This study showed that a high serum RDW and ACI interacted to increase the risk of CV events and all-cause death in ESKD patients. Using the low ACI-low RDW group as the reference, there was a significant trend of increasing CV events and deaths from the low ACI-low RDW group to the high ACI-high RDW group. This finding was independent of other powerful predictors such as age, traditional CV risk factors, and laboratory parameters associated with mineral metabolism disorders. In patients for whom echocardiographic data were available at the initiation of dialysis, there was also a consistent trend toward an increase in the composite endpoint in the high ACI-high RDW group. Thus, patients with a high ACI and high RDW had the greatest risk of CV events and all-cause death.
The degree of red blood cell volume heterogeneity can be measured as a percentage known as the RDW [7]. RDW has been used for differential diagnosis of anemia. Elevated RDW suggests profound deregulation of erythrocyte homeostasis, reflecting malnutrition, chronic inflammatory status, and erythropoietin resistance [7,16,17]. In addition, several studies have demonstrated the clinical usefulness of RDW in various medical conditions. High RDW is associated with higher mortality rates in patients with congestive heart failure, stroke, peripheral artery disease, and acute kidney injury who are treated with continuous renal replacement therapy [18–21]. Furthermore, in patients with stage 3–5 CKD, a high RDW is associated with all-cause mortality and CV disease [22]. In hemodialysis patients, a higher RDW is a stronger predictor of mortality than traditional laboratory markers of anemia such as hemoglobin, ferritin, and transferrin saturation [10]. The findings of the current study are consistent with previous studies, namely that an elevated RDW was associated with increased risk of CV events and death.
CV disease is the leading cause of death in patients with ESKD [23], and the extent of arterial calcification is regarded as the predominant determinant of CV disease and mortality [24]. VC is a characteristic marker of coronary atherosclerotic burden [25], and the extent of VC can be assessed using various imaging modalities, with CT being the gold standard for quantifying VC. Previous studies reported a relationship between VC and CT-based abdominal aortic calcification and demonstrated that quantification of CT-based abdominal aortic calcification provided information about the risk of CV events [26]. Advanced age, extended dialysis vintage, diabetes mellitus, elevated calcium, phosphorus, and lipid levels, and inflammation are risk factors for VC [25,27–31]. This study showed that patients in the high-ACI groups were older, had a higher prevalence of diabetes mellitus and CV disease, and had a higher calcium level and leukocyte count at the initiation of dialysis than patients in the low-ACI groups. VC is also correlated with LV diastolic dysfunction in ESKD patients [5]. We found a significant relationship between LV diastolic stiffness and limited diastolic filling in the high ACI groups based on a higher LA diameter and E/E’ ratio, and LVEDV was lower in the high ACI groups than in the low ACI groups.
In this study, the correlation between ACI and RDW was not statistically significant. To the best of our knowledge, no prior study has reported a significant correlation between VC and RDW in ESKD patients. Although there are differences in the study population between our study and previous studies, RDW and VC have also been reported to show a relationship in other patient populations. Several recent studies revealed a relationship between elevated RDW and the burden of coronary atherosclerosis, where elevated RDW was related to a higher coronary artery calcification score [32]. Another study demonstrated a positive correlation between RDW and the coronary artery calcification score after adjustment for age, sex, BMI, diabetes mellitus, glomerular filtration rate, and high-density lipoprotein cholesterol level [33]. Oleksiak et al. [34] found that an elevated RDW and coronary calcium score both independently increased the coronary atherosclerotic burden in patients diagnosed with coronary artery disease. RDW also predicted the outcomes of patients with coronary artery disease. RDW was a clinically useful prognostic factor for all-cause mortality in patients with coronary artery disease [35]. Additionally, an incremental relationship was found between increased RDW and the risk of death in patients with coronary disease [36]. Although the pathophysiological mechanism underlying the relationship between RDW and CV outcomes is not fully understood, it has been suggested that greater variation in erythrocyte volume increases blood viscosity and impairs blood flow, leading to vascular occlusion [37]. Another explanation involves oxidative stress [38]; high oxidative stress can decrease the erythrocyte lifespan and suppress the response of erythropoietin to anemia, which ultimately increases RDW [7]. Such anisocytosis disrupts blood flow through the microcirculation, resulting in tissue hypoxia and a concomitant increase in CV events [7,37]. In the current study, increased RDW at the initiation of dialysis had an additive effect on the risk of CV events and mortality in both the low ACI and high ACI groups, even after adjusting for traditional CV risk factors. The prognostic significance of RDW was also evident after adjustment for echocardiographic parameters. Therefore, it is reasonable to speculate that a high RDW contributes to increased CV events and death in ESKD patients irrespective of the degree of VC at the start of dialysis. The exact mechanism by which RDW augments VC-associated risk is not known. An elevated RDW reflects several conditions, such as impaired glycemic control, systemic inflammation, oxidative stress, impaired iron metabolism, hemodynamic overload, tissue hypoxia, endothelial dysfunction, and malnutrition [22]; a higher RDW may therefore reflect the presence of the conditions listed above that confer a higher risk of VC.
When we compared survival between the low RDW and high RDW groups, survival was not statistically significant by Kaplan-Meier analysis (data not shown, p = 0.98). Additionally, RDW was statistically significant only in univariate regression analysis, and not in multivariate analysis. Similarly, in our previous study [8], a higher RDW at the start of dialysis was not associated with mortality and CV events. However, we found that a progressive increase in RDW was associated with increased mortality and CV events in ESKD patients. Those with a higher increase in baseline RDW and RDW over the follow-up period had lower event-free survival rate than those with less of an increase in baseline RDW and RDW [8]. A large cohort study of 109,674 hemodialysis patients reported that a higher RDW was linked to higher mortality [10]. The reason for RDW alone not being a statistically significant risk factor in the current study and our previous study [8] may be due to the relatively small sample sizes of these studies. Nevertheless, the HR increased incrementally in the low ACI-high RDW group, high ACI-low RDW group, and high ACI-high RDW group in this study. Large-scale studies are needed to determine whether the effect of ACI is more important than that of RDW and to further investigate the association between RDW, mortality, and CV events.
In the current study, the interaction between ACI and RDW was statistically significant in the entire patient population and in patients with echocardiography data. Since the correlation between ACI and RDW was not significant, this means that RDW and ACI do not interact as correlating factors. Our results indicate that besides the effect of ACI, the risk of CV events and all-cause mortality in ESKD patients is augmented by high RDW. Because patients with ESKD have a high mortality rate compared to the general population [39], our study suggests that the additive effect of RDW on ACI requires further consideration. Monitoring serial changes in ACI and RDW may be helpful to further study the interaction between these two factors.
This study had several limitations. First, the retrospective design limited robust analysis of the data. Second, data were collected from a single center, which limits the generalizability of the results. Third, the pathophysiological link underlying the interaction between high RDW and VC is unclear. However, demographics, laboratory variables, medications, and echocardiographic parameters were all included in the analysis, which strengthens the clinical implications of our findings of an interaction between RDW and VC.
In conclusion, we found that high serum RDW augmented the risk of CV events and death associated with VC in ESKD patients starting dialysis. High RDW increased the risks in all groups, including the low ACI and high ACI groups, and the risk was highest in the high ACI-high RDW group. This finding was consistent after adjusting for factors associated with anemia, nutritional status, inflammation, mineral metabolism disorder, and traditional CV risk factors. Therefore, the combination of RDW, which is a convenient and cost-effective index marker, and ACI, which reflects the degree of VC as assessed by abdominal CT, can be used to stratify risk of future CV disease and mortality in ESKD patients.


 PDF Links
 PubReader
 ePub Link
 Full text via DOI
 Download Citation
 Print
Print


")


