


Introduction
Chronic kidney disease (CKD) is a worldwide public health challenge with high morbidity and mortality. The mortality rate of CKD patients is 2.8-fold higher than that of non-CKD patients, and the mortality rates increase with CKD severity [1]. The most common cause of death in CKD patients is cardiovascular disease (CVD) [2]. The prevalence of CVD increases as renal function declines, and patients with end-stage renal disease (ESRD) show an extremely high prevalence of CVD and cardiovascular mortality compared with the general population [3,4]. The increased cardiovascular mortality in CKD patients is partly attributed to shared risk factors between CVD and CKD, such as hypertension, dyslipidemia, and diabetes, but these factors do not account for all of the increased mortality [3].
Increased systemic inflammation is one of the nontraditional factors underlying the increased cardiovascular risk in CKD patients [5]. Persistent, low-grade inflammation is regarded as an important component of CKD and contributes to increasing oxidative stress and accumulation of modified proteins and toxins [5,6]. Both systemic and vascular inflammation are increased in CKD patients [7]. Vascular inflammation in the coronary arteries is regarded as an important factor causing atherosclerotic plaque rupture [8]. Therefore, detecting coronary inflammation is a critical issue, but in clinical settings, it is difficult to identify the degree of vascular inflammation in coronary arteries.
In a previous study, the pericoronary fat attenuation index (FAI) determined using coronary computed tomography angiography (CTA) was suggested as an emerging parameter reflecting coronary artery inflammation [9,10]. The pericoronary FAI can be used to evaluate the degree of coronary inflammation, which inhibits adipogenesis in perivascular fat and increases fat attenuation on CTA images [11]. Indeed, Oikonomou et al. [9] showed that the pericoronary FAI was a good predictor of cardiovascular mortality and all-cause mortality in the general population.
Given the association of chronic inflammation and CKD, and the limited utility of luminal stenosis as a prognostic marker of CKD due to significant coronary calcification, the pericoronary FAI may potentially be an alternative marker to predict long-term outcomes in CKD patients. Thus, the objective of this study was to investigate the utility of the coronary FAI in predicting mortality of CKD patients, including those with ESRD.
Methods
Study population
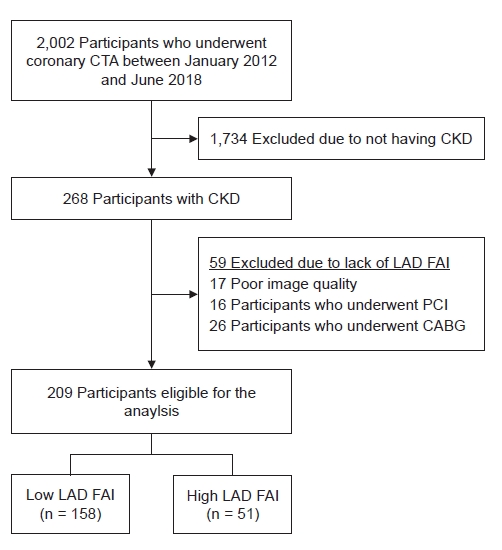
A total of 2002 coronary CTAs were performed from January 2012 to June 2018 at Soonchunhyang University Seoul Hospital, Korea. After excluding patients without CKD, 268 subjects with CKD were enrolled in the study (Fig. 1). The CKD patients were selected by reviewing the electronic medical records. CKD was defined by ŌĆ£an estimated glomerular filtration rate (eGFR) less than 90 mL/min/1.73 m2 with albuminuria (urine albumin-to-creatinine ratio Ōēź 30 mg/g)ŌĆØ or ŌĆ£eGFR less than 60 mL/min/1.73 m2,ŌĆØ according to the Kidney Disease Improving Global Outcomes (KDIGO) guidelines [12]. The eGFR was computed based on age, sex, race, and serum creatinine values using the Chronic Kidney Disease Epidemiology Collaboration equation [13]. All CTAs were performed after consultation with a cardiologist. The main indications for CTA were chest discomfort during dialysis, chest pain at rest, and dyspnea on exertion. Patients who had previously undergone percutaneous coronary intervention or coronary artery bypass graft were excluded, because we assumed that the previous procedure had affected the pericoronary fat tissue.
The study was conducted in accordance with the Declaration of Helsinki, and the protocol was approved by the Institutional Review Board (IRB) of the Soonchunhyang University Seoul Hospital (No. SCHUH 2019-04-001). The need for informed consent was waived by the IRB, as the current study was considered a retrospective review of anonymized clinical data.
Computed tomography angiography technique and image analyses
A detailed description of the CTA technique is provided in Supplementary Method 1 (available online).
To adjust the attenuation difference between scans performed at different tube voltages, the FAI for scans performed at 100 kVp was corrected by dividing by a 1.11485 conversion factor to make the results comparable to those for scans performed at 120 kVp [11,14]. We defined mild, moderate, and severe stenosis of a coronary artery as luminal stenosis of 25% to 49%, 50% to 69%, and 70% or more, respectively [15]. We used the modified Duke coronary artery index to assess the extent of coronary artery disease [16]. We defined high-risk plaque features as the presence of spotty calcification, low-attenuation plaques, positive remodeling, and the napkin-ring sign [17].
To measure the FAI, we traced the proximal 40-mm segments of all three major coronary arteries. The definition of pericoronary fat is adipose tissue within a radial distance from the outer vessel wall equal to the diameter of the vessels, as previously described and verified [9,11]. To avoid interference by the aortic wall, the most proximal 10 mm of the right coronary artery (RCA) was excluded and the proximal 10 to 50 mm of the vessels was analyzed. For the left anterior descending artery (LAD) and the left circumflex artery (LCx), the proximal 40 mm of each vessel was analyzed. The pericoronary FAI was determined by quantifying the weighted pericoronary fat attenuation after adjusting for technical parameters, based on the attenuation histogram of pericoronary fat within the range of ŌĆō190 Hounsfield unit (HU) to ŌĆō30 HU, as described previously [9,11]. Technical parameters, such as tube voltage, tube current, and radiation output, and anatomical parameters, including vessel diameter or stenosis, were analyzed.
Covariates
The demographic characteristics of the patients at the time of the coronary CTA were acquired from the electronic medical records at Soonchunhyang University Seoul Hospital. These characteristics included age, sex, body mass index (BMI), smoking history, the presence of diabetic kidney disease (DKD), and dialysis status. Laboratory variables, such as serum urea nitrogen, creatinine, total calcium, phosphorus, total cholesterol, triglycerides, albumin, and hemoglobin, were also collected. Serum total calcium concentrations were adjusted to serve as a surrogate marker of free calcium using the following correction for serum albumin concentrations: 0.8 ├Ś (4.0 ŌĆōserum albumin) + serum calcium.
Outcomes
The primary outcome of this study was all-cause mortality. Mortality data were obtained from the Korean National Statistical Office (Microdata Integrated Service, on demand, 20,180,619; https://mdis.kostat.go.kr). It is mandatory to report the death of any Korean national to the National Statistical Office. The data included deaths of the study participants occurring before December 31, 2018. The detailed causes of death reported by the institution are listed in Supplementary Table 1 (available online). The cause of death was not based on accurate medical assessment and therefore was not used in further analyses.
Statistical analyses
The statistical analyses were performed using R version 3.6.1 (The R Foundation for Statistical Computing, Vienna, Austria). The categorical variables were expressed as counts (percentage). The normally distributed continuous variables were expressed as means ┬▒ standard deviation and non-normally distributed continuous variables are presented as medians (interquartile ranges). The perivascular FAI values were divided into two groups based on the optimum cutoff value. The optimum cutoff values were determined by selecting the datapoints that maximized the sum of sensitivity and specificity using a receiver-operating characteristic (ROC) curve, which discriminated the all-cause mortality according to the FAI values. The two groups were compared using the Student two-tailed unpaired t test or the Mann-Whitney U test, as appropriate. Pearson chi-square tests were used when comparing the categorical variables. Pearson correlation coefficient or Spearman rank correlation coefficient was used to test the correlation between the individual continuous variables.
To avoid biased estimates due to unintended missing values, a multiple imputation process was conducted using the regression modeling strategies package in R software. For model development, we generated five complete datasets by estimating the missing data based on bootstrapping and predictive mean matching. The numbers imputed for each variable are presented in Supplementary Table 2 (available online).
Unadjusted Kaplan-Meier curve analyses and multivariable Cox proportional hazards models were used to assess the association between the pericoronary FAI values and the risk of death. The proportional hazards assumption was tested using Schoenfeld residuals. Nonlinear associations were examined using restricted cubic splines to relax the linearity assumptions for the continuous variables, especially for the pericoronary FAI. In Cox regression models, a 95% confidence interval (CI) of a hazard ratio (HR) that did not include 1.0 was considered statistically significant. In other analyses, a p-value less than 0.05 was considered statistically significant.
Results
Characteristics of the participants and their fat attenuation index
A total of 268 CKD patients who underwent coronary CTAs were enrolled in this study. Fifty-nine LAD, 73 LCx, and 66 RCA FAI values were excluded from the analysis because of technical issues. The reasons for the exclusions are listed in Supplementary Table 3 (available online). The FAI values were normally distributed and their mean values were ŌłÆ70.7 ┬▒ 8.6 HU in the LAD, ŌłÆ66.8 ┬▒ 7.6 HU in the LCx, and ŌłÆ70.2 ┬▒ 10.5 HU in the RCA. The optimum cutoff values for predicting deaths based on the ROC curve analysis were ŌłÆ65.5 HU in the LAD (area under the ROC curve [AUC], 0.59; 95% CI, 0.50ŌĆō0.69), ŌłÆ60.3 HU in the LCx (AUC, 0.51; 95% CI, 0.39ŌĆō0.62), and ŌłÆ61.9 HU in the RCA (AUC, 0.54; 95% CI, 0.44ŌĆō0.64).
Because in a subsequent analysis the LAD FAI value was found to be a superior predictor of mortality when compared with the FAI values of the other coronary arteries, we mainly focused on the LAD FAI. Further analyses included 209 patients out of 268 patients, and excluded 59 patients without LAD FAI values. The mean age of the patients was 63.3 ┬▒ 12.4 years, and 100 (47.8%) were male. Eighty-five patients (40.7%) had DKD and 147 (70.3%) were on dialysis. The median follow-up after coronary CTA was 30.3 months (17.1ŌłÆ47.7 months). The characteristics of the patients according to the optimum LAD FAI cutoff values are presented in Table 1. The high-LAD-FAI group included more dialysis patients and lower hemoglobin and serum triglyceride concentrations than the low-LAD-FAI group. Supplementary Table 4 (available online) summarizes the prescriptions drugs used by patients after coronary CTA imaging.
Pericoronary fat attenuation index according to chronic kidney disease stage
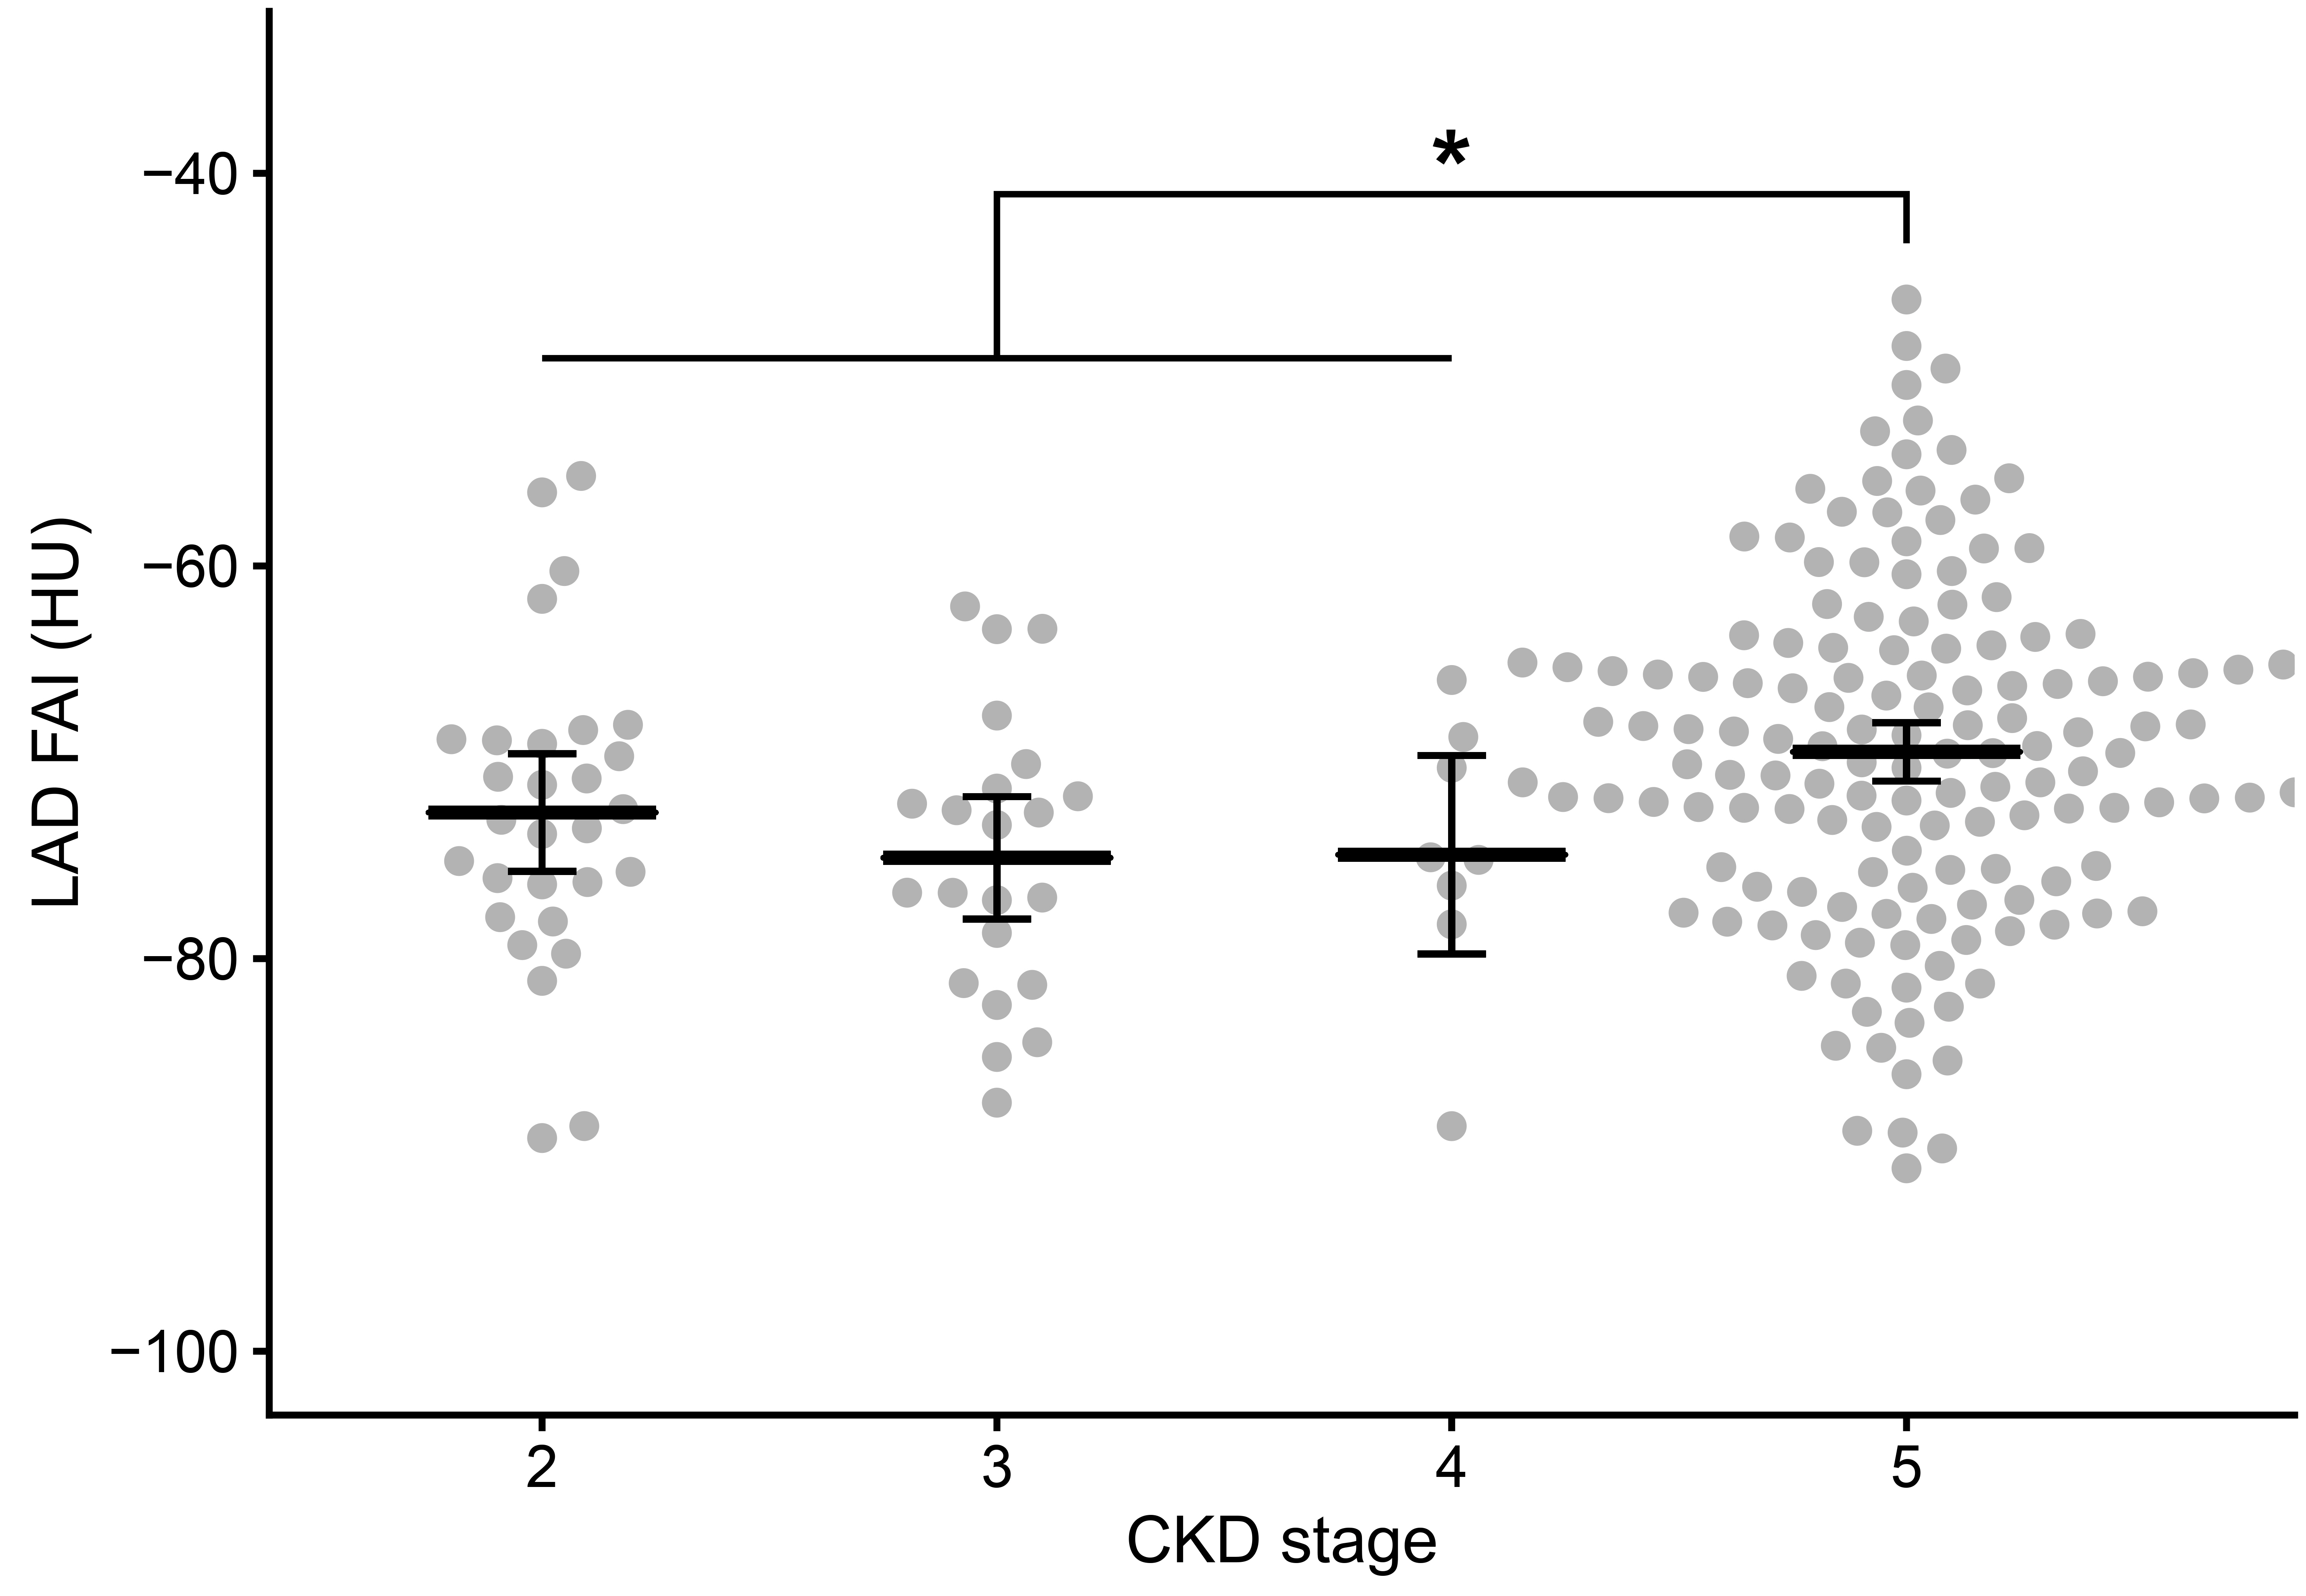
The mean FAI value of the LAD was ŌłÆ72.6 ┬▒ 7.9 HU in patients with stage 2 CKD, ŌłÆ74.9 ┬▒ 7.1 HU in stage 3CKD, ŌłÆ74.7 ┬▒ 7.0 HU in stage 4 CKD, and ŌłÆ69.5 ┬▒ 8.8 HU in stage 5CKD (Fig. 2). The LAD FAI values of the stage 5 CKD patients were significantly greater than those of patients in stages 2 through 4 (p < 0.001). There were no significant differences in the LAD FAI values of patients with stage 2, 3, or 4 CKD. The RCA and LCx FAI values were also significantly greater in patients with stage 5 CKD compared with the patient in stages 2 through 4, and none of the FAI values for patients in stages 2 through 4 differed significantly (Supplementary Fig. 1, available online). The LAD FAI values were negatively correlated with age, BMI, and hemoglobin, serum albumin, total cholesterol, and triglyceride concentrations in the CKD patients (Table 2). Even in the multivariable analyses, the BMI, and serum albumin and triglyceride concentrations were negatively correlated with LAD FAI values. The correlations between the FAI values of the other two coronary arteries and continuous covariates is presented in Supplementary Table 5 (available online).
Pericoronary fat attenuation index and mortality in chronic kidney disease patients
Among the 209 study participants, there were 43 deaths, including 27 deaths in the low-LAD-FAI group and 16 deaths in the high-LAD-FAI group. The mortality rate was 88.1 (95% CI, 64.6ŌłÆ117.5) per 1,000 person-years (low-LAD-FAI-group, 71.2 [95% CI, 48.0ŌłÆ102.1] per 1,000 person-years; high-LAD-FAI-group, 146.8 [95% CI, 87.3ŌłÆ232.7] per 1,000 person-years). The unadjusted cumulative hazard curve for all-cause mortality according to the LAD-FAI groups is shown in Fig. 3A. The HR for death was significantly greater in the high-LAD-FAI group compared with the low-LAD-FAI group. However, after adjusting for age, sex, BMI, smoking history, the presence of DKD, dialysis status, hemoglobin, serum albumin, phosphorus, and total cholesterol, the mortality of the high- and low-LAD-FAI groups did not differ during the follow-up period (HR, 1.81; 95% CI, 0.88ŌĆō3.73) (Table 3). In the analyses of the LCx FAI and RCA FAI, the high-FAI groups also had greater HRs in the unadjusted models, but there was no significant difference between the high- and low-FAI groups after adjustment (Supplementary Fig. 2, available online). The restricted cubic spline regression model showed a J-shaped relationship between the LAD FAI values and the hazard of all-cause mortality (Fig. 4A).
Pericoronary fat attenuation index and mortality in patients on dialysis
Further subgroup analyses were conducted with the data from CKD patients undergoing dialysis. Among 147 dialysis patients, there were 34 deaths, including 19 in the group with low LAD FAI values and 15 in the group with high LAD FAI values. The mortality rate was 127.8 (95% CI, 90.1ŌłÆ176.4) per 1,000 person-years (low-LAD-FAI group, 102.2 [95% CI, 63.6ŌłÆ156.2] per 1,000 person-years; high-LAD-FAI group, 187.5 [95% CI, 109.5ŌłÆ301.5] per 1,000 person-years) The mortality in the high-LAD-FAI group was significantly greater compared with the low-LAD-FAI group, similar to the results for the entire CKD patient cohort (Fig. 3B). After adjusting for confounding variables, the mortality rate in the high-LAD-FAI group was still greater than in the low-LAD-FAI group during the study period (HR, 3.01; 95% CI, 1.19ŌĆō7.61) (Table 3). The restricted cubic spline regression model showed that the HRs increased linearly as the LAD FAI values increased in the ESRD group (Fig. 4B).
Discussion
We found that the pericoronary FAI values were greater in the ESRD patients compared with the CKD patients who were not on dialysis. Furthermore, in the ESRD patients, high LAD FAI values were associated with a high incidence of all-cause mortality even after adjusting for the traditional cardiovascular risk factors. These results suggest the clinical usefulness of pericoronary FAI in CTA to predict the prognosis of patients with ESRD.
In the present study, a high pericoronary FAI was associated with all-cause mortality in the ESRD group. Although the exact cause of death was not evaluated in this study, the mechanism/s underlying increased FAI values and increased incidence of CVD in ESRD patients indicate a high pericoronary FAI might be associated with the development of CVD. Coronary artery disease is common in ESRD patients. In addition to existing coronary artery disease, additional factors, such as hypertension and metabolic abnormalities associated with dialysis, promote CVD [18]. Approximately 80% of all dialysis patients manifest some form of heart disease and CVD accounts for 50% of deaths among ESRD patients [19].
Unlike the ESRD groups, no statistical significance was found in the analyses that included all CKD patients. The heterogeneous features of predialysis CKD patients affect these results. Predialysis patients exhibit diverse renal function and proteinuria, which are both independently associated with an increased risk of cardiovascular events. In contrast, most ESRD patients exhibit negligible renal function and undergo similar treatment. These homogeneous features of ESRD are similar to those of the non-CKD population. The lack of statistical significance may also be attributed to the relatively small number of stages 2 through 4 CKD patients in our cohort. Because coronary CTA is seldom performed in predialysis CKD patients due to the risk of iodine contrast-induced nephropathy, our study failed to include sufficient numbers of predialysis CKD patients. In contrast, because the stage 5 CKD patients were already on dialysis, there was little concern about inducing acute kidney injury by performing coronary CTA. Additional predialysis participants are needed to establish the actual effect of the pericoronary FAI on the mortality of all CKD patients. Therefore, it is appropriate to interpret the results of our study with a focus on ESRD patients.
In the restricted cubic spline analysis of dialysis patients, the risk of death increased linearly with increasing LAD FAI values, while in the analysis of the total CKD patient population the relationship between the LAD FAI values and the risk of death showed a J-shaped pattern. This result was attributed to the decreased risk of death as the LAD FAI values increased in predialysis CKD patients in contrast to the results involving ESRD patients. It is unclear why the association between the risk of death and LAD FAI values differed between patients undergoing dialysis and predialysis patients. As discussed above, due to the limited number and heterogeneity of predialysis patients in this study, we were unable to reach a definitive conclusion.
In our study, the pericoronary FAI was significantly elevated in the ESRD patients compared with the predialysis CKD patients. The results showed that vascular inflammation was markedly elevated in the ESRD patients. Chronic inflammation in ESRD is attributed to not only a decrease in the glomerular filtration rate but also the retention of uremic toxins, comorbidities, superimposed acute illness, gut dysbiosis, and the dialysis procedure itself [20ŌĆō22]. Careful selection of patients among this high-risk population and efforts to reduce their systemic inflammation are crucial in view of the association between vascular inflammation and mortality among ESRD patients in our study. Although there is no established therapy to reduce chronic inflammation in ESRD, many interventions have been proposed to decrease the production of inflammatory molecules and improve the clearance of mid-molecular-weight uremic toxins [20].
Oikonomou et al. [9] reported that the pericoronary FAI values of all three coronary arteries were significantly associated with all-cause mortality, and the pericoronary RCA and LAD FAI values were significantly associated with cardiac mortality. The RCA FAI was used as the representative predictor variable because all three coronary arteries were strongly correlated. In our study, the FAI values of all three coronary arteries were significantly associated with all-cause mortality in the unadjusted analyses, but after adjustment, only the association with the LAD FAI value was significant in the ESRD subgroup. Therefore, we used the LAD FAI as the main predictor variable instead of the RCA FAI. When measuring pericoronary fat attenuation, the LAD FAI has several advantages compared with the RCA and LCx FAI. The LAD has a relatively larger lumen diameter and is less affected by anatomic dominance [23]. In addition, the LAD is less sensitive to motion artifacts than the RCA [24,25]. The LAD is an appropriate artery for calculating fat attenuation given the convenience and reproducibility of the measurement.
Previous studies of CTA findings in ESRD reported that patients with ESRD carried a higher burden of atherosclerosis, and the coronary artery calcium score showed great promise for screening and risk stratification of coronary artery disease [26,27]. However, limited data are available to evaluate the utility of coronary CTA in patients with predialysis CKD because of the risk of contrast-induced nephropathy in this population [28]. Thus our findings regarding the pericoronary FAI in ESRD patients significantly impact the role of CTA in predialysis CKD patients. Until recently, the protocol to measure pericoronary FAI required contrast enhancement because it is based on a coronary CTA scan, which limits the widespread use of pericoronary FAI as an imaging biomarker in CKD patients. However, contrast enhancement is not always necessary when measuring the attenuation of fat component around the blood vessels [29]. Future studies should include measurement of the pericoronary FAI on non-enhanced computed tomography (CT) scans, and standardization and validation of the pericoronary FAI thresholds. With the burden of contrast nephrotoxicity negated, non-enhanced CT may provide useful information about the cardiovascular risk using pericoronary FAI and coronary calcium scoring, which improves the risk stratification in all stages of CKD, enabling timely intervention.
Our study had several limitations. First, the proportion of patients with stage 5 CKD was high and there were few stages 2 through 4 CKD patients because, as mentioned previously, the risk of CTA-associated contrast-induced nephropathy may not be warranted in predialysis patients, unlike patients on dialysis. Because the composition of CKD patients included in this study and mortality risks varied compared with the actual CKD patients, there was a risk of selection bias. Second, cardiac mortality was not included as a study outcome because the reported cause of death did not depend on an accurate medical assessment, which was regrettable because CVD is considered a main cause of death in patients with high pericoronary FAI values. However, all-cause mortality was a valid study outcome because CVD is the major cause of death in CKD patients. Third, this study was conducted at a single center and included only a single race (East Asians). Therefore, care should be taken before applying the results of this study to different patient groups.
In conclusion, the pericoronary FAI, especially the LAD FAI, is an excellent CTA marker predicting the mortality of ESRD patients, and provides an opportunity for early detection and primary prevention of CVD in ESRD patients. Future studies are needed to develop an effective intervention to reduce vascular inflammation and improve the prognosis of ESRD patients.


 PDF Links
 PubReader
 ePub Link
 Full text via DOI
 Download Citation
 Supplement 1
 Print
Print


")


