


Introduction
Obesity is a major public health problem that is increasing worldwide [1], and its prevalence in Korea increased from 29.2% in 2001 to 34.6% in 2018 [2]. Obesity and metabolic syndromes are recognized as risk factors for the development and progression of chronic kidney disease (CKD) by various mechanisms [3,4]. In a previous nationwide cohort study in Korea, obesity (body mass index [BMI] ≥ 25.0 kg/m2) was identified as an independent risk factor for CKD progression [5]. Moreover, obesity also adversely affects allograft function in kidney transplant (KT) recipients (KTRs). A study reported that recipient obesity was an independent risk factor for death-censored graft loss (DCGL) and biopsy-proven acute rejection (BPAR) [6]. Another study also reported that recipient obesity was an independent risk factor for overall graft loss [7]. Furthermore, a meta-analysis reported that recipient obesity had a marginally greater risk for DCGL [8].
Pretransplant sensitization to human leukocyte antigen (HLA) is a well-known risk factor associated with adverse allograft outcomes [9]. Presensitization to HLA is not only associated with a high rate of acute antibody-mediated rejection (ABMR) but also with the gradual development of chronic allograft tissue injury caused by humoral immune system activation. Indeed, the development of chronic ABMR was significantly higher in patients with presensitization to HLA compared to patients with low immunologic risk [10–12]. Moreover, both preformed persistent donor-specific antibody (DSA) and preformed cleared DSA showed an increased risk of graft loss [9]. Another study reported that preformed donor-specific anti-HLA antibodies (HLA-DSAs) with mean fluorescence intensity (MFI) > 3,000 had an increased risk of graft loss [13].
Therefore, both obesity and pretransplant sensitization to HLA in KTRs might contribute to the progression of chronic allograft tissue injury and adverse allograft outcomes, although the mechanisms are different. However, it has not been investigated whether both factors have an interactive effect on allograft outcomes. Hence, in this study, we analyzed the short- and long-term graft outcomes in KTRs with high BMI and presensitization to HLA and investigated the interaction between high BMI and HLA presensitization status.
Methods
Study design
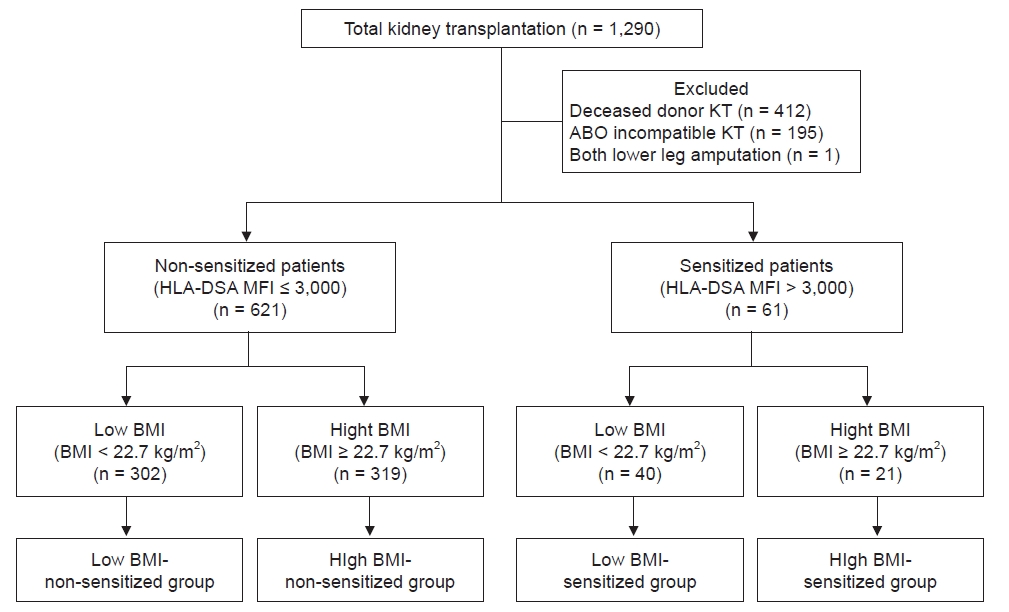
This was a retrospective observational single-center study. Between January 2010 and December 2018, 1,290 KTs were performed at the Seoul St. Mary’s Hospital in Seoul, South Korea. Of these, 412 patients received a kidney from a deceased donor, 195 cases were ABO-incompatible KTs, and 1 KTR had both legs amputated; these cases were excluded from the study. Finally, 682 KTRs were included in this analysis. The distribution of BMI in the KTRs is presented in Supplementary Fig. 1 (available online), and the median BMI value was 22.7 kg/m2. Patients with BMI of ≥22.7 kg/m2 were categorized in the high BMI group, while others were classified in the low BMI group. The cases were defined as presensitized to HLA when the MFI value of HLA-DSA at baseline was higher than 3,000 [13] and as non-sensitized when the value was below 3,000. Based on the above classifications, KTRs were divided into four groups: low BMI-non-sensitized, high BMI-non-sensitized, low BMI-sensitized, and high BMI-sensitized as presented in Fig. 1. This study followed the Declaration of Helsinki and was approved by the Institutional Review Board (IRB) of Seoul St. Mary’s Hospital (No. XC15RIMI0072K). As it was a retrospective study using data obtained from medical records, informed consent was waived by the IRB.
Human leukocyte antigen typing, human leukocyte antigen antibodies, and donor-specific antibody
HLA typing and HLA antibodies were measured as described previously [14,15]. Briefly, HLA-A, HLA-B, HLA-DR, and HLA-DQB1 typing was performed using deoxyribonucleic acid molecular typing with sequence-specific oligonucleotide probes with Lifecodes HLA SSO typing kits (Immucor, Stamford, CT, USA). Lifecodes LSA Class I and Class II kits (Gen-Probe Transplant Diagnostic Inc., Stamford, CT, USA) or LABScreen Single Antigen (One Lambda Inc., Thermo Fisher Scientific, Canoga Park, CA, USA) were used to detect HLA antibodies in the recipient sera. The manufacturer’s instructions were followed and 10 μL of each serum sample was used. The fluorescence intensities of the samples were measured using a Luminex 200 system (Luminex Corp., Austin, TX, USA).
Desensitization protocols for presensitized patients
The desensitization protocol in our center has been described previously [16–18]. Briefly, the desensitization protocol for HLA presensitized patients consisted of rituximab, total plasma exchange (TPE), and intravenous immunoglobulin (IVIG). Rituximab was administered 2 weeks to 1 month before the transplantation and TPE was performed seven times using 5% albumin and fresh frozen plasma. The control of TPE frequency was based on the MFI titer of HLA-DSAs. IVIG was administered at a dose of 100 mg/kg for 1 hour after every TPE. In patients with an HLA-DSA MFI titer of 1,000 to 3,000 or panel reactive antibody (PRA, Class I or Class II) of >50% with no HLA-DSAs, only rituximab was administered before transplantation. In all patients who underwent desensitization, prophylactic agents were used to prevent Pneumocystis jirovecii pneumonia (PJP) and cytomegalovirus (CMV) infection. If the crossmatch (XM) test of T-cell complement-dependent cytotoxicity (CDC) was positive or HLA-DSAs were present, and the MFI of HLA-DSAs did not decrease adequately after three cycles of TPE, a bortezomib-based protocol was used, in which bortezomib was administered four times in addition to the desensitization protocol.
Clinical parameters and outcomes
The age, sex, height, and weight of the donor and estimated glomerular filtration rate (eGFR) based on the Chronic Kidney Disease-Epidemiology Collaboration (CKD-EPI) equation were collected as baseline characteristics. The age, height, and weight of the KTR and the Mosteller body surface area (BSA) ratio of donor to recipient, history of diabetes mellitus (DM) and hypertension (HTN), cause of end-stage renal disease (ESRD), previous dialysis modality, previous dialysis period, and previous KT history were collected as baseline demographic characteristics. Total cholesterol, triglyceride, high-density lipoprotein (HDL)-cholesterol, low-density lipoprotein (LDL)-cholesterol, hemoglobin A1c levels, and hepatitis C virus (HCV) seropositivity rates were obtained from pretransplant investigations. The results of the XM test using CDC and flow cytometry crossmatch (FCXM), HLA-DSA and MFI results by Luminex single antigen assay, and PRA titers were obtained as a pretransplant immunoassay. Transplantation information included mismatch number, type of induction therapy, the main immunosuppressant used, and drugs used for desensitization.
We analyzed the incidence of BPAR within 1-year of transplantation (early acute rejection), CMV infection, BK viremia, and PJP rates as short-term clinical outcomes in the four groups. The variables used for analyzing long-term clinical outcomes included BPAR incidence after 1-year of transplantation (late acute rejection), chronic active ABMR, and biopsy-proven calcineurin inhibitor (CNI) toxicity rates. DCGL and patient death rates were also analyzed.
CMV infection and BK viremia were screened with CMV real-time quantitative (RQ) polymerase chain reaction (PCR) and BK virus real-time (RT) PCR through blood tests at 1- to 2-month intervals until 1 year after transplantation. From 1 year after transplantation, screening was performed with CMV RQ-PCR and BKV RT-PCR every 6 months to 1 year. Moreover, CMV RQ-PCR and BKV RT-PCR tests were performed when renal function deterioration occurred or when the clinician determined that the tests were necessary.
Allograft kidney biopsy was performed in cases of unexpected renal allograft dysfunction (serum creatinine of 25% above the baseline), unexpected development of proteinuria, and development of de novo HLA-DSA. Allograft kidney biopsy findings were interpreted according to the Banff classification in 2009. BPAR was diagnosed with allograft biopsy as suitable for acute T-cell mediated rejection (TCMR) and acute ABMR criteria according to the Banff classification. Similarly, chronic active ABMR and biopsy-proven CNI toxicity were diagnosed with allograft biopsies according to the Banff classification [19]. Death-censored allograft survival duration was defined as the period from KT to dialysis or preemptive KT, except for patient death in a functioning allograft. Patient survival duration was defined as the period from KT to death due to any cause. The data of changes in allograft function based on serum creatinine levels were collected until 4 years after KT.
The primary outcome of this study was to compare the impact of BMI on DCGL in non-sensitized and sensitized patients. Secondary outcomes of this study were early acute rejection, CMV infection, BK viremia, PJP, late acute rejection, chronic active ABMR, biopsy-proven CNI toxicity, patient death rates, and eGFR based on the CKD-EPI equation [20].
Statistical analysis
All continuous variables were expressed as mean ± standard deviation. If the variables followed a normal distribution, an analysis of variance was performed. If the variables showed a non-normal distribution, a Kruskal-Wallis test was performed. Tukey or Dunnett T3 method was performed for post hoc analysis. All categorical variables were compared using the chi-square test or Fisher exact test and expressed as proportions. A multivariable Cox hazard regression model analysis was performed to determine the risk factors affecting DCGL and to investigate the interaction between high BMI and HLA presensitivity. Cumulative survival rates were analyzed during the follow-up period in the four groups by Kaplan-Meier survival analysis. Causes of DCGL and patient death were compared using the chi-square test or Fisher exact test. The mean eGFR (CKD-EPI) and standard deviation in the four groups were evaluated. All statistical analyses were performed using IBM SPSS version 24 (IBM Corp., Armonk, NY, USA) and Microsoft Excel 2016 (Microsoft, Redmond, WA, USA).
Results
Comparison of baseline clinical and laboratory parameters according to body mass index and human leukocyte antigen presensitization status
The mean duration of follow-up of the patients included in this study was 61.8 months. The baseline characteristics of the four groups are shown in Table 1, 2. Among donor factors, there were no statistical differences among the groups in terms of old age, sex, and eGFR; however, the normal weight of the donors (BMI, 18.5–23.0 kg/m2) was relatively higher in the low BMI-sensitized group (21 of 40, 52.5%; p = 0.04) than those in the other groups. Regarding the clinical demographics of recipients, the proportion of elderly patients was not significantly different among the four groups, but the proportion of male patients was higher in the non-sensitized groups, especially in the high BMI-non-sensitized group (235 of 319, 73.7%; p < 0.001). According to BMI categories, grossly obese patients were observed only in the high BMI-non-sensitized group (25 of 319, 7.8%; p < 0.001). The donor/recipient (D/R) BSA ratio was significantly lower in the high BMI-non-sensitized group than in other groups (0.94 ± 0.13, p < 0.001). The proportions of recipients with DM and HTN were higher in the high BMI groups (p < 0.001, for each). The mean triglyceride and hemoglobin A1c levels were significantly higher, and HDL-cholesterol levels were lower in both high BMI groups (p < 0.001, for each). Regarding factors that cause ESRD, previous renal diseases had high proportions of DM in the high BMI groups, and other causes showed various distributions between groups. Among the types of dialysis modality, the proportion of peritoneal dialysis was the highest in the high BMI-non-sensitized group (47 of 319, 14.7%; p = 0.02).
In the baseline immunologic test, the proportions with a positive XM test through both CDC and FCXM were significantly higher in the sensitized groups (p < 0.001 for each) than in the non-sensitized groups; however, no difference in the rate of positivity was seen within the sensitized groups according to BMI status. The MFI values of HLA-DSAs were significantly higher in the sensitized groups than in the non-sensitized groups. The proportion of previous KT history was the highest in the low BMI-sensitized group (13 of 40, 32.5%; p < 0.001). Antithymocyte globulin was used as induction therapy, and the proportion of desensitization therapy was significantly higher in the sensitized groups (p < 0.001 for each).
Comparison of short- and long-term clinical outcomes and allograft functions according to body mass index and presensitization status
Table 3 shows the short- and long-term clinical outcomes of the compared groups. In the short-term clinical outcomes, the rates of early ABMR were significantly higher in the sensitized groups (p < 0.001), but there was no significant difference within the sensitized groups according to BMI status. CMV infection and BK viremia rates tended to be higher in the sensitized groups but without statistical significance (p = 0.08 and p = 0.18, respectively). The median duration until CMV infection after transplantation was 33 days, and the median duration until BK viremia was 99 days. Early TCMR and PJP rates did not show significant differences between the four groups. In long-term clinical outcomes, the rate of late ABMR tended to be the highest in the high BMI-sensitized group, although the difference was not significant (2 of 21, 9.5%; p = 0.15). There were no significant differences in the rates of late TCMR, chronic active ABMR, and biopsy-proven CNI toxicity between the groups.
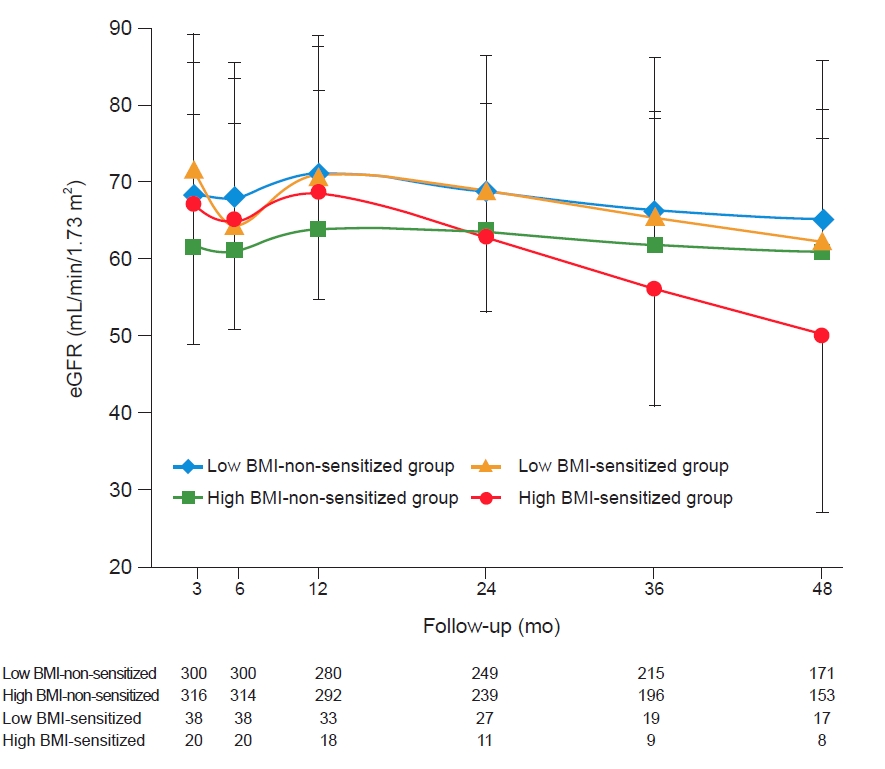
Fig. 2 shows the change in mean eGFR during the follow-up period after transplantation in the four groups. Although eGFR did not show significant differences between the compared groups, the decline in eGFR was higher in the high BMI-sensitized group than in the other three groups. Moreover, in this group, eGFR was less than 60 mL/min/1.73 m2 after 3 years of KT, while it was more than 60 mL/min/1.73 m2 in the other groups.
Comparison of death-censored graft loss rate and its causes according to body mass index and presensitization status
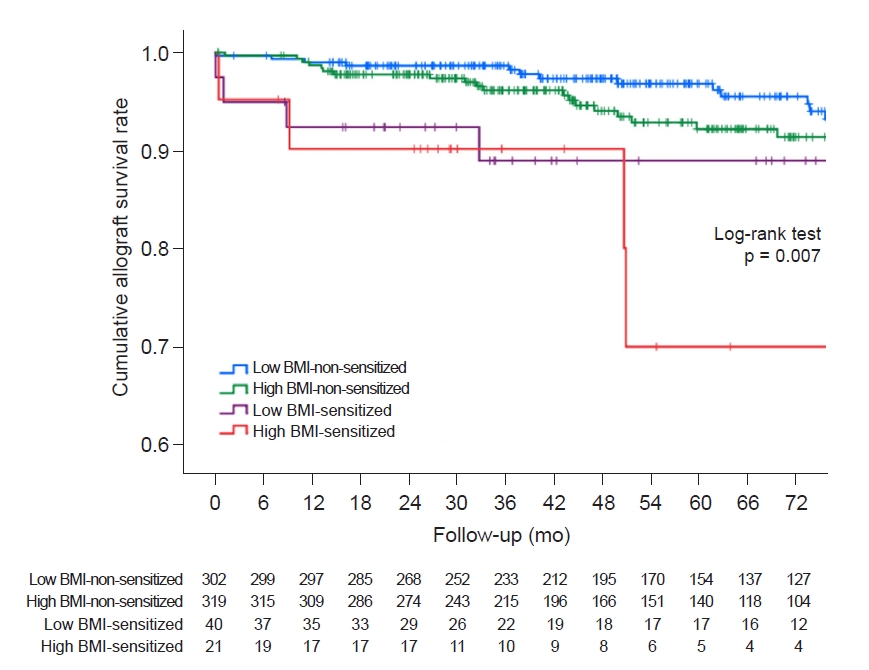
In all, 44 DCGL events occurred; of these, 14 were in the low BMI-non-sensitized group (14 of 302, 4.6%), 22 in the high BMI-non-sensitized group (22/319, 6.9%), and four in the low BMI-sensitized (4/40, 10.0%) and high BMI-sensitized groups (4/21, 19.0%). respectively (Table 4). There were no statistically significant differences in the causes of DCGL between the four groups. In the Kaplan-Meier survival analysis, the graft survival rate decreased significantly in the sensitized groups, and it was the poorest in the high BMI-sensitized group (Fig. 3, log-rank p = 0.007).
Table 5 shows the results of the multivariable Cox hazard regression model analysis. Model 1 adjusted baseline characteristics showed significant differences among the four groups, except for dialysis modality and vintage, and the variables were as follows: donor factors (age ≥ 65 years, sex, BMI categories, and eGFR), recipient factors (age ≥ 65 years, sex, D/R BSA ratio, triglyceride, HDL-cholesterol, hemoglobin A1c, HCV seropositivity, comorbidities, previous renal disease, previous KT history, PRA > 50%, and mismatch number). Model 2 included dialysis modality and vintage as adjusted variables. High BMI alone did not show a significant hazard ratio (HR) in any of the DCGL models. Presensitization status was observed as an independent risk factor for DCGL (univariable HR = 2.73, p = 0.01, adjusted HR = 2.90, p = 0.007 in model 1; and adjusted HR = 3.63, p = 0.004 in model 2). Interestingly, when high BMI and presensitization status were combined, HR increased further and was identified as a significant independent risk factor (univariable HR = 4.06, p = 0.008, adjusted HR = 3.82, p = 0.01 in model 1; and adjusted HR = 3.75, p = 0.03 in model 2). Moreover, high BMI and presensitization status showed a statistically significant interaction for DCGL (p-value for interaction = 0.008).
Comparison of patient death rate and its causes according to body mass index and presensitization status
Overall, 21 patients died; however, there was no significant difference in the rate of death between the four groups; 8 deaths occurred in the low BMI-non-sensitized group (8 of 302, 2.6%), 12 in the high BMI-non-sensitized group (12 of 319, 3.8%), 1 in the low BMI-sensitized group (1 of 40, 2.5%), and none in the high BMI-sensitized group (Table 4). When comparing the causes of death between the groups, there were no significant differences (Table 6).
Discussion
In this study, we analyzed the short- and long-term allograft outcomes according to the high BMI and HLA presensitization status of the recipients. We found that the high BMI-sensitized group had the most significant decline in allograft function among the four groups and the highest DCGL rates. Moreover, a high BMI with presensitization status was found to be an independent risk factor for DCGL. There was also a significant interaction between high BMI and pretransplant HLA sensitivity leading to adverse allograft outcomes.
In a previous study that analyzed BMI and allograft outcomes for 51,927 recipients from 1988 to 1997 in the United States Renal Database, the relative risk of graft loss (1.07, p = 0.047) increased significantly when BMI ≥ 28.0 kg/m2. The authors suggested the effects of various comorbidities and proinflammatory cytokines expressed in obesity were a reason for the poor allograft outcomes in obesity [21]. Additionally, a recent study reported that the risk of acute rejection may increase due to the relative underdosing of immunosuppressants in obese recipients [22]. However, in studies after 2000, obesity was not identified as a significant risk factor for graft loss (risk ratio, 0.99; 95% confidence interval, 0.83–1.19) [23]. Moreover, in a study that directly compared recipients from 1987 to 1999 and recipients from 2000 to 2016 in the Organ Procurement and Transplantation Network/United Network for Organ Sharing database, high BMI (≥30.0 kg/m2) was still an independent risk factor for graft loss, but the relative risk significantly decreased after 2000 [24]. The authors suggested that the recent development of an immunosuppressive regimen and general medical practice for comorbidities in transplant recipients may be the reason for this phenomenon [23,24].
The International Obesity Task Force of the World Health Organization (WHO) recommends that the Asian population sets the BMI value of obesity to 25.0 kg/m2 and the BMI value of overweight to 23.0 kg/m2 when analyzing comorbidity risk [25]. Previous studies that reported a worse allograft outcome in obesity (BMI ≥ 30 kg/m2) were not studies involving Asian populations [7,21,23,24]. We considered that setting the obesity criterion to BMI 25.0 kg/m2 according to the WHO recommendation would be appropriate for the Asian population in this study. Similar results were obtained when patients in this study were classified by using obesity (BMI ≥ 25.0 kg/m2), and the DCGL rate in the obesity-sensitized group was higher than that in the high BMI-sensitized group classified by BMI of ≥22.7 kg/m2 (Supplementary Table 1, available online). Furthermore, the median BMI value of 22.7 kg/m2 in this study, was close to the Asian population overweight cutoff value, and most patients in the high BMI group met the Asian overweight criteria.
In a recent study of 296,807 adult recipients from 2000 to 2019 in the Scientific Registry of Transplant Recipients database, the overall BMI reported a “J-shaped” risk profile for graft loss. However, in terms of graft loss and mortality, BMI has been reported to interact with various factors (recipient age, race/ethnicity, sex, and primary renal disease) of recipients. The authors emphasized the importance of personalized risk stratification rather than predicting recipient risk based on absolute BMI alone [26]. Accordingly, our study focused on the presensitization status among recipient factors, and the results showed a significant interaction between recipient BMI and presensitization status, which was an important finding.
In the comparison of baseline characteristics, the D/R BSA ratio was significantly lower in the high BMI-non-sensitized group in this study. Previously, a study had reported that if the D/R BSA ratio is less than 0.8, the allograft outcome is adversely affected [27]. This donor and recipient BSA mismatch may have influenced the allograft outcome in this study, but a high BMI with presensitization status was found to be an independent risk factor when this variable was adjusted in multivariable regression analysis. The rates of DM and HTN as comorbidities were higher in the high BMI groups, and laboratory parameters, such as triglyceride, HDL-cholesterol, and hemoglobin A1c, also showed suitable differences in metabolic syndromes as expected [28]. As reported previously, the rate of previous KT history was higher in the sensitized groups [29]. Lastly, the rate of peritoneal dialysis before transplantation was significantly higher in the high BMI group than in the low BMI group. Weight gain is thought to occur as a consequence of glucose absorption from the peritoneal dialysate in patients undergoing peritoneal dialysis [30].
In the comparison of short-term outcomes, the rates of CMV infection and BK viremia tended to be higher in the HLA presensitized groups. This could be due to immunosuppression caused by desensitization therapy despite adequate prophylaxis in the sensitized groups. In a nationwide cohort study in Korea, desensitization therapy has also been found to be a significant risk factor for infection-related mortality [31]. Early ABMR rates were higher in the sensitized groups, and the rates of late ABMR also tended to be higher in the sensitized groups. These results were consistent with those of previous studies, which showed that the acute rejection rate is higher despite appropriate desensitization therapy in patients with HLA presensitization [17,31]. In the comparison of long-term outcomes, a significant decline in allograft function was seen in the high BMI-sensitized group. Additionally, the high BMI-sensitized group had the poorest outcome in adjusted allograft DCGL, and high BMI and presensitization showed significant interaction.
This could be due to several reasons. First, the nephron mass of the donated kidney might be relatively inadequate for recipients with a high BMI. Simply put, a physiologic mismatch between the metabolic demand of the recipient and the nephron mass of the donated kidney may have an adverse allograft outcome [32]. Brenner et al. [33] have previously proposed a nephron underdosing theory for chronic allograft failure. They suggested that the transplantation of kidneys with a relatively large nephron mass compared to the recipients’ metabolic demand might lead to tolerance for future immunologic challenges, ischemic events, and CNI toxicities. Hence, in high BMI recipients with high metabolic demand, kidneys with relatively small nephron mass might be more susceptible to immunologic damage when accompanied by presensitization, resulting in poor allograft outcomes. This is reinforced by the fact that the donated kidney weight/recipient body weight ratio in the high BMI group was significantly low in this study (2.6 ± 0.7 vs. 3.4 ± 0.8, p < 0.001; Supplementary Table 2, available online).
Second, obesity is known to induce alloimmune dysregulation by decreasing adiponectin levels and increasing leptin levels. Adiponectin is known to inhibit B-cell lymphopoiesis, macrophage activation, T-cell proliferative response, and responses of helper T-cell (Th)-1 and Th-2 [34], and serum adiponectin levels are reported to decrease with visceral obesity [35]. In contrast, leptin is known to increase T-cell response, proinflammatory cytokines, recruitment of inflammatory cells, and activities of neutrophils, macrophages, and natural killer cells [34], and is reported to be positively correlated with adipose tissue mass [36]. Previously, a cross-sectional analysis of obese patients and control groups in humans showed a good correlation between leptin level and leukocyte count [37]. Moreover, it has recently been reported that B cells also play an important role in obesity through adipose tissue infiltration and activation [38]. In this study, the relatively rapid decline of the allograft function in the high BMI groups, especially in the high BMI-sensitized group, is probably due to the systemic chronic inflammation in the high BMI group. The presensitization status may interact with chronic inflammation status caused by high BMI, resulting in a worse allograft outcome.
This study has some limitations. First, this was a single-center, retrospective study with a relatively small sample size of only 682 cases. The number of patients in the high BMI-sensitized group was only 21 and only four patients developed graft loss events. However, repeat analysis based on BMI of ≥25.0 kg/m2 showed results that are consistent with previous studies (odds ratio for overall graft loss 1.85, p = 0.03; Supplementary Table 3, available online). Additionally, this study is important because it is the first to analyze the relationship between recipient BMI and presensitization status. The second limitation of the study was that it focused on the condition of the recipients before KT and did not analyze whether the patients developed obesity after KT. After KT, prednisolone and other immunosuppressive drugs are administered, which can lead to weight gain. It is not possible to exclude allograft outcomes that are affected by obesity developed after KT.
In conclusion, high BMI and HLA sensitization before KT significantly affect long-term allograft outcomes in terms of the decline in allograft function and survival in KT recipients. Our results suggest that active reduction and careful monitoring of BMI might be necessary, especially in patients with high immunologic risk. In the future, studies with larger sample sizes are needed to further clarify the relationship between high BMI and presensitization status.
 PDF Links
 PubReader
 ePub Link
 Full text via DOI
 Download Citation
 Supplement 1
 Print
Print


")


