Kidney Res Clin Pract > Volume 36(3); 2017 > Article
Hyun, Kim, and Lee: Red cell distribution width predicts incident dipstick albuminuria in Korean adults without chronic kidney disease

Abstract

Background

Red cell distribution width (RDW) is an emerging marker of inflammation and a predictor of high cardiovascular morbidity and mortality as well as all-cause mortality. A previous cross-sectional study showed that RDW was associated with microalbuminuria, an indicator of target organ damage. However, the longitudinal association of RDW and development of albuminuria is not known.

Methods

We analyzed 83,040 participants without chronic kidney disease (CKD) at baseline who underwent two health check-ups at a 4-year interval during 2005 to 2014. Urine albumin was determined by single urine dipstick semi-quantitative analysis, and incident albuminuria was defined as ≥ 1+ dipstick albumin at the second check-up. We used logistic regression analysis to determine the relationship between RDW and incident albuminuria.

Results

Participants were divided into quartiles according to baseline RDW. After 4 years, 982 cases of incident albuminuria were observed. The cumulative incidences of albuminuria were 0.94, 1.05, 1.18, and 1.62% for the 1st through 4th quartiles of RDW, respectively. Multivariate logistic analysis showed that the odds ratios (95% confidence interval) for incident albuminuria compared to those in the 1st quartile were 1.11 (0.92–1.34), 1.26 (1.04–1.52), and 1.88 (1.58–2.24) for the 2nd, 3rd and 4th quartiles, respectively.

Conclusion

RDW was associated with development of albuminuria in relatively healthy Korean adults without CKD. Further research is needed to verify the role of RDW in the development of albuminuria and renal injury.

Introduction

Red cell distribution width (RDW) expressed as a percentage is a measure of the variation in red blood cell size and is routinely reported in a complete blood count [1]. RDW in association with mean corpuscular volume (MCV) has traditionally been useful for diagnosing certain types of anemia, as RDW is increased in iron deficiency, sickle cell disease, myelodysplasia, and chronic liver disease [2].
Recent evidence has shown that a high RDW is associated with high cardiovascular morbidity and mortality as well as all-cause mortality [3,4]. Thus, RDW is considered an emerging risk prediction tool that is both inexpensive and easy to measure. However, the mechanisms underlying these associations with RDW are not well understood.
There are a growing numbers of studies on RDW and its association with the kidneys, most of which have demonstrated that RDW has predictive power for poor prognosis in patients with existing chronic kidney disease (CKD) [58]. On the other hand, only a few studies have investigated the association between RDW and the development of renal disease [9,10]. Albuminuria is not only a well-known marker of target organ damage in hypertension and diabetes, but is also an important component for diagnosing CKD [11,12]. Furthermore, albuminuria is a strong risk factor for poor renal outcome in CKD as well as high cardiovascular and all-cause mortality in the general population [13,14]. A few studies comprising relatively small numbers of patients have reported an association between RDW and albuminuria in a high-risk group with hypertension and diabetes [1517], while one large study with national data verified the relationship between RDW and albuminuria [18]. However, because these studies were cross-sectional by design, they are unable to provide evidence of a causal relationship.
The purpose of this study was to analyze the relationship between RDW and development of albuminuria in patients without evidence of CKD and to confirm this association in a large-scale longitudinal study.

Methods

Study design and population

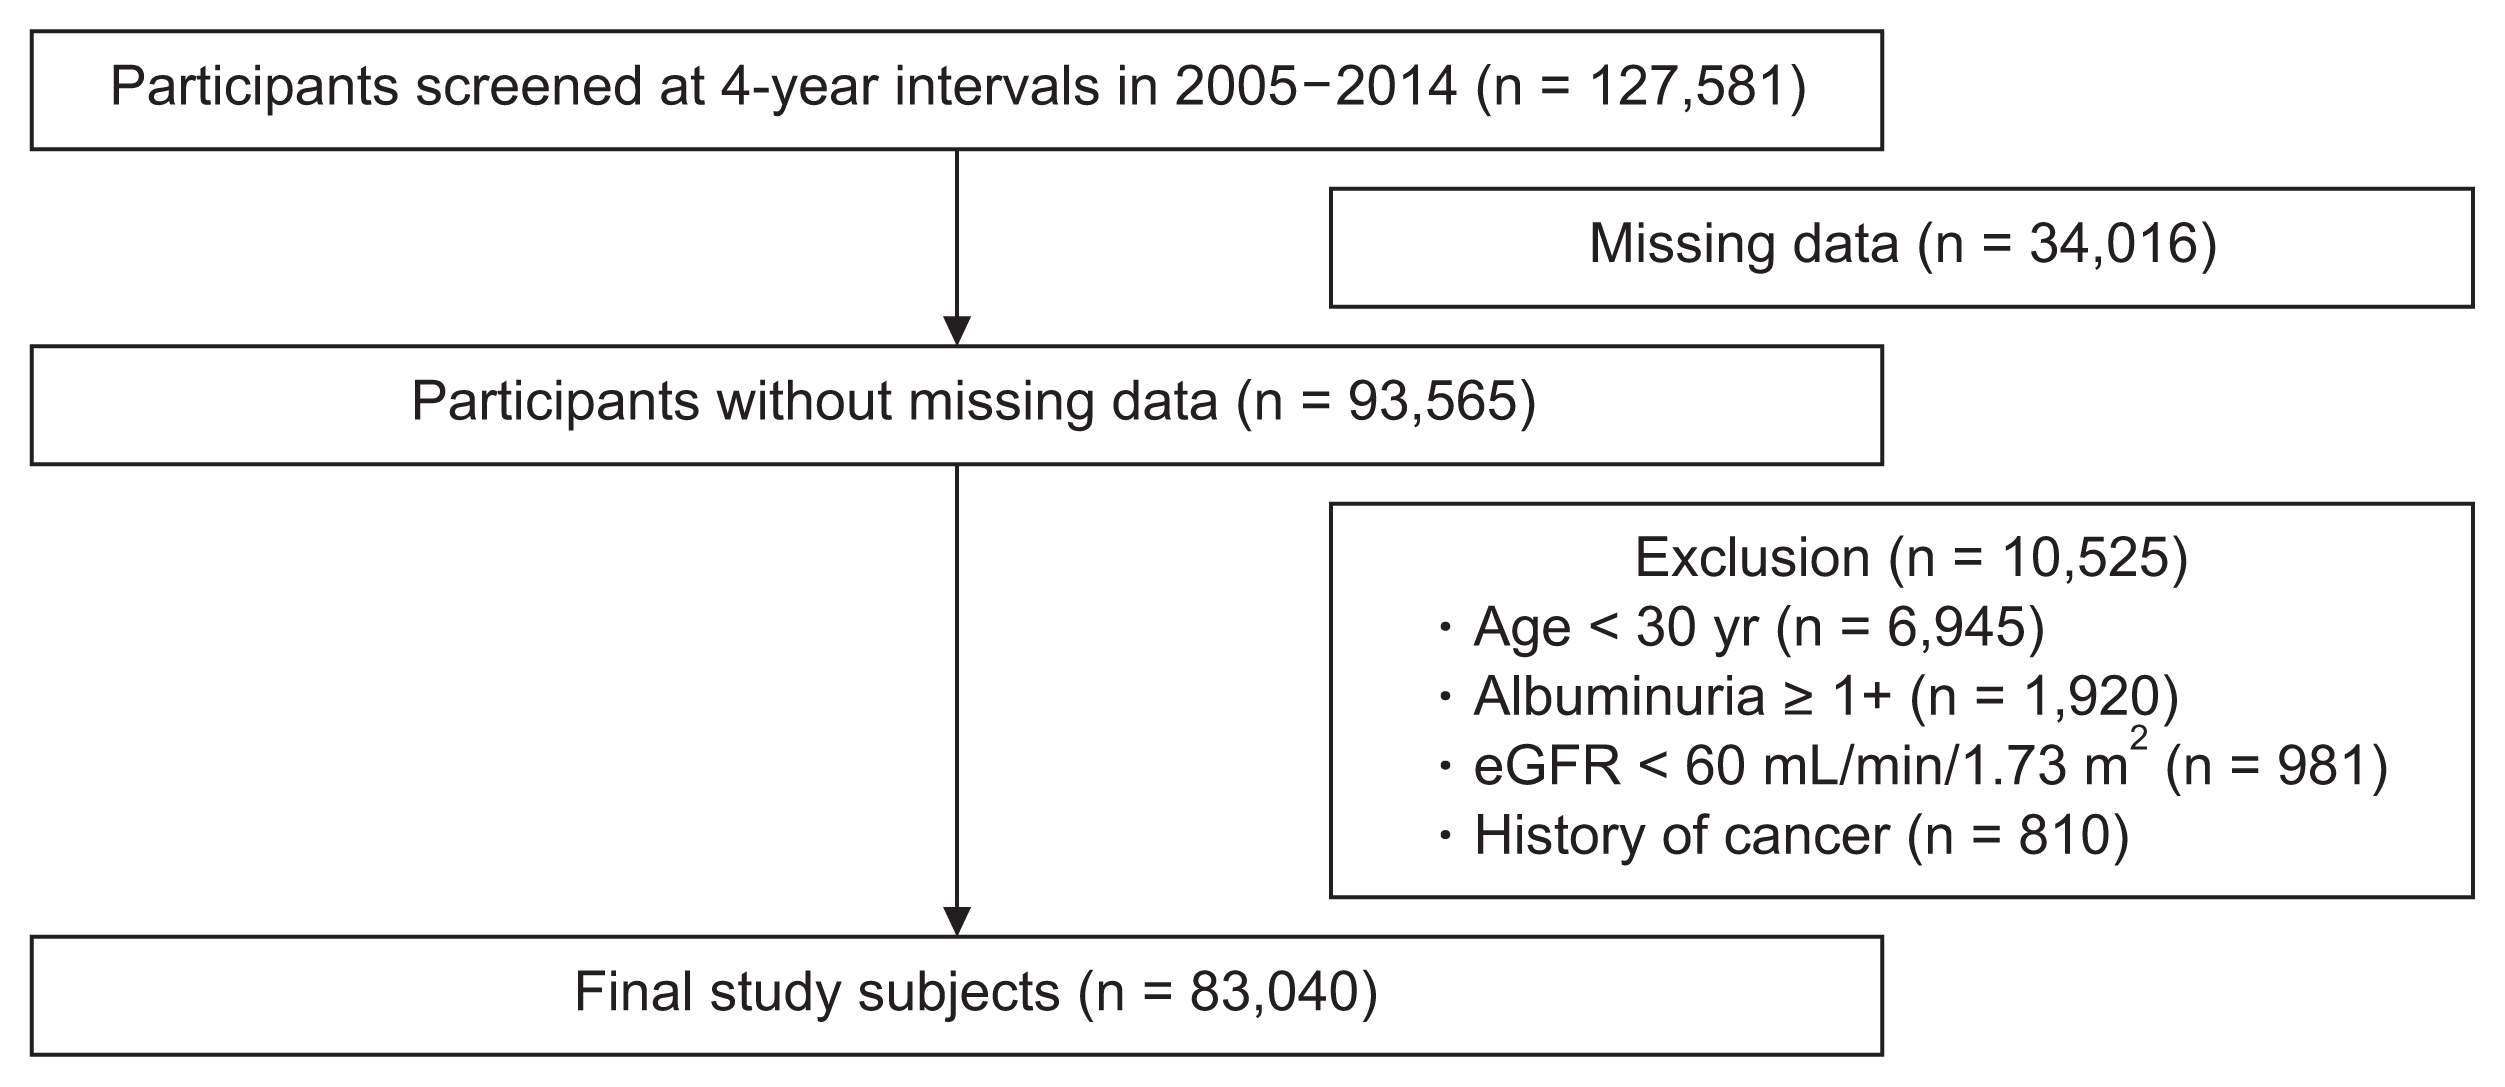
We constructed a retrospective cohort using participants who received regular health maintenance exams at Kangbuk Samsung Hospital, Sungkyunkwan University, Seoul, Korea. A total of 127,581 participants who visited the center twice at a 4-year interval between 2005 and 2014 were considered for inclusion in the study cohort. We excluded 34,016 records due to missing data for the variables of interest. We also excluded subjects aged < 30 years in order to prevent the possibility of orthostatic proteinuria (n = 6,945). We further excluded participants with evidence of CKD (dipstick albuminuria ≥ 1+, n = 1,920; estimated glomerular filtration rate [eGFR] < 60 mL/min/1.73 m2, n = 981) or a history of cancer (n = 810) at baseline. The final analysis included 83,040 participants. The process for constructing the retrospective cohort is summarized in Fig. 1. This study was approved by the Institutional Review Board at Kangbuk Samsung Hospital (KBSMC 2017-01-033).

Clinical and laboratory measurements

The health check-up consisted of a medical history, physical examination, health-related behavior questionnaire, biochemistry studies, and anthropometric measurements. The examining physicians assessed each patient’s medical history and prior use of medications. Height, weight, and blood pressure were measured by trained nurses while the participants were wearing a light hospital gown without shoes. Body mass index (BMI) was calculated as weight (kg) divided by height squared (m2).
Blood specimens were sampled from an antecubital vein after > 12 hours of fasting. Hemoglobin, mean corpuscular volume, and RDW were measured with an automated hematology analysis system Sysmex XE-2100D (Sysmex Corporation, Kobe, Japan) and Advia 2120 (Siemens Medical Solutions Diagnostics, New York, NY, USA). Plasma glucose, total cholesterol, triglycerides (TG), low-density lipoprotein (LDL) cholesterol, high-density lipoprotein cholesterol, and uric acid level were measured using an autoanalyzer (Advia 1650 Autoanalyzer; Bayer Diagnostics, Leverkusen, Germany). Insulin was measured by immunoradiometric assay (Biosource, Nivelles, Belgium). Insulin resistance was assessed with the homeostasis model assessment of insulin resistance (HOMA-IR) calculated as fasting blood insulin (μU/mL) × FBG (mg/dL)/405. Serum creatinine level was measured with the alkaline picrate (Jaffe) method.
Trained medical technicians performed regular calibration and quality control for creatinine measurements during the study period using a validated calibrator and quality control materials. In addition, our clinical laboratory participated in an annual inspection and survey by the Korean Association of Quality Assurance for Clinical Laboratories and is certified for quality control and performance of various measurements. Because the laboratory method that was used to measure serum creatinine levels from 2002 to 2009 was not traceable to isotope dilution mass spectrometry, GFR was estimated using the 4-variable Modification of Diet in Renal Disease Study equation [19,20]. Urine albumin was determined at each examination with a single urine dipstick semi-quantitative analysis (URiSCAN Urine strip; YD Diagnostics, Yongin, Korea). Dipstick urinalysis was performed on fresh, midstream urine samples collected in the morning. The amount of urine albumin was reported as absent, trace, 1+, 2+, 3+, or 4+, corresponding to albumin levels of undetectable, 10, 30, 100, 300, or 1,000 mg/dL albumin, respectively. Albuminuria was defined as a grade ≥ 1+.
In this study, diabetes was defined as fasting glucose ≥ 126 mg/dL, a history of previously diagnosed diabetes, or the use of anti-diabetic medications. Hypertension was defined as systolic blood pressure ≥ 140 mmHg or diastolic blood pressure ≥ 90 mmHg, a history of hypertension, or the use of antihypertensive medications. Dyslipidemia was defined as total cholesterol > 240 mg/dL or previous history of dyslipidemia.

Statistical analyses

Continuous variables were expressed as the mean ± standard deviation for normally distributed variables or the median (interquartile range) if not normally distributed. Continuous variables were compared between two groups using Student’s t-test or the Mann–Whitney U test. Analysis of variance or the Kruskal–Wallis test was used for comparisons between the four groups. Categorical variables are expressed as percentages and compared using the χ2 test. We used multivariate logistic regression analysis to determine the odds ratios (ORs) for developing albuminuria by RDW quartile. The lowest RDW quartile was used as the reference. Covariates for multivariate analysis consisted of age, gender, BMI, hypertension, diabetes, dyslipidemia, hemoglobin, mean corpuscular volume, eGFR, high-sensitivity C-reactive protein (hsCRP), current smoking status, alcohol intake, and vigorous exercise frequency. For statistical calculations, we used Stata version 14.0 (StataCorp LP, College Station, TX, USA). Two-sided P values less than 0.05 were considered statistically significant.

Results

The baseline characteristics of study participants according to RDW quartile are summarized in Table 1. Unexpectedly, subjects who were in the 2nd or 3rd RDW quartile, but not the 4th, had worse metabolic characteristics. For example, BMI was 23.4 ± 3, 23.7 ± 3.1, 23.7 ± 3.1, and 23.3 ± 3.2 (P < 0.001) for the 1st through 4th quartiles, respectively. Likewise, the percentage of participants with hypertension was 10.8, 12.1, 12.9, and 11.0 (P < 0.001) for the 1st through 4th quartiles, respectively.
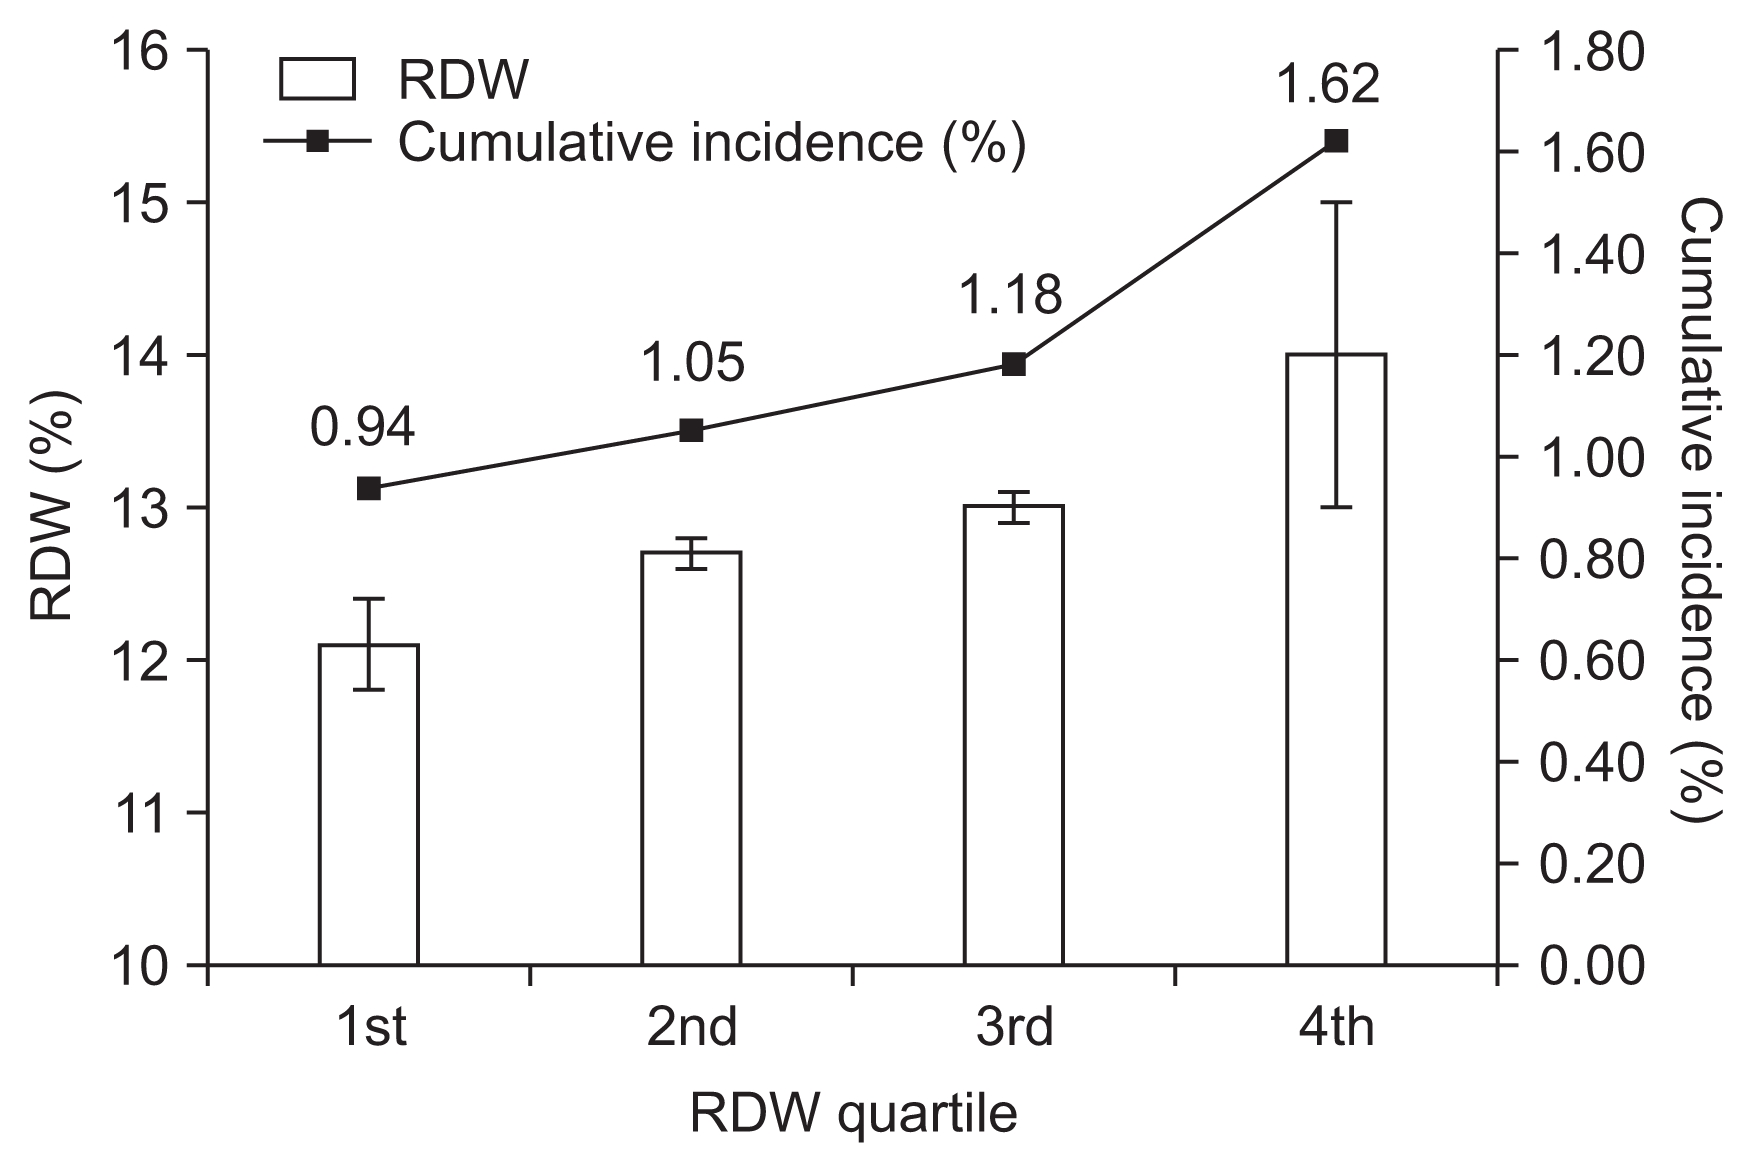
A total of 982 cases of incident albuminuria were observed in the retrospective cohort of 83,040 participants over a period of 4 years. The degree of albuminuria was 1+ in 712 participants, 2+ in 242 participants, 3+ in 17 participants, and 4+ in 11 participants. The numbers (%) of patients with incident albuminuria from the lowest to highest quartiles were 230 (0.94), 224 (1.05), 196 (1.18), and 332 (1.62), respectively (Fig. 2).
The characteristics of participants with incident albuminuria were compared to those without albuminuria and are shown in Table 2. In general, participants with incident albuminuria had an unhealthy profile compared to participants without albuminuria. Specifically, patients with incident albuminuria were older and had higher BMI, systolic blood pressure, diastolic blood pressure, serum glucose, total cholesterol, LDL cholesterol, TG, HOMA-IR, hsCRP, uric acid, and alcohol intake. Participants with incident albuminuria were also more likely to be male and current smokers and to have hypertension or diabetes.
Table 3 shows the association between RDW level and incident albuminuria according to multiple logistic regression analysis. The development of albuminuria was associated with a high RDW. As shown in Table 3, the OR for incident albuminuria in the 4th quartile compared to the 1st quartile was 1.88 (95% confidence interval, 1.58–2.24; P < 0.001) in the fully adjusted model 3. To test the robustness of this association, we repeated the analysis with different subgroups (Table 4). In the repeat analysis, the 4th quartile when compared to 1st quartile of RDW was associated with incident albuminuria in participants without diabetes or hypertension (OR, 1.86; P < 0.001), as well as in participants without hypertension or heart disease (OR, 1.82; P < 0.001). This result was similar for participants who were not underweight (OR, 1.92; P < 0.001).

Discussion

In this study, we found that high RDW was associated with incident dipstick albuminuria 4 years later in Koreans without previous CKD. This relationship was independent of markers of inflammation and nutrition as well as other potential risk factors for developing albuminuria.
Studies on RDW in the area of nephrology have largely addressed its potential to predict mortality, and RDW is indeed associated with high mortality in different CKD populations, including predialysis patients, patients on hemodialysis or peritoneal dialysis, and kidney transplant recipients [58]. However, little is known about the specific relationship between RDW and CKD, although several studies have investigated the association between RDW and renal function or albuminuria. Lippi et al [21] was the first to show an inverse and graded association between RDW and eGFR in a large Italian outpatient cohort. This inverse association was reaffirmed in 723 kidney transplant recipients and was shown to be independent of various comorbidities and markers of inflammation and nutrition [22]. In the present study, eGFR was low in patients with the highest RDW, which was compatible with the results of previous studies. In terms of albuminuria, Afonso et al [18] analyzed 8,499 representative participants in the National Health and Nutrition Examination Survey and found that elevated RDW was independently associated with microalbuminuria. A few other studies have demonstrated the same relationship in smaller, high-risk groups of patients such as those with hypertension or diabetes [15,16,23]. However, the studies described above were cross-sectional in design, and only two other small longitudinal studies have been performed. These longitudinal studies analyzed patients undergoing coronary angiography or percutaneous coronary intervention and showed that increased RDW predicts renal function decline after use of contrast media [9,10]. Thus, to the best of our knowledge, this is the first longitudinal study to show that high RDW predicts future development of albuminuria. Importantly, this relationship was valid in participants without major risk factors such as diabetes or hypertension, as well as participants who were not underweight, which is a possible risk factor for albuminuria [24].
The mechanism involved in RDW and incident albuminuria is not clear, but there are several possible explanations. First, RDW acts as a general marker of the severity of various comorbidities. For example, anisocytosis assessed as a high RDW is prevalent in different illness including cardiovascular disease, cancer, diabetes, lung disease, and liver disease [4], and most of these diseases are important risk factors for kidney damage and albuminuria. Although we corrected for major comorbidities and laboratory results in our analysis, it was not possible to completely cover the entire array and severity of all accompanying diseases. Second, previous studies have suggested that inflammation, oxidative stress, and malnutrition might mediate the association between RDW and poor outcome [25,26]. Certainly, inflammation and oxidative stress are closely related to albuminuria [27,28], and malnutrition is one of the important characteristics of CKD. Thus, the two conditions might be connected through a common pathway, although the specific mechanism should be clarified in the future. A third explanation is that a high RDW itself might be directly harmful to kidneys. Specifically, an increased RDW is associated with decreased RBC deformability, which can result in impairment of microcirculation and hypoxia [29]. In addition, RDW is also related to endothelial dysfunction assessed by flow-mediated dilation [30], and both hypoxia and endothelial dysfunction are associated with different diseases that present with albuminuria [31,32].
This study had several limitations. First, we measured albuminuria only once at each examination. However, transient albuminuria can be observed in conditions such as febrile illness, strenuous exercise, emotional stress, and urinary tract infection [33]. Second, we used the semi-quantitative dipstick test to evaluate albuminuria, which might be influenced by urine concentration. However, the effects of urine concentration would not favor a specific direction of results; thus, errors from variation in urine concentration would have been minimized by the large sample size. Third, we did not have information on the use of medications such as angiotensin-converting-enzyme inhibitors or angiotensin receptor blockers, which could affect the amount of albumin excretion. However, our results did not change after excluding patients with hypertension and heart disease, a population that has a high likelihood of taking these medications. Despite these limitations, the present study is significant in that it is the first to show an effect of high RDW on the development of albuminuria in individuals without CKD.
In conclusion, we identified a graded independent association between higher RDW and new onset dipstick albuminuria in Korean adults without previous CKD. Further research is warranted to determine the exact mechanism by which RDW leads to the development of albuminuria and renal injury.

Notes

Conflicts of interest

All authors have no conflicts of interest to declare.

Figure 1

Algorithm for selecting study subjects from health check-up participants

eGFR, estimated glomerular filtration rate.
krcp-36-232f1.jpg
Figure 2
Red cell distribution width (RDW; mean ± standard deviation) levels and cumulative incidences of albuminuria at the second examination.
krcp-36-232f2.jpg
Table 1
Baseline characteristics in relation to red cell distribution width (RDW)
Characteristic Total RDW quartile P value

1st (10.7–12.4) 2nd (12.5–12.8) 3rd (12.9–13.2) 4th (13.3–29.1)
Patient (n) 83,040 24,424 21,419 16,655 20,542
Age (yr) 36.1 (32.5–40.7) 35.1 (31.4–39.5) 36.2 (32.5–40.9) 36.6 (33–41.3) 36.9 (33.8–41.1) < 0.001
Sex, male 53,953 (65.0) 16,412 (67.2) 14,977 (69.9) 11,406 (68.5) 11,158 (54.3) < 0.001
BMI (kg/m2) 23.5 ± 3.1 23.4 ± 3.0 23.7 ± 3.1 23.7 ± 3.1 23.3 ± 3.2 < 0.001
SBP (mmHg) 113 ± 13 113 ± 13 114 ± 13 114 ± 13 113 ± 13 < 0.001
DBP (mmHg) 73 ± 9 73 ± 9 74 ± 9 74 ± 10 73 ± 10 < 0.001
Hemoglobin (g/dL) 14.7 ± 1.6 15.0 ± 1.3 15.0 ± 1.4 14.9 ± 1.4 14.1 ± 2.0 < 0.001
MCV (fL) 90.8 ± 4.5 91.2 ± 3.5 91.3 ± 3.7 91.2 ± 3.8 89.6 ± 6.3
Glucose (mg/dL) 94 ± 13 95 ± 14 94 ± 13 94 ± 12 93 ± 12 < 0.001
TC (mg/dL) 191 ± 33 190 ± 32 192 ± 33 192 ± 33 190 ± 33 < 0.001
LDL cholesterol (mg/dL) 110 ± 29 110 ± 28 112 ± 29 111 ± 29 108 ± 29 < 0.001
Triglyceride (mg/dL) 103 (72–152) 102 (72–150) 106 (75–156) 106 (74–158) 97 (69–145) < 0.001
HOMA-IR 1.13 (0.75–1.70) 1.15 (0.76–1.70) 1.13 (0.76–1.70) 1.11 (0.74–1.60) 1.08 (0.72–1.60) < 0.001
hsCRP (mg/dL) 0.04 (0.02–0.09) 0.04 (0.02–0.08) 0.05 (0.02–0.10) 0.05 (0.02–0.10) 0.04 (0.01–0.09) < 0.001
Albumin (mg/dL) 4.62 ± 0.23 4.64 ± 0.22 4.63 ± 0.22 4.62 ± 0.23 4.60 ± 0.24 < 0.001
eGFR (mL/min/1.73 m2) 82.0 ± 11.6 83.1 ± 11.8 81.8 ± 11.4 81.5 ± 11.8 81.3 ± 11.5 < 0.001
Uric acid (mg/dL) 5.5 ± 1.4 5.5 ± 1.4 5.6 ± 1.4 5.6 ± 1.4 5.2 ± 1.5 < 0.001
Hypertension 9,649 (11.6) 2,643 (10.8) 2,589 (12.1) 2,149 (12.9) 2,268 (11.0) < 0.001
Diabetes 1,834 (2.2) 549 (2.2) 488 (2.3) 391 (2.3) 406 (2.0) 0.064
Alcohol intake (≥10 g/day) 27,471 (33.1) 8,491 (34.8) 7,590 (35.4) 5,757 (34.6) 5,633 (27.4) < 0.001
Current smoker 25,051 (30.2) 7,962 (32.6) 6,827 (31.9) 5,193 (31.2) 5,069 (24.7) < 0.001
Vigorous exercise (more than once a week) 37,543 (45.2) 10,674 (43.7) 9,914 (46.3) 7,686 (46.2) 9,269 (45.1) < 0.001

Data are presented as number only, median (interquartile range), number (%), or mean ± standard deviation.

P values are for analysis of variance or Kruskal–Wallis tests for continuous variables and χ2 tests for categorical variables.

BMI, body mass index; DBP, diastolic blood pressure; eGFR, estimated glomerular filtration rate; HOMA-IR, homeostasis model assessment of insulin resistance; hsCRP, high-sensitivity C-reactive protein; LDL, low-density lipoprotein; MCV, mean corpuscular volume; SBP, systolic blood pressure; TC, total cholesterol.

Table 2
Characteristics of individuals with and without incident albuminuria
Characteristic Without albuminuria With albuminuria P value
Patient (n) 82,058 982
RDW (%) 12.9 ± 0.9 13.1 ± 1.0 < 0.001
Age (yr) 36.1 (32.5–40.6) 36.6 (33.2–40.9) 0.016
Sex, male 53,277 (64.9) 676 (68.8) 0.011
BMI (kg/m2) 23.5 ± 3.1 24.4 ± 3.6 < 0.001
SBP (mmHg) 113 ± 13 116 ± 14 < 0.001
DBP (mmHg) 73 ± 9 76 ± 10 < 0.001
Hemoglobin (g/dL) 14.7 ± 1.6 14.9 ± 1.7 < 0.001
MCV (fL) 90.8 ± 4.5 90.8 ± 4.8 0.767
Glucose (mg/dL) 94 ± 13 98 ± 24 < 0.001
TC (mg/dL) 191 ± 33 197 ± 34 < 0.001
LDL cholesterol (mg/dL) 110 ± 29 114 ± 30 < 0.001
Triglyceride (mg/dL) 103 (72–151) 116 (81–180) < 0.001
HOMA-IR 1.13 (0.75–1.66) 1.30 (0.92–2.06) < 0.001
hsCRP (mg/dL) 0.04 (0.02–0.09) 0.06 (0.03–0.11) < 0.001
Albumin (mg/dL) 4.62 ± 0.23 4.64 ± 0.24 0.071
eGFR (mL/min/1.73 m2) 82.0 ± 11.6 82.7 ± 12.3 0.093
Uric acid (mg/dL) 5.5 ± 1.4 5.6 ± 1.5 < 0.001
Hypertension 9,446 (11.5) 203 (20.7) < 0.001
Diabetes 1,778 (2.2) 56 (5.7) < 0.001
Alcohol intake (≥10 g/day) 27,057 (33.0) 414 (42.2) < 0.001
Current smoker 24,700 (30.1) 351 (35.7) < 0.001
Vigorous exercise (more than once a week) 37,081 (45.2) 462 (47.1) 0.245

Data are presented as number only, mean ± standard deviation, median (interquartile range), or number (%).

P values were obtained using the t-test or Mann-Whitney U test for continuous variables and the χ2 test for categorical variables.

BMI, body mass index; DBP, diastolic blood pressure; eGFR, estimated glomerular filtration rate; HOMA-IR, homeostasis model assessment of insulin resistance; hsCRP, high-sensitivity C-reactive protein; LDL, low-density lipoprotein; MCV, mean corpuscular volume; RDW, red cell distribution width; SBP, systolic blood pressure; TC, total cholesterol.

Table 3
Association between red cell distribution width (RDW) and incident albuminuria
RDW quartile Model 1 Model 2 Model 3


OR (95% CI) P value OR (95% CI) P value OR (95% CI) P value
1st Reference Reference Reference
2nd 1.10 (0.91–1.32) 0.315 1.10 (0.92–1.33) 0.294 1.11 (0.92–1.34) 0.266
3rd 1.24 (1.02–1.50) 0.028 1.24 (1.02–1.50) 0.029 1.26 (1.04–1.52) 0.021
4th 1.77 (1.49–2.10) < 0.001 1.85 (1.56–2.21) < 0.001 1.88 (1.58–2.24) < 0.001

Model 1, adjusted for age and gender; Model 2, adjusted for Model 1 and body mass index, hypertension, diabetes, dyslipidemia, hemoglobin, mean corpuscular volume, albumin, estimated glomerular filtration rate, and high sensitivity C-reactive protein; Model 3, adjusted for Model 2 and current smoking, alcohol intake, and vigorous exercise frequency.

CI, confidence interval; OR, odds ratio.

Table 4
Association between red cell distribution width (RDW) and incident albuminuria in different subgroups
RDW quartile Without diabetes and hypertension* (n = 72,182) Without hypertension and heart disease (n = 70,429) Without underweight (n = 79,902)

OR (95% CI) P value OR (95% CI) P value OR (95% CI) P value


1st Reference Reference Reference
2nd 1.13 (0.91–1.40) 0.262 1.10 (0.89–1.36) 0.393 1.13 (0.93–1.36) 0.208
3rd 1.31 (1.05–1.63) 0.017 1.26 (1.01–1.57) 0.043 1.26 (1.03–1.53) 0.022
4th 1.86 (1.52–2.27) < 0.001 1.82 (1.49–2.22) < 0.001 1.92 (1.61–2.29) < 0.001

* Adjusted for age, gender, body mass index (BMI), dyslipidemia, hemoglobin (Hb), mean corpuscular volume (MCV), albumin, estimated glomerular filtration rate (eGFR), high sensitivity C-reactive protein (hsCRP), current smoking, alcohol intake, and vigorous exercise frequency.

Adjusted for age, gender, BMI, diabetes, dyslipidemia, Hb, MCV, albumin, eGFR, hsCRP, current smoking, alcohol intake, and vigorous exercise frequency.

Adjusted for age, gender, BMI, hypertension, diabetes, dyslipidemia, Hb, MCV, albumin, eGFR, hsCRP, current smoking, alcohol intake, and vigorous exercise frequency.

CI, confidence interval; OR, odds ratio.

References

1. Sarma PR. Red cell indices. In: Walker HK, Hall WD, Hurst JW, Clinical methods. 3th edition. Boston: Butter-worths; p. 720–723. 1990.
2. Marks PW. Approach to anemia in the adult and child. In: Hoffman R, Benz EJ, Silberstein LE, Heslop H, Weitz J, Anastasi J, Hematology: basic principles and practice. 6th edition. Philadelphia, PA: Elsevier/Saunders; p. 418–426. 2013.
3. Danese E, Lippi G, Montagnana M. Red blood cell distribution width and cardiovascular diseases. J Thorac Dis 7:E402–E411. 2015;
pmid pmc
4. Salvagno GL, Sanchis-Gomar F, Picanza A, Lippi G. Red blood cell distribution width: A simple parameter with multiple clinical applications. Crit Rev Clin Lab Sci 52:86–105. 2015;
crossref pmid
5. Mucsi I, Ujszaszi A, Czira ME, Novak M, Molnar MZ. Red cell distribution width is associated with mortality in kidney transplant recipients. Int Urol Nephrol 46:641–651. 2014;
crossref pmid
6. Hsieh YP, Chang CC, Kor CT, Yang Y, Wen YK, Chiu PF. The predictive role of red cell distribution width in mortality among chronic kidney disease patients. PLoS One 11:e01620252016;
crossref pmid pmc
7. Sun IO, Chung BH, Yoon HJ, Kim JH, Choi BS, Park CW, Kim YS, Yang CW, Lee KY. Clinical significance of red blood cell distribution width in the prediction of mortality in patients on peritoneal dialysis. Kidney Res Clin Pract 35:114–118. 2016;
crossref pmid pmc
8. Vashistha T, Streja E, Molnar MZ, Rhee CM, Moradi H, Soohoo M, Kovesdy CP, Kalantar-Zadeh K. Red cell distribution width and mortality in hemodialysis patients. Am J Kidney Dis 68:110–121. 2016;
crossref pmid pmc
9. Akin F, Celik O, Altun I, Ayca B, Ozturk D, Satilmis S, Ayaz A, Tasbulak O. Relation of red cell distribution width to contrast-induced acute kidney injury in patients undergoing a primary percutaneous coronary intervention. Coron Artery Dis 26:289–295. 2015;
crossref pmid
10. Kurtul A, Yarlioglues M, Murat SN, Demircelik MB, Acikgoz SK, Ergun G, Duran M, Cetin M, Ornek E. Red cell distribution width predicts contrast-induced nephropathy in patients undergoing percutaneous coronary intervention for acute coronary syndrome. Angiology 66:433–440. 2015;
crossref pmid
11. Basi S, Fesler P, Mimran A, Lewis JB. Microalbuminuria in type 2 diabetes and hypertension: a marker, treatment target, or innocent bystander? Diabetes Care 31:Suppl 2. S194–S201. 2008;
crossref pmid
12. KDIGO. KDIGO 2012 clinical practice guideline for the evaluation and management of chronic kidney disease. Kidney Int Suppl 3:1–150. 2013.
13. Burton C, Harris KP. The role of proteinuria in the progression of chronic renal failure. Am J Kidney Dis 27:765–775. 1996;
crossref pmid
14. Matsushita K, van der Velde M, Astor BC, Woodward M, Levey AS, de Jong PE, Coresh J, Gansevoort RT. Chronic Kidney Disease Prognosis Consortium. Association of estimated glomerular filtration rate and albuminuria with all-cause and cardiovascular mortality in general population cohorts: a collaborative meta-analysis. Lancet 375:2073–2081. 2010;
crossref pmid pmc
15. Zhang M, Zhang Y, Li C, He L. Association between red blood cell distribution and renal function in patients with untreated type 2 diabetes mellitus. Ren Fail 37:659–663. 2015;
crossref pmid
16. Cheng D, Zhao J, Jian L, Ding T, Liu S. Relationship between red cell distribution width and early renal injury in patients with gestational diabetes mellitus. Ren Fail 38:1218–1223. 2016;
crossref pmid
17. Pusuroglu H, Akgul O, Erturk M, Surgit O, Tasbulak O, Akkaya E, Yazan S, Gül M, Türen S. Red cell distribution width and end-organ damage in patients with systo-diastolic hypertension. Arch Med Sci 12:319–325. 2016;
crossref pmid pmc
18. Afonso L, Zalawadiya SK, Veeranna V, Panaich SS, Niraj A, Jacob S. Relationship between red cell distribution width and microalbuminuria: a population-based study of multiethnic representative US adults. Nephron Clin Pract 119:c277–c282. 2011;
crossref pmid
19. Levey AS, Bosch JP, Lewis JB, Greene T, Rogers N, Roth D. A more accurate method to estimate glomerular filtration rate from serum creatinine: a new prediction equation. Modification of Diet in Renal Disease Study Group. Ann Intern Med 130:461–470. 1999;
crossref pmid
20. Levey AS, Coresh J, Greene T, Stevens LA, Zhang YL, Hendriksen S, Kusek JW, Van Lente F. Chronic Kidney Disease Epidemiology Collaboration. Using standardized serum creatinine values in the modification of diet in renal disease study equation for estimating glomerular filtration rate. Ann Intern Med 145:247–254. 2006;
crossref pmid
21. Lippi G, Targher G, Montagnana M, Salvagno GL, Zoppini G, Guidi GC. Relationship between red blood cell distribution width and kidney function tests in a large cohort of unselected outpatients. Scand J Clin Lab Invest 68:745–748. 2008;
crossref pmid
22. Ujszaszi A, Molnar MZ, Czira ME, Novak M, Mucsi I. Renal function is independently associated with red cell distribution width in kidney transplant recipients: a potential new auxiliary parameter for the clinical evaluation of patients with chronic kidney disease. Br J Haematol 161:715–725. 2013;
crossref pmid
23. Li ZZ, Chen L, Yuan H, Zhou T, Kuang ZM. Relationship between red blood cell distribution width and early-stage renal function damage in patients with essential hypertension. J Hypertens 32:2450–2455. discussion 2456. 2014
crossref pmid
24. Jang CM, Hyun YY, Lee KB, Kim H. The association between underweight and the development of albuminuria is different between sexes in relatively healthy Korean subjects. Nephrol Dial Transplant 29:2106–2113. 2014;
crossref pmid
25. Patel KV, Semba RD, Ferrucci L, Newman AB, Fried LP, Wallace RB, Bandinelli S, Phillips CS, Yu B, Connelly S, Shlipak MG, Chaves PH, Launer LJ, Ershler WB, Harris TB, Longo DL, Guralnik JM. Red cell distribution width and mortality in older adults: a meta-analysis. J Gerontol A Biol Sci Med Sci 65:258–265. 2010;
crossref pmid
26. Montagnana M, Cervellin G, Meschi T, Lippi G. The role of red blood cell distribution width in cardiovascular and thrombotic disorders. Clin Chem Lab Med 50:635–641. 2011.
crossref pmid
27. Upadhyay A, Larson MG, Guo CY, Vasan RS, Lipinska I, O’Donnell CJ, Kathiresan S, Meigs JB, Keaney JF Jr, Rong J, Benjamin EJ, Fox CS. Inflammation, kidney function and albuminuria in the Framingham Offspring cohort. Nephrol Dial Transplant 26:920–926. 2011;
crossref pmid
28. Ruiz-Hurtado G, Condezo-Hoyos L, Pulido-Olmo H, Aranguez I, Del Carmen, Gónzalez M, Arribas S, Cerezo C, Segura J, Praga M, Fernández-Alfonso MS, Ruilope LM. Development of albuminuria and enhancement of oxidative stress during chronic renin-angiotensin system suppression. J Hypertens 32:2082–2091. discussion 2091. 2014
crossref pmid
29. Patel KV, Mohanty JG, Kanapuru B, Hesdorffer C, Ershler WB, Rifkind JM. Association of the red cell distribution width with red blood cell deformability. Adv Exp Med Biol 765:211–216. 2013;
crossref pmid pmc
30. Solak Y, Yilmaz MI, Saglam M, Caglar K, Verim S, Unal HU, Gok M, Demirkaya E, Gaipov A, Kayrak M, Cetinkaya H, Eyileten T, Turk S, Vural A. Red cell distribution width is independently related to endothelial dysfunction in patients with chronic kidney disease. Am J Med Sci 347:118–124. 2014;
crossref pmid
31. Shao Y, Lv C, Yuan Q, Wang Q. Levels of serum 25(OH)VD3, HIF-1α, VEGF, vWf, and IGF-1 and their correlation in type 2 diabetes patients with different urine albumin creatinine ratio. J Diabetes Res 2016:19254242016;
crossref pmid pmc
32. Lamarca B. Endothelial dysfunction. An important mediator in the pathophysiology of hypertension during pre-eclampsia. Minerva Ginecol 64:309–320. 2012;
pmid pmc
33. Israni AK, Kasiske B. Laboratory assessment of kidney disease: glomerular filtration rate, urinalysis, and proteinuria. In: Taal MW, Chertow GM, Marsden PA, Skorecki K, Yu ASL, Brenner BM, Brenner and Rector’s The Kidney. 9th edition. Philadelphia, PA: Elsevier Saunders; 887:2012.


ABOUT
BROWSE ARTICLES
EDITORIAL POLICY
FOR CONTRIBUTORS
Editorial Office
#301, (Miseung Bldg.) 23, Apgujenog-ro 30-gil, Gangnam-gu, Seoul 06022, Korea
Tel: +82-2-3486-8736    Fax: +82-2-3486-8737    E-mail: registry@ksn.or.kr                

Copyright © 2024 by The Korean Society of Nephrology.

Developed in M2PI

Close layer