


Introduction
Anemia is a common complication in end-stage renal disease (ESRD) patients undergoing hemodialysis (HD) and leads to a poor prognosis due to cardiovascular complications and increased mortality [1]. After erythropoiesis-stimulating agents had been introduced as treatment options for anemia, the frequency of blood transfusions decreased and the quality of life improved in patients with ESRD [2,3]. The Kidney Disease Outcomes Quality Initiative (KDOQI) guidelines from the National Kidney Foundation recommend maintaining an appropriate hemoglobin (Hb) target of 11 to 12 g/dL in HD patients, while Hb values above 13 g/dL should be avoided [4]. However, in patients undergoing HD, it is difficult to maintain Hb levels in the adequate range for various reasons such as blood loss during dialysis, iron deficiency, malnutrition, chronic inflammation, secondary hyperparathyroidism, and insufficient dialysis doses. Therefore, only 30% of patients are within the target range while the others over- or undershoot the recommended target range [5]. Although the degree of Hb variability has decreased over the past 10 years [6], it remains a very common issue among HD patients, increasing the risk of overall mortality in these patients [7ŌĆō9].
Erythropoietin (EPO) administration is one of the main treatment options for anemia in patients with ESRD. However, the effects of the EPO administration route on Hb variability and cardiovascular outcomes in HD patients remain controversial. Recent studies have reported an increase in all-cause mortality in patients with high Hb variability [6,7,10]. Another study involving 5,037 HD patients found no association between cardiovascular mortality and Hb variability [11]. We previously reported that the risk of vascular access failure may be greater with subcutaneous (SC) EPO administration compared to intravenous (IV) EPO administration [12]. Since proliferative and other biological actions of EPO on vascular cells may be maximized by sustained EPO receptor activation and SC administration may yield a more sustained activation of EPO receptors than the IV route, SC administration may result in poorer outcomes regarding vascular access. However, cardiovascular outcomes did not significantly differ between the two groups in this study.
In the present study, we investigated the effects of different routes of EPO administration on Hb variability and the association between Hb variability and cardiovascular events in maintenance HD patients.
Methods
Study population
This is a post hoc analysis of a prospective, controlled, randomized, unblinded study comparing IV administration with the SC administration of EPO [12]. A previous randomized trial was conducted between October 1, 2000 and February 28, 2007 at the Hallym University Kangnam Sacred Heart Hospital and the Hallym University Chuncheon Sacred Heart Hospital in Korea. The enrollment criteria for patients were (1) patients aged 18 years or older receiving HD for more than 6 months, (2) patients receiving regular erythropoiesis-stimulating agents for anemia, and (3) patients with adequate iron storage (transferrin saturation Ōēź 20% and serum ferritin Ōēź 100 ng/mL). The exclusion criteria were patients with (1) severe hyperparathyroidism (serum intact parathyroid hormone Ōēź 800 pg/mL), (2) acute infection or systemic underlying inflammatory diseases, malignancy, or epilepsy, (3) severe congestive heart failure (New York Heart Association Classes III and IV), (4) gastrointestinal bleeding in the previous 3 months, (5) platelet count exceeding 500 ├Ś 103/┬ĄL, (6) pregnancy or lactation, (7) the use of androgens or immunosuppressive drugs during the past 3 months, (8) blood transfusion within 2 months before enrollment in the study, or (9) a history of hypersensitivity to EPO.
This study was approved by the Institutional Review Board of Hallym University Kangnam Sacred Heart Hospital (No. 2021-06-005). Due to retrospective nature of the study, the informed consent was waivered. All clinical investigations were conducted in accordance with the guidelines of the 2008 Declaration of Helsinki.
Study design
Patients were randomly assigned to receive EPO beta (Recormon; F. Hoffmann-La Roche, Ltd., Basel, Switzerland) by either the IV or SC route. Randomization was performed centrally using a random permuted block with stratification according to the clinical center, age (Ōēź60 or <60 years), and EPO dose (50 to 99, 100 to 149, or 150 to 200 U/kg/week). Following the enrollment of patients in this study, EPO was administered through IV or SC routes at the same doses that had been administered through the SC route prior to enrollment.
During the study, the EPO dose was increased or reduced by 25% compared to the previous dose when the Hb value decreased or increased by at least 1 g/dL, respectively. When Hb dropped below 9 g/dL, the EPO dose was increased by 25%, and when it was increased to at least 12 g/dL, the dose was reduced by 50%. At the time of enrolling patients in the study, the target Hb in the KDOQI guidelines was 11 to 12 g/dL [4]. However, in the present study, Hb was titrated within the range of 9 to 12 g/dL using the above algorithm to prevent excessive Hb corrections.
All the patients enrolled in the study received EPO two or three times/week. During the study period, patients were given oral or IV iron as needed (transferrin saturation < 20% or serum ferritin < 100 ng/mL). Blood specimens for laboratory analyses were drawn from the dialysis tubing before HD monthly. Single-pool Kt/V was determined using two-point urea modeling based on the intradialytic decrease in blood urea levels and intradialytic weight loss. It was computed with the use of the following modified rate equation: single-pool Kt/V = ŌĆōln [(1 ŌĆō urea reduction ratio) ŌĆō 0.008 ├Ś session length] + [4 ŌĆō 3.5 ├Ś (1 ŌĆō urea reduction ratio)] ├Ś ultrafiltration / postdialysis weight [13].
Evaluation of hemoglobin variability
Hb variability was assessed by the frequency exceeding the titrated target Hb range of 9 to 12 g/dL. During the entire study period, we measured Hb at 1-month intervals to calculate Hb variability. To evaluate the effects of Hb variability, we divided the study population into two groups based on whether the frequency of missing the target Hb exceeded 25% in an enrolled patient. Furthermore, Hb cycling was quantified by measuring Hb excursions defined as a series of decreasing or increasing monthly Hb values differing by at least 1.5 g/dL [14]. In addition, the degree of Hb variability was calculated by comparing the conventional standard deviation (SD), residual SD, and coefficient of Hb variation for each group [15]. For the assessment of EPO responsiveness according to the administration route, we used the erythropoiesis-stimulating agent responsiveness index (ERI), calculated as the average weekly EPO dose per kg body weight divided by the average Hb level (ERI = [EPO / body weight] / Hb) [16]. The laboratory values used in the analysis were baseline values. However, the EPO dose, ferric sucrose dose, ERI, SD, residual SD, and coefficient of Hb variation were time-averaged values.
The primary outcome was to investigate the degree of Hb variability according to the EPO administration route, while the secondary outcome was the occurrence of cardiovascular events according to the Hb variation. Cardiovascular events were defined as the occurrence of myocardial infarction, heart failure, and stroke.
Statistical analysis
All normally distributed numerical variables were expressed as the mean ┬▒ SD, whereas variables with skewed distributions were expressed as the median and interquartile range. Analyses of the differences in baseline characteristics according to the route of EPO administration were performed using the t test for continuous variables and the chi-square test for categorical variables. The Kaplan-Meier method was used to compare cardiovascular event-free survival curves, and differences were assessed using the log-rank test. Patients were censored when cardiovascular events occurred. Multivariate Cox regression analysis of cardiovascular event-free survival was performed with adjustments for age, the high-frequency group, diabetes, previous cardiovascular disease, and vintage dialysis (>18 months). Statistical analyses were performed using IBM SPSS version 26.0 (IBM Corp., Armonk, NY, USA). For all analyses, results were considered statistically significant if p < 0.05.
Results
Baseline characteristics
A total of 78 patients were enrolled and randomly assigned to the IV (40 patients) and SC (38 patients) groups. Among those, seven patients dropped out for the following reasons: five protocol violations; one withdrawal of consent; one history of blood transfusion. Accordingly, 71 patients (38 in the IV group and 33 in the SC group) completed the study. The mean follow-up period was 50.7 months (4ŌĆō77 months). Thirty-seven patients (51.1%) were men, and the mean age was 50.6 ┬▒ 12.5 years. The rate of patients who had diabetes mellitus was 35.2%, and the average number of Hb measurements was 46.8 ┬▒ 27.5 times.
The baseline characteristics of the two groups were similar except for the intact parathyroid hormone level, which was significantly higher in the IV group compared to the SC group (95.1 ┬▒ 87.3 pg/mL vs. 32.7 ┬▒ 33.1 pg/mL, p < 0.001) (Table 1). In the SC group, 54.5% of patients received iron treatment, which was significantly higher than the IV group (p < 0.001). There were no differences in administered EPO doses, transferrin saturation, and ferritin levels between the two groups. In addition, there was no significant difference between the two groups in iron saturation or ferritin during the follow-up period.
Hemoglobin variability by the route of erythropoietin administration
When comparing the Hb variability between the two groups, the frequency of the value being outside the target Hb range was significantly lower in the IV group than in the SC group (0.27 ┬▒ 0.12 vs. 0.36 ┬▒ 0.19 per visit, p = 0.03). However, the conventional SD, residual SD, and coefficient values of the other parameters did not differ between the two study groups (0.97 ┬▒ 0.23 vs. 1.02 ┬▒ 0.28, p = 0.43; 0.90 ┬▒ 0.23 vs. 0.97 ┬▒ 0.36, p = 0.31; and 0.10 ┬▒ 0.02 vs. 0.11 ┬▒ 0.03, p = 0.15, respectively). When the ERI was evaluated, there was no statistically significant difference between the IV group and the SC group (10.9 ┬▒ 3.0 vs. 11.7 ┬▒ 4.8 U/kg/week/g/dL, p = 0.61) (Table 2).
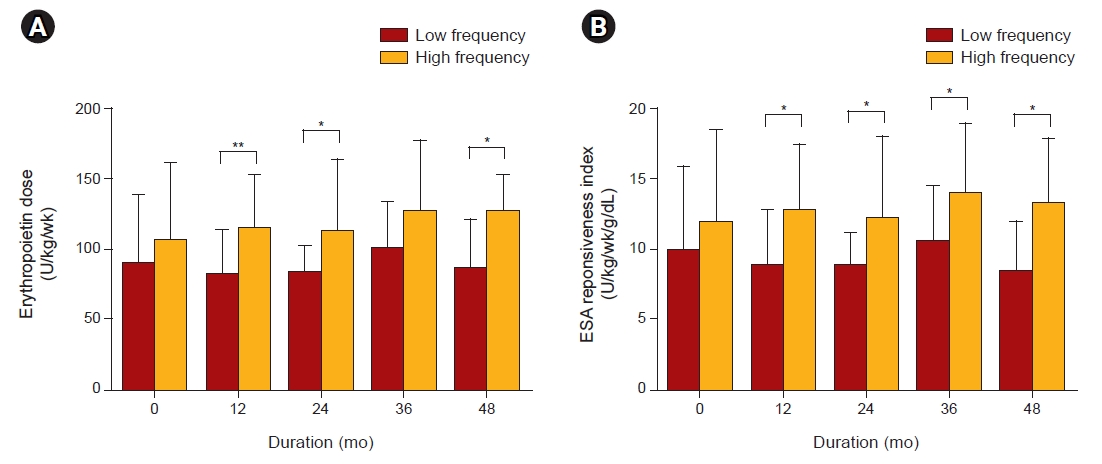
Based on the frequency of the value being outside the target Hb range, the study population was divided into groups of patients with frequencies above and below 25%, and the differences between these two groups were compared (32 patients in the low-frequency group and 39 patients in the high-frequency group) (Table 3). There was no statistically significant difference in the proportion of diabetes mellitus between the two groups. However, the proportion of diabetic patients in the high-frequency group was 46.2%, which was higher than that of the low-frequency group (21.9%) (p = 0.06). In the low-frequency group, 19 patients (59.4%) received EPO through IV administration and 13 patients (40.6%) received EPO through SC administration. In the high-frequency group, 19 patients (48.7%) received EPO through IV administration and 20 patients (51.3%) received EPO through SC administration. There was no difference between the two groups according to the route of administration (p = 0.51). The coefficient of Hb variation was significantly lower in the low-frequency group compared to the high-frequency group (0.10 ┬▒ 0.02 vs. 0.11 ┬▒ 0.03, p = 0.009). In the low-frequency group, the frequency of the lower limit level (<9 g/dL) for Hb was 0.15 ┬▒ 0.07 (per visit), and in the high-frequency group, it was 0.43 ┬▒ 0.16 (per visit) with Hb being significantly more frequent than the lower limit level of Hb (<9 g/dL) in the high-frequency group (p < 0.001). However, there was no difference in the initial laboratory test, EPO dose, ferric sucrose dose, ERI, conventional SD, and residual SD between these two groups. During the follow-up period, absolute Hb values did not differ between the two groups. However, the EPO requirement was significantly lower in the low-frequency group compared to the high-frequency group at 12, 24, and 48 months (81.8 ┬▒ 31.9 vs. 114.5 ┬▒ 38.6 U/kg/week, p < 0.001; 83.4 ┬▒ 19.2 vs. 112.3 ┬▒ 51.4 U/kg/week, p = 0.01; and 85.9 ┬▒ 34.7 vs. 126.7 ┬▒ 36.7 U/kg/week, respectively; p = 0.001) (Fig. 1A). Similarly, the ERI was lower in the low-frequency group than in the high-frequency group at 12, 24, 36, and 48 months (8.8 ┬▒ 3.9 vs. 12.6 ┬▒ 4.6 U/kg/week/g/dL, p = 0.001; 8.8 ┬▒ 2.2 vs. 12.1 ┬▒ 5.7 U/kg/week/g/dL, p = 0.007; 10.5 ┬▒ 3.9 vs. 13.8 ┬▒ 4.9 U/kg/week/g/dL, p = 0.02; 8.3 ┬▒ 3.5 vs. 13.2 ┬▒ 4.4 U/kg/week/g/dL, respectively; p = 0.001) (Fig. 1B). The results of the unadjusted and adjusted logistic regression analyses for the high-frequency group are presented in Table 4. In the multivariate logistic regression analysis, the presence of diabetes mellitus (odds ratio [OR], 4.49; 95% confidence interval [CI], 1.38ŌĆō14.61; p = 0.01) and EPO dose (OR, 1.03; 95% CI, 1.01ŌĆō1.05; p = 0.002) significantly affected the high-frequency group. However, the route of EPO administration was not related to the high-frequency group.
Hemoglobin variability and cardiovascular outcomes
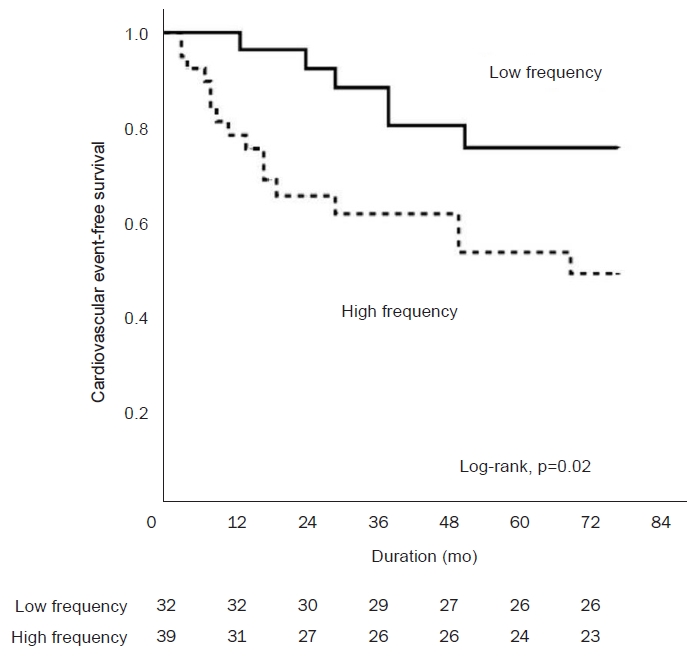
During the study period, 19 out of 71 patients (26.8%) died including nine cases (12.7%) of cardiovascular events and five cases (7.0%) of infection. Cardiovascular events occurred in 22 patients (31.0%) during the study period including six patients in the low-frequency group and 16 patients in the high-frequency group. In the survival analysis, the occurrence of cardiovascular events was significantly higher in the high-frequency group than in the low-frequency group (p = 0.02) (Fig. 2). However, seven patients (21.9%) died in the low-frequency group and 12 patients (30.8%) died in the high-frequency group with no significant difference between the two groups in all-cause mortality (log-rank p = 0.29). In cardiovascular mortality, there were three (9.4%) and six patients (15.4%), respectively, who did not have any significance between the two groups (log-rank p = 0.36).
The results of the unadjusted and adjusted Cox proportional hazard regression analyses for cardiovascular events are presented in Tables 5. In the adjusted Cox analysis, the high-frequency group (hazard ratio [HR], 2.96; 95% CI, 1.03ŌĆō8.79; p = 0.04), presence of diabetes mellitus (HR, 3.34; 95% CI, 1.31ŌĆō8.76; p = 0.01), vintage dialysis > 18 months (HR, 3.07; 95% CI, 1.02ŌĆō9.21; p = 0.045), and older age > 60 years (HR, 2.80; 95% CI, 1.12ŌĆō7.02; p = 0.028) were independent risk factors for the development of cardiovascular events.
Discussion
This post hoc analysis of a clinical study comparing IV administration with SC administration of EPO showed that the frequency of the value being outside the target Hb range was associated with the route of EPO administration, and that the high-frequency group was independently associated with cardiovascular events in HD patients.
In this study, there was no difference in the SD, residual SD of Hb, and coefficient of Hb variation according to the EPO administration route. Since it is difficult to maintain Hb values within the narrow target range, we categorized Hb variability according to the frequency of the value being outside this range (i.e., low-frequency vs. high-frequency groups). Our study showed that patients of the IV group were less frequently outside the target Hb range compared to those of the SC group. Furthermore, the coefficient of Hb variation was lower and Hb was less frequent than the lower limit level of Hb (< 9g/dL) in the low-frequency group.
Hb variability in HD patients was first described by Lacson et al. [17] and Berns et al. [18] in 2003. Kalantar-Zadeh and Aronoff [15] reported that factors influencing Hb variability included drug-related factors, patient characteristics, iron storage, infection, and inflammation. Of these factors, the EPO dose and administration intervals are modifiable factors in the management of HD-associated anemia [19]. In a previous study, Wright et al. [20] reported that the administration of EPO through the SC route reduced the EPO dose, increased its effectiveness, and improved patient outcomes compared to IV EPO administration. By contrast, Bommer et al. [21] reported no differences in Hb levels and EPO doses between IV and SC administration in HD patients within 48 weeks. Previous studies involved the analysis of the relationship between the route of EPO administration and the degree of Hb increase, and few studies have directly compared the relationship with Hb variability.
This study observed the outcome over 51 months using a single formulation of EPO. Therefore, our study exclusively evaluated the impact of the EPO administration route on Hb variability. Our result is similar to that of the post hoc analysis in a previous study [22]. Patel et al. [22] reported that Hb variability was slightly higher in SC administration compared to the IV administration of EPO. They suggested that the wide range of bioavailability (18%ŌĆō80%) was large because of differences in absorption from the SC tissue and the specific epoetin-dosing algorithm. In their study, EPO doses were adjusted by an absolute amount rather than as a percentage of the previously prescribed dose. Therefore, EPO administration through the SC route had a longer half-life, and the change in Hb may have been greater for a given change in EPO dose compared to the IV route. In the present study, the administered EPO dose was determined according to the degree of change in Hb, rather than administering an absolute amount of EPO. Therefore, the relationship between the EPO administration route and Hb variability was more accurately evaluated in our study even though similar results were obtained in both studies.
Recent studies have reported an increase in all-cause mortality in patients with high Hb variability [6,7,10], but no prospective study has analyzed Hb variability and cardiovascular outcomes to date. In the present prospective study, the frequency of the value being outside the target Hb range was independently related to cardiovascular events, and the high-frequency group was associated with higher incidences of cardiovascular events.
In our study, Hb variability did not exhibit a significant association with cardiovascular mortality and all-cause mortality. In a recent meta-analysis, Zhao et al. [7] demonstrated a 9% increase in the adjusted rate of death for each 1 g/dL increase in Hb variability. However, this relationship between Hb variability and cardiovascular mortality is inconsistent across studies. Eckardt et al. [11] reported the lack of an association between cardiovascular mortality and Hb variability in 5,037 HD patients. In their study, Hb variability was assessed using the parameters within-patient SD, residual SD, and method of fluctuation across the target range (11.0ŌĆō12.5 g/dL). They also reported that Hb variability was not related to all-cause mortality in HD patients [11]. By contrast, Lin et al. [23] demonstrated in a retrospective study that high Hb variability is an independent risk factor for cardiovascular mortality in HD patients. Since the criteria for Hb variability defined in each study differed and because of the nature of retrospective studies, it is difficult to accurately evaluate the relationship between Hb variability and cardiovascular mortality.
Unlike previous studies, the current study was conducted as a prospective trial. The high-frequency group was associated with more cardiovascular events and higher Hb variation compared to the low-frequency group. Although the proportion of diabetic patients did not differ between the two groups, the proportion tended to be high in the high-frequency group. In previous studies, it is known that chronic inflammation, autonomic neuropathy, and microvascular damage caused by diabetes mellitus blunt the response of EPO in chronic kidney disease [24,25]. The proportion of diabetes affects Hb variability, possibly leading to increased cardiovascular events in the high-frequency group. However, in multivariate Cox analysis, the high-frequency group was related to the occurrence of cardiovascular events independent of the presence of diabetes. This finding suggests that the occurrence of cardiovascular events in HD patients may be related to Hb variability. The high-frequency group tended to exhibit a poor response to EPO and thus, a relatively large amount of EPO was required to reach the target Hb level, significantly increasing the number of cardiovascular events. Moreover, a high EPO dose has been described as an independent predictor of adverse cardiovascular outcomes [26,27]. Additionally, exogenous EPO can stimulate cellular proliferation and matrix accumulation in blood vessels, increase platelet production and calcium signaling, and contribute to prothrombotic effects. In agreement with this, the incidence of cardiovascular events was high in patients of the high-frequency group even though no correlation between Hb variability and cardiovascular mortality was observed.
The results of our study should be interpreted with caution given the following limitations. First, this study was a post hoc analysis of a previous randomized controlled trial and was not designed specifically for this aim. Therefore, the sample size may be too small to confirm statistical significance for some observations. Second, at the time the study was performed, laboratory tests to assess inflammatory status, such as C-reactive protein, were not conducted. Third, we studied the response to one EPO formulation. The effects may differ for other EPO formulations. Finally, there was a difference between the target Hb at the time of the study and the current anemia treatment guidelines. Therefore, further randomized studies on the administration route of EPO according to the current guidelines are necessary.
The strengths of the study are that it is a prospective study and that it has been followed up for a long period of time.
In conclusion, IV EPO administration in HD patients can better maintain Hb levels within the target range, and a decreased frequency of missing these target values prevents cardiovascular events from occurring.
 PDF Links
 PubReader
 ePub Link
 Full text via DOI
 Download Citation
 Print
Print


")


