Kidney Res Clin Pract > Volume 40(3); 2021 > Article
Song, Oh, Choi, Kim, Ryu, Kim, Park, Ma, Kim, and Bae: Hyperuricemia is a risk factor for the progression to end-stage renal disease in minimal change disease

Abstract

Background

Minimal change disease (MCD) is one of the most common causes of nephrotic syndrome worldwide. Hyperuricemia increases the end-stage renal disease (ESRD) risk in glomerulonephritis. In this study, we aimed to determine the effect of high serum uric acid levels on the progression to ESRD in MCD.

Methods

A total of 800 patients diagnosed with MCD by kidney biopsy were retrospectively analyzed. We determined the relationship of hyperuricemia with the progression to ESRD in MCD using the Cox proportional hazard model and Kaplan-Meier survival analysis. The primary outcome was defined as the initiation of dialysis or kidney transplantation.

Results

A total of 42 patients (5.3%) progressed to ESRD during the follow-up period. In the restricted cubic spline curve, serum uric acid levels exhibited a positive correlation with ESRD progression in patients with MCD. In the fully adjusted model, the risk of MCD progression increased by 29% for every 1 mg/dL increase in the baseline serum uric acid level (hazard ratio [HR], 1.29; 95% confidence interval [CI], 1.09–1.54; p = 0.004). Falling into the high uric acid group (serum uric acid level > 7 mg/dL in men and > 6 mg/dL in women) was also a risk factor for progression of MCD to ESRD (HR, 3.40; 95% CI, 1.59–7.31; p < 0.001).

Conclusion

Our study shows that hyperuricemia is an independent risk factor for the progression to ESRD in patients with MCD.

Introduction

Minimal change disease (MCD) is a kidney disease in which large amounts of protein are excreted via urine, and it is one of the most common causes of nephrotic syndrome worldwide [1]. The prognosis is relatively good, and the disease usually responds to corticosteroid treatment with disappearance of the ultrastructural alteration [2]. Therefore, chronic kidney disease or end-stage renal disease (ESRD) is not typically seen in adult MCD. As a result, little is known about the risk factors for ESRD progression in MCD [3]. However, acute kidney injury (AKI) occurs in 10% to 25% of adult patients diagnosed with MCD [46]. These patients tend to be older males with hypertension and have more severe proteinuria, hypoalbuminemia, and arteriosclerosis on kidney biopsy than patients who do not develop AKI [6,7]. Unfortunately, AKI is not a self-limiting event. Increasing evidence has demonstrated the bidirectional link between AKI and chronic kidney disease (CKD) [8].
Serum uric acid is the final enzymatic product of purine metabolism [9]. Hyperuricemia has been associated with AKI, CKD, hypertension, dyslipidemia, diabetes mellitus (DM), stroke, cardiovascular events, and hepatitis B virus-associated glomerulonephritis [1015]. We recently reported that hyperuricemia was also a risk factor for progression of immunoglobulin A nephropathy and lupus nephritis in women [16,17]. However, little is known about the effect of uric acid on progression to ESRD in patients with MCD. Therefore, we investigated the effect of high serum uric acid levels on progression to ESRD in MCD.

Methods

Data source and study population

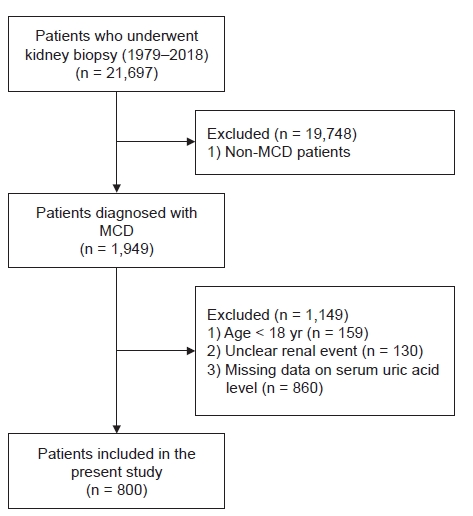
Of the 21,697 patients who underwent kidney biopsies from January 1979 until October 2018 at 19 Korean university hospitals (Kyungpook National University Hospital, Kyung Hee University Hospital at Gandong, Kangdong Sacred Heart Hospital, Gangnam Severance Hospital, Korea University Guro Hospital, Korea University Anam Hospital, Eulji University Hospital, Seoul National University Boramae Medical Center, Seoul National University Bundang Hospital, Seoul National University Hospital, Severance Hospital, Pusan National University Yangsan Hospital, The Catholic University of Korea, Eunpyeong St. Mary’s Hospital, Ewha Womans University Mokdong Hospital, National Health Insurance Service Ilsan Hospital, Chonnam National University Hospital, Chonbuk National University Hospital, and Hallym University Sacred Heart Hospital), 1,949 patients were diagnosed with MCD. We excluded 159 patients aged <18 years, 130 patients in whom the status of disease progression was unknown, and 860 patients whose serum uric acid levels were not measured. Finally, data from 800 patients were retrospectively analyzed in this study. Fig. 1 shows the flowchart for selecting cases for this study.

Study endpoint, definitions, and measurements

The primary endpoint of the study was MCD progression, defined as the initiation of dialysis or kidney transplantation. In our study, we defined the ‘hyperuricemia group’ as individuals with a serum uric acid level > 7 mg/dL in men and > 6 mg/dL in women [18]. The estimated glomerular filtration rate (eGFR) was calculated using the original Modification of Diet in Renal Disease equation for adults [19].

Statistical analyses

All continuous variables were tested for normality using the Shapiro-Wilk test. Normally distributed data are expressed as mean ± standard deviation, and skewed data are expressed as the median and interquartile range (25th percentile–75th percentile). To compare the clinical characteristics and differences between the control group and hyperuricemia group, the Student t-test was used for the normally distributed variables and the Mann-Whitney U test was used to analyze the skewed data. The categorical variables were expressed as numbers and percentages, and the chi-squared test was used to compare the groups. Kaplan-Meier survival curves with log-rank tests and a univariate Cox proportional hazards model were used to examine the effect of the serum uric acid level on MCD progression. A multivariate Cox proportional hazards regression model was applied to adjust the variables that may affect MCD progression. Hazard ratios (HRs) and 95% confidence intervals (CIs) were calculated to estimate the risk of MCD progression. We examined the assumption of the proportional hazard in the Cox model using cox.zph() in R. We stratified DM to satisfy the assumption of the proportional hazard in the fully adjusted model. We used restricted cubic spline curve to illustrate the nonlinear association between the serum uric acid level and MCD progression. We used four knots for the restricted cubic spline curve. The data were analyzed and plotted using R, version 4.0.2 (R Foundation for Statistical Computing, Vienna, Austria). All statistical tests were two-tailed, and a p-value of <0.05 was considered statistically significant.

Ethical approval and informed consent

This study complied with the tenets of the Declaration of Helsinki. Because the database used in this study did not include personal identifiers and the study was retrospective and observational in its design, the need for informed consent was waived. The study was approved by the Institutional Review Board of Chonnam National University Hospital (CNUH-EXP-2020-312).

Results

Baseline characteristics of the study population

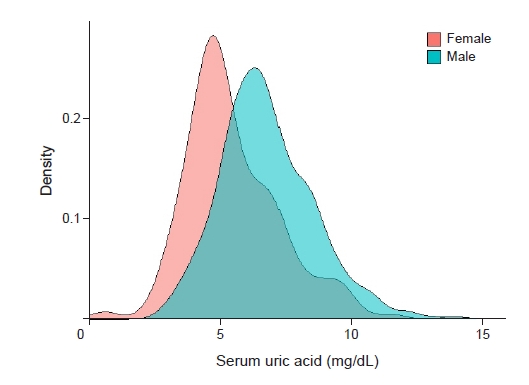
The baseline characteristics of the participants are presented in Table 1. The mean patient age was 43.1 ± 18.3 years, and 475 participants (59.4%) were male. In total, 82 participants (10.3%) had DM, and the mean serum creatinine was 1.1 ± 0.8 mg/dL at baseline. Participants in the high uric acid group had significantly higher serum creatinine (1.4 mg/dL vs. 0.9 mg/dL, p < 0.001), higher blood urea nitrogen (26.4 mg/dL vs. 16.3 mg/dL, p < 0.001), lower serum protein (5.1 g/dL vs. 5.4 g/dL, p = 0.001), lower serum albumin (2.6 g/dL vs. 2.9 g/dL, p < 0.001), higher urine protein-to-creatinine ratio (7.2 g/g Cr vs. 6.2 g/g Cr, p = 0.04), higher prevalence of hypertension (38.2% vs. 28.7%, p = 0.007), higher body mass index (25.5 kg/m2 vs. 24.3 kg/m2, p < 0.001), and higher systolic blood pressure (126 mmHg vs. 122 mmHg, p = 0.003) than those in the control group. The distribution of serum uric acid levels differed significantly according to sex (Fig. 2).

Independent risk factors for progression of minimal change disease to end-stage renal disease

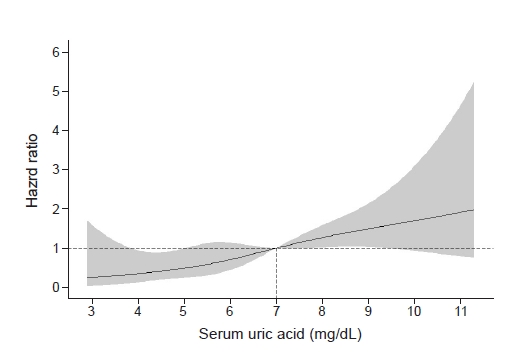
A total of 42 patients (5.3%) have progressed to ESRD during the follow-up period. The unadjusted analysis is presented in Supplementary Table 1 (available online). We have also created a Cox regression model using restricted cubic spline curve to assess the association between serum uric acid level and HR of MCD progression (Fig. 3). The serum uric acid level exhibited a positive correlation with MCD progression.
Adjusted Cox proportional hazard models were used to determine whether serum uric acid levels and falling into the high uric acid group were independent risk factors for MCD progression. In the fully adjusted model, the risk of MCD progression increased by 29% for every 1 mg/dL increase in the baseline serum uric acid level (HR, 1.29; 95% CI, 1.09–1.54; p = 0.004). Falling into the high uric acid group was also a risk factor for progression of MCD to ESRD (HR, 3.40; 95% CI, 1.59–7.31; p < 0.001) (Table 2).
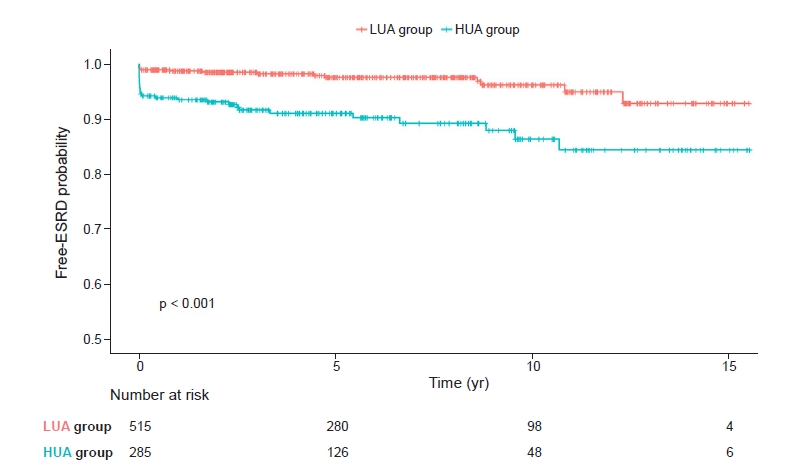
Kaplan-Meier survival curves showed statistically significant differences between the high uric acid group and the low uric acid group in relation to MCD progression to ESRD (p < 0.001) (Fig. 4).

Sensitivity analysis

Since the number of renal events was small and may lead to an over-fitting problem, we performed a propensity score-adjusted analysis by combining the covariates. The propensity score-matching results showed that falling into the high uric acid group (HR, 2.37; 95% CI, 1.20–4.68; p = 0.013) and high serum uric acid (HR, 1.17; 95% CI, 1.01–1.35; p = 0.004) were risk factors for progression of MCD to ESRD (Table 3). To exclude the possibility of an initial free-ESRD probability gap in Kaplan-Meier curves affecting the final free-ESRD probability, we analyzed Cox proportional hazard models, except renal events in the first year. This sensitivity analysis is presented in Table 3.

Discussion

Our study showed that hyperuricemia is an independent risk factor for the progression of MCD. A recent study reported that serum uric acid levels at the time of biopsy predicted steroid-resistant nephrotic syndrome (SRNS) in children [20]. SRNS children with hyperuricemia had a significantly higher rate of glomerulosclerosis, tubular atrophy, diffuse interstitial fibrosis, and ESRD at last follow-up compared with those without hyperuricemia. Renal survival analysis of children showed that the hyperuricemia group compared with the non-hyperuricemia group had a higher rate of SRNS progression. However, the association between MCD and hyperuricemia in adults was previously unknown. Therefore, this study has important implications.
Various biologic mechanisms could explain the relationship between serum uric acid and kidney disease progression. The main histologic feature of MCD is foot process effacement. Asakawa et al. [21] revealed that hyperuricemia is related to podocyte injury and albuminuria. Hyperuricemic rats showed significant albuminuria, and the podocyte injury marker, desmin, was upregulated in the glomeruli. Urinary 8-hydroxy-2'-deoxyguanosine levels were significantly increased and correlated with albuminuria and podocytopathy.
The progression of MCD is related to a combination of ischemic injury, tubular injury, and diminished capillary filtration [22,23]. In an in vitro study, hyperuricemia decreased the expression of E-cadherin in epithelial cells resulting in a loss of cell-to-cell contact in the renal tubular cells of rats [24]. Uric acid also causes kidney injury by inducing endothelin-1 activation and fibroblast expansion [25]. Endothelin-1 drives the development of glomerulosclerosis and podocyte loss through direct activation of endothelin receptors and nuclear factor-κB and β-catenin pathways in podocytes [26].
The progression of MCD is also related to hypertension and arteriosclerosis on kidney biopsy [7]. Sánchez-Lozada et al. [27] established that hyperuricemia resulted in afferent arteriole thickening associated with renal cortical vasoconstriction and glomerular hypertension in rats. Uric acid also stimulates activation of the renin-angiotensin system. Uric acid induces the proliferation of vascular smooth muscle cells and oxidative stress by stimulating the vascular renin-angiotensin system [28].
In idiopathic nephrotic syndrome including MCD, the current hypothesis suggests that immune cells release a putative factor, which alters podocyte function resulting in nephrotic proteinuria [29,30]. CD4+ cells, CD8+ cells, and macrophages have been shown to be prominent components of interstitial inflammation in chronic proteinuric renal disease [31]. Most CD8+ cells have suppressor or cytotoxic functions and induce renal injury [32]. Webb et al. [33] revealed that uric acid directly activated primary human T cells. Uric acid may help dendritic cells recognize apoptotic cells, and it activates CD8+ cells in the immune system [34]. Consequently, hyperuricemia may cause the progression of MCD by several different biologic mechanisms.
Our study has several strengths. First, to the best of our knowledge, this study is the first one to reveal the association between hyperuricemia and MCD progression in adults. Second, this study has a large sample size and a long-term follow-up regarding disease outcomes. Our study also has some limitations. First, as this was an observational study, we could not establish the causality between hyperuricemia and MCD progression. However, observational studies are powerful tools that enable assessment of epidemiologic relationships, and we capitalized on the complementary analytic methods to examine the relationship between serum uric acid and MCD progression [35]. Second, due to the lack of data describing patient use of uric acid-lowering medications and corticosteroids, we could not evaluate the effects of medications on disease progression. Third, as we mentioned above, MCD progression has previously been shown to be related to arteriosclerosis or tubular atrophy in kidney biopsies. However, we could not evaluate their relationship in this study due to lack of detailed findings from the kidney biopsy.
In conclusion, our study showed that hyperuricemia was associated with the progression of MCD. We suggest that screening for hyperuricemia in MCD patients would help identify high-risk groups for disease progression. It could help to manage the MCD patients in a timely manner.

Supplementary Materials

Notes

Conflicts of interest

All authors have no conflicts of interest to declare.

Funding

This research was supported by the National Research Foundation (NRF) of Korea grants funded by the Korean government, Ministry of Science and ICT (2019R1A2C1003971), Chonnam National University Hospital Biomedical Research Institute Grant (BCRI 20025&20076). The sponsor had no role in study design, data collection and analysis, decision to publish, or preparation of the manuscript.

Authors’ contributions

Conceptualization: EHB, TRO, SHS

Data curation: TRO, SHS, CSK, SHP

Formal analysis: TRO, SHS

Investigation: HSC, CSK, DRR, SGK, SHP, SKM, SWK, EHB

Funding acquisition: EHB

Writing–original draft: SHS, TRO

Writing–review & editing: SHS, EHB, SKM, SWK

All authors read and approved the final manuscript.

Acknowledgments

We would like to thank the KoGNET investigators for participating in this study: Ho Jun Chin, Seoul National University College of Medicine and Seoul National University Bundang Hospital (Leader of KoGNET, mednep@hanmail.net); Hajeong Lee, Seoul National University Hospital; Eun Hui Bae, Chonnam National University Hospital; Tae Ik Chang, National Health Insurance Service Medical Center, Ilsan Hospital; Kyung Pyo Kang, Chonbuk National University; Young Joo Kwon, Korea University; Sung Gyun Kim, Hallym University; DongRyol Ryu, Ewha Womans University; Shin Young Ahn, Korea University; Se Won Oh, Korea University; Ji-Eun Oh, Hallym University; Dong Won Lee, Pusan National University; Sang Ho Lee, Kyung Hee University; Sung Woo Lee, Eulji University; Jung Pyo Lee, Seoul Metropolitan Government Seoul National University Boramae Medical Center; Jong Hyun Jhee, Yonsei University; Bum Soon Choi, The Catholic University of Korea; Seung Hyeok Han, Yonsei University.

Figure 1.

Flow diagram of the study population.

MCD, minimal change disease.
j-krcp-20-220f1.jpg
Figure 2.

The difference in distributions of the serum uric acid levels according to sex.

The median serum uric acid level was 5.5 mg/dL in females and 6.8 mg/dL in males.
j-krcp-20-220f2.jpg
Figure 3.

Restricted cubic spline curve of the hazard ratio of serum uric acid for end-stage renal disease survival probability.

The serum uric acid level exhibited a positive correlation with minimal change in disease progression.
j-krcp-20-220f3.jpg
Figure 4.

Kaplan-Meier free-ESRD probability curve with the log-rank test between the hyperuricemia group and MCD progression.

MCD progression occurred more frequently in the high uric acid (HUA) group than in the low uric acid (LUA) group.
ESRD, end-stage renal disease; MCD, minimal change disease.
j-krcp-20-220f4.jpg
Table 1.
Baseline characteristics of the study population
Variable Total High uric acid group Control group p-value
No. of patients 800 285 515
Uric acid (mg/dL) 6.27 ± 1.93 8.26 ± 1.45 5.17 ± 1.11 <0.001
Age (yr) 43.1 ± 18.3 44.6 ± 18.7 42.2 ± 18.1 0.07
Male sex 475 (59.4) 181 (63.5) 294 (57.1) 0.09
Diabetes mellitus 82 (10.3) 34 (11.9) 48 (9.3) 0.31
Hypertension (%) 256 (32.0) 109 (38.2) 147 (28.7) 0.007
Smoking (%) 192 (24.0) 73 (25.6) 119 (23.1) 0.40
Creatinine (mg/dL) 1.2 (0.7–1.2) 1.4 (0.9–1.6) 0.9 (0.7–1.0) <0.001
MDRD eGFR (mL/min/1.73 m2) 85.4 (55.6–106.3) 67.4 (43.5–87.6) 96.7 (76.6–116.8) <0.001
BUN (mg/dL) 19.9 ± 14.4 26.4 ± 1.85 16.3 ± 9.8 <0.001
Hemoglobin (g/dL) 14.0 ± 2.0 14.0 ± 2.1 14.0 ± 2.0 0.85
Glucose (mg/dL) 105.9 ± 34.4 107.2 ± 35.5 105.3 ± 33.8 0.46
Protein (g/dL) 5.3 ± 1.4 5.1 ± 1.4 5.4 ± 1.4 0.001
Albumin (g/dL) 2.8 ± 1.2 2.6 ± 1.1 2.9 ± 1.2 <0.001
Cholesterol (mg/dL) 309.2 ± 143.5 318.7 ± 144.2 304.1 ± 142.9 0.18
UPCR (g/gCr) 6.6 (1.0–10.2) 7.2 (1.2–10.8) 6.2 (0.9–9.6) 0.04
Body mass index (kg/m2) 24.7 ± 3.9 25.5 ± 3.7 24.3 ± 4.0 <0.001
SBP (mmHg) 123.3 ± 16.8 125.9 ± 18.5 121.9 ± 15.7 0.003
DBP (mmHg) 77.5 ± 12.1 79.0 ± 14.0 76.8 ± 10.9 0.03
Follow-up (yr) 5.8 ± 4.1 5.3 ± 4.3 6.1 ± 4.0 0.004

Data are expressed as number only, mean ± standard deviation, number (%), or median (interquartile range).

MDRD, modification of diet in renal disease; eGFR, estimated glomerular filtration rate; BUN, blood urea nitrogen; DBP, diastolic blood pressure; UPCR, urine protein-to-creatinine ratio; SBP, systolic blood pressure.

Table 2.
Hazard ratio for progression of minimal change disease by uric acid with Cox proportion hazard models
Model High uric acid group
Serum uric acid
HR (95% CI) p-value HR (95% CI) p-value
Crude 3.88 (2.04–7.37) <0.001 1.26 (1.10–1.44) <0.001
Model 1 3.66 (1.92–6.97) <0.001 1.26 (1.10–1.44) <0.001
Model 2 3.79 (1.96–7.29) <0.001 1.27 (1.11–1.46) <0.001
Model 3 3.40 (1.59–7.31) < 0.001 1.29 (1.09–1.54) 0.004

Crude: unadjusted analysis; model 1: adjusted for age and sex; model 2: model 1 + diabetes mellitus, hypertension; model 3: model 2 + albumin, body mass index, creatine, hemoglobin, smoking.

CI, confidence interval; HR, hazard ratio.

Table 3.
Sensitivity analysis using a propensity score-adjusted analysis model and Cox hazard model excluding renal events in the first year
Model High uric acid group
Serum uric acid
HR (95% CI) p-value HR (95% CI) p-value
Propensity score-adjusted analysis model 2.37 (1.20–4.68) 0.013 1.17 (1.01–1.35) 0.004
Cox hazard model excluding renal events in the first year 3.59 (1.14–11.30) 0.028 1.24 (0.93–1.65) 0.152

CI, confidence interval; HR, hazard ratio.

References

1. Johnson RJ, Feehally John, Floege J. Comprehensive clinical nephrology. 6th ed. Edinburgh: Elsevier; 2019.
2. Vivarelli M, Massella L, Ruggiero B, Emma F. Minimal change disease. Clin J Am Soc Nephrol 2017;12:332–345.
crossref pmid
3. Hogan J, Radhakrishnan J. The treatment of minimal change disease in adults. J Am Soc Nephrol 2013;24:702–711.
crossref pmid
4. Gesualdo L, Di Palma AM, Morrone LF, et al. The Italian experience of the national registry of renal biopsies. Kidney Int 2004;66:890–894.
crossref pmid
5. Haas M, Meehan SM, Karrison TG, Spargo BH. Changing etiologies of unexplained adult nephrotic syndrome: a comparison of renal biopsy findings from 1976-1979 and 1995-1997. Am J Kidney Dis 1997;30:621–631.
crossref pmid
6. Waldman M, Crew RJ, Valeri A, et al. Adult minimal-change disease: clinical characteristics, treatment, and outcomes. Clin J Am Soc Nephrol 2007;2:445–453.
crossref pmid
7. Jennette JC, Falk RJ. Adult minimal change glomerulopathy with acute renal failure. Am J Kidney Dis 1990;16:432–437.
crossref pmid
8. Guzzi F, Cirillo L, Roperto RM, Romagnani P, Lazzeri E. Molecular mechanisms of the acute kidney injury to chronic kidney disease transition: an updated view. Int J Mol Sci 2019;20:4941.
crossref pmid pmc
9. Sautin YY, Johnson RJ. Uric acid: the oxidant-antioxidant paradox. Nucleosides Nucleotides Nucleic Acids 2008;27:608–619.
crossref pmid pmc
10. Hahn K, Kanbay M, Lanaspa MA, Johnson RJ, Ejaz AA. Serum uric acid and acute kidney injury: a mini review. J Adv Res 2017;8:529–536.
crossref pmid
11. Gustafsson D, Unwin R. The pathophysiology of hyperuricaemia and its possible relationship to cardiovascular disease, morbidity and mortality. BMC Nephrol 2013;14:164.
crossref pmid pmc
12. Johnson RJ, Kang DH, Feig D, et al. Is there a pathogenetic role for uric acid in hypertension and cardiovascular and renal disease? Hypertension 2003;41:1183–1190.
crossref pmid
13. Li M, Hou W, Zhang X, Hu L, Tang Z. Hyperuricemia and risk of stroke: a systematic review and meta-analysis of prospective studies. Atherosclerosis 2014;232:265–270.
crossref pmid
14. Nakanishi N, Okamoto M, Yoshida H, Matsuo Y, Suzuki K, Tatara K. Serum uric acid and risk for development of hypertension and impaired fasting glucose or Type II diabetes in Japanese male office workers. Eur J Epidemiol 2003;18:523–530.
crossref pmid
15. Zhuang Y, Yu Y, Huang Y, Zhong X. Study on hyperuricemia in HBV-associated glomerulonephritis. Am J Clin Pathol 2014;141:72–77.
crossref pmid
16. Oh TR, Choi HS, Kim CS, et al. The effects of hyperuricemia on the prognosis of IgA nephropathy are more potent in females. J Clin Med 2020;9:176.
crossref pmid pmc
17. Oh TR, Choi HS, Kim CS, et al. Serum uric acid is associated with renal prognosis of lupus nephritis in women but not in men. J Clin Med 2020;9:773.
crossref pmid pmc
18. Jin M, Yang F, Yang I, et al. Uric acid, hyperuricemia and vascular diseases. Front Biosci (Landmark Ed) 2012;17:656–669.
19. Levey AS, Bosch JP, Lewis JB, Greene T, Rogers N, Roth D. A more accurate method to estimate glomerular filtration rate from serum creatinine: a new prediction equation. Modification of Diet in Renal Disease Study Group. Ann Intern Med 1999;130:461–470.
crossref pmid
20. Xiao H, Li Q, Wang F, Yao Y, Zhong X. [Relationship between hyperuricemia and primary nephrotic syndrome in children]. Zhonghua Er Ke Za Zhi 2014 52:859862.In Chinese.
21. Asakawa S, Shibata S, Morimoto C, et al. Podocyte injury and albuminuria in experimental hyperuricemic model rats. Oxid Med Cell Longev 2017;2017:3759153.
crossref pmid pmc
22. Nicholas PD 3rd, Garrahy I. Adult minimal change disease with acute kidney injury: a case report and literature review. J Community Hosp Intern Med Perspect 2019;9:507–510.
crossref pmid pmc
23. Fujigaki Y, Tamura Y, Nagura M, et al. Unique proximal tubular cell injury and the development of acute kidney injury in adult patients with minimal change nephrotic syndrome. BMC Nephrol 2017;18:339.
crossref pmid pmc
24. Ryu ES, Kim MJ, Shin HS, et al. Uric acid-induced phenotypic transition of renal tubular cells as a novel mechanism of chronic kidney disease. Am J Physiol Renal Physiol 2013;304:F471–F480.
crossref pmid
25. Romi MM, Arfian N, Tranggono U, Setyaningsih WA, Sari DC. Uric acid causes kidney injury through inducing fibroblast expansion, Endothelin-1 expression, and inflammation. BMC Nephrol 2017;18:326.
crossref pmid pmc
26. Lenoir O, Milon M, Virsolvy A, et al. Direct action of endothelin-1 on podocytes promotes diabetic glomerulosclerosis. J Am Soc Nephrol 2014;25:1050–1062.
crossref pmid pmc
27. Sánchez-Lozada LG, Tapia E, Santamaría J, et al. Mild hyperuricemia induces vasoconstriction and maintains glomerular hypertension in normal and remnant kidney rats. Kidney Int 2005;67:237–247.
crossref pmid
28. Corry DB, Eslami P, Yamamoto K, Nyby MD, Makino H, Tuck ML. Uric acid stimulates vascular smooth muscle cell proliferation and oxidative stress via the vascular renin-angiotensin system. J Hypertens 2008;26:269–275.
crossref pmid
29. Sahali D, Sendeyo K, Mangier M, et al. Immunopathogenesis of idiopathic nephrotic syndrome with relapse. Semin Immunopathol 2014;36:421–429.
crossref pmid pmc
30. Lai KW, Wei CL, Tan LK, et al. Overexpression of interleukin-13 induces minimal-change-like nephropathy in rats. J Am Soc Nephrol 2007;18:1476–1485.
crossref pmid
31. Wang Y, Wang YP, Tay YC, Harris DC. Progressive adriamycin nephropathy in mice: sequence of histologic and immunohistochemical events. Kidney Int 2000;58:1797–1804.
crossref pmid
32. Wang Y, Wang YP, Tay YC, Harris DC. Role of CD8(+) cells in the progression of murine adriamycin nephropathy. Kidney Int 2001;59:941–949.
crossref pmid
33. Webb R, Jeffries M, Sawalha AH. Uric acid directly promotes human T-cell activation. Am J Med Sci 2009;337:23–27.
crossref pmid
34. Shi Y, Evans JE, Rock KL. Molecular identification of a danger signal that alerts the immune system to dying cells. Nature 2003;425:516–521.
crossref pmid
35. Greene T. Randomized and observational studies in nephrology: how strong is the evidence? Am J Kidney Dis 2009;53:377–388.
crossref pmid


ABOUT
BROWSE ARTICLES
EDITORIAL POLICY
FOR CONTRIBUTORS
Editorial Office
#301, (Miseung Bldg.) 23, Apgujenog-ro 30-gil, Gangnam-gu, Seoul 06022, Korea
Tel: +82-2-3486-8736    Fax: +82-2-3486-8737    E-mail: registry@ksn.or.kr                

Copyright © 2024 by The Korean Society of Nephrology.

Developed in M2PI

Close layer